
InvestViable does not publish buy or sell recommendations on individual securities. All analysis is based on public financial data and a transparent methodology. The Investment Score formula is proprietary; the inputs and what the score evaluates are documented.
Why DCF errors are upstream of the math
The math in a DCF is mechanical. Forecast free cash flows for an explicit period (usually 5 to 10 years), discount each year by the cost of capital, add a terminal value, subtract net debt, divide by shares outstanding. Every spreadsheet in existence handles the arithmetic the same way.
The variance in DCF outputs across analysts looking at the same company comes from upstream choices: the revenue growth schedule, the steady-state margin, the beta, the equity risk premium, the terminal growth assumption, the share-count treatment, the off-balance-sheet liabilities someone forgot to capitalize. A model with reasonable inputs and approximate math will produce a more defensible value than a model with elegant math and bad inputs.
Most published critiques of DCF (that it is "too sensitive to assumptions") are really critiques of the assumptions. The sensitivity is a feature: it forces the analyst to defend the inputs explicitly. When two analysts produce DCF intrinsic values that diverge by 40 percent on the same company, the divergence almost always lives in the inputs, not the discounting math.
Upstream of those inputs sits the fundamentals data layer itself: the filings the inputs are extracted from, the cross-statement reconciliation that ties them together, the restatement and non-recurring-item treatment that determines what counts as a stable operating base. The fundamental analysis checklist is the verification overlay one step earlier in the workflow. It audits the data before the analyst commits to a model input.
The audit framework that follows assumes the math is fine. It targets the six input categories where forecasting discipline, accounting treatment, and benchmarking actually determine the output. The structure parallels the DCF construction methodology covered in the pillar article, but the orientation is inverted: this is a verification overlay, not a build guide.
The DCF inputs checklist, by category
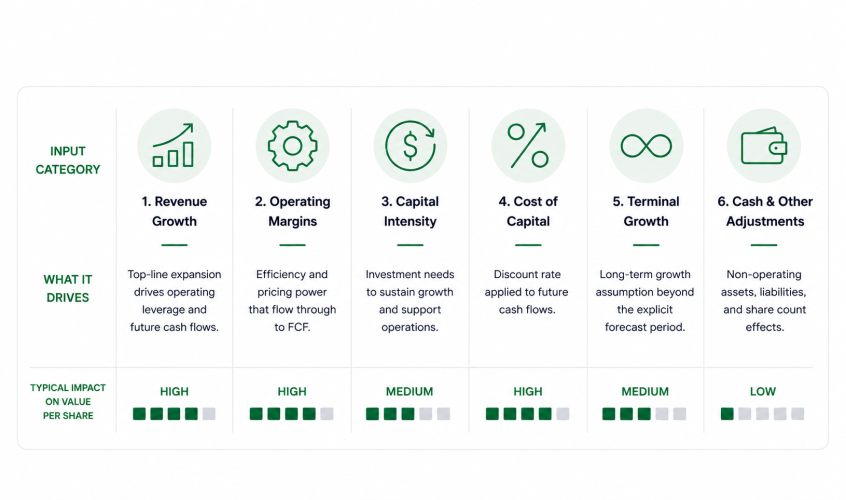
The DCF inputs checklist below covers six input categories. They are ordered roughly by how much they typically move the intrinsic value estimate: revenue growth and margins compound through the explicit forecast period; the discount rate sets the present-value weighting on every cash flow; terminal value structure usually accounts for 50 to 70 percent of total enterprise value in a finite-period DCF; share count and capital structure determine what the equity holder actually receives.
For each category, the verification questions follow the same pattern: where does the input come from, what assumption is implicit in it, how does it compare to a defensible benchmark, and what error mode emerges when it goes wrong. The questions are not specific to a single industry or business model. They apply to the operating company being valued, whether that is a mature consumer-staples compounder, a software platform, an industrial conglomerate, or a diversified manufacturer. Industry-specific verification (banks, REITs, insurers, regulated utilities) requires additional checks not covered here; those businesses are valued with adjusted frameworks where the standard equity-DCF does not apply cleanly.
Use the checklist as an audit overlay on top of any DCF, not as a substitute for understanding the business being valued. The checklist surfaces where inputs deviate from defensible practice; the analyst still has to decide whether the deviation is justified by the underlying economics.
Figure 1. The six DCF input categories and their typical impact on intrinsic value
Approximate sensitivity of the per-share intrinsic value to a one-standard-deviation perturbation in each input category, for a representative mid-cap industrial company on a 10-year explicit-period DCF.
Operating inputs: revenue and margins
Revenue growth assumptions are the single largest source of optical variance across DCF models. A two-percentage-point difference in compound annual growth rate over a ten-year forecast period changes the explicit-period free cash flow base by roughly 22 percent before terminal value enters the calculation.
The verification questions on revenue:
- Is the revenue path benchmarked against the company's actual recent trajectory, or against management's narrative? Management commentary describes the path the company would like to take. Recent realized growth describes the path the business has actually demonstrated. The two diverge frequently. For a hyperscale software firm like Microsoft (MSFT), the stated AI-driven revenue acceleration narrative deserves to be reconciled against the recent realized segment growth in Intelligent Cloud, not pasted in at the narrative figure.
- Does the growth schedule include a fade? A flat 10 percent revenue growth held for 10 years assumes the business retains every dimension of pricing power, every dollar of market share, and every TAM expansion advantage indefinitely. Mature businesses fade. Most growth schedules should taper toward GDP-plus by year 7 to 10 unless there is a specific reason to believe otherwise.
- Are unusual recent quarters baselined out? A revenue print inflated by one-time pricing, an inventory pull-forward, or a regulatory tailwind should not anchor the forecast path.
Margins carry a parallel set of verification questions:
- Is the steady-state operating margin reconcilable with the industry's structural margin? A 30 percent operating margin assumed for a wholesale distributor is industry-incompatible. Industry-level margins are publicly available; benchmarking is not optional.
- Are below-the-line items routinely classified as one-offs? "Adjusted" margins that exclude restructuring, impairments, and stock-based compensation in every reporting period are not adjusted margins; they are operating margins of a business that systematically generates these costs.
- Does the margin path account for cost-side inflation as well as price-side? A model that expands operating margin from 20 to 28 percent over five years implicitly assumes revenue inflation runs faster than cost inflation for the duration. That assumption needs a structural reason (fixed-cost leverage, mix shift, scale economics), not just a desired output.
Discount-rate inputs to verify
The discount rate is where a DCF most often inherits assumptions from sources the analyst has not actually examined. To verify DCF inputs on the discount rate, four components need separate scrutiny: the risk-free rate, the equity risk premium, the beta, and the after-tax cost of debt (if a WACC framework is in use rather than a pure cost-of-equity discount).
- Risk-free rate. Use the current 10-year Treasury yield for U.S. equity DCFs, the equivalent sovereign yield for non-U.S. companies, and match the term roughly to the explicit forecast period. Using a 1-year T-bill rate for a 10-year DCF understates the discount rate; using a 30-year rate for a 5-year forecast can do the opposite. The Treasury yield is observable. Do not carry a stale figure from a model template.
- Equity risk premium. Aswath Damodaran's monthly-updated implied ERP estimate is the practitioner reference point. A "standard 6 percent ERP" plugged in regardless of current market conditions inherits a calibration from a different macro environment than today's.
- Beta. Raw historical regression beta against the S&P 500 over a trailing 2-to-5 year window is the starting point. The questions are: what period was the regression run over (a beta that includes the 2020 dislocation reads differently than one that excludes it), and has the beta been adjusted toward 1.0 via the Blume or Vasicek correction? Both questions have defensible answers, but the model should commit to one and document it.
- After-tax cost of debt. Use the company's actual marginal borrowing rate as proxied by recent debt issuance or current corporate bond spreads in the same rating bucket, not the historical coupon on legacy debt issued in a different rate environment. For Johnson & Johnson (JNJ), the relevant cost of debt today reflects its current credit spread, not the coupon on a bond issued at 2020 rates.
A common error mode: a discount rate that aggregates to 7.5 percent WACC reads as conservative until each component is unpacked and the analyst realizes the beta was 0.7, the ERP was 4.5 percent, and the after-tax cost of debt was 2 percent. Re-derive the discount rate from current components rather than trusting a template figure.
Terminal value structure
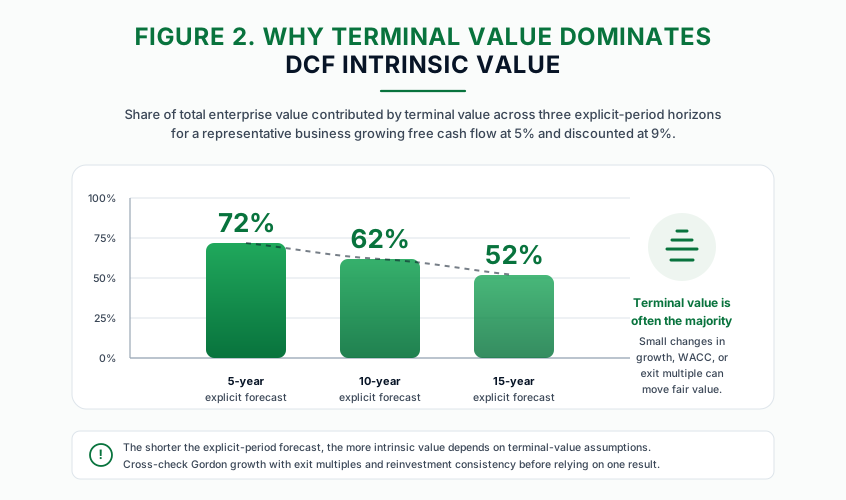
Terminal value typically accounts for 50 to 70 percent of total enterprise value in a finite-period DCF. A model that is rigorous through the explicit forecast period and lazy at terminal value is a lazy model overall.
Two terminal-value methods dominate practice: the Gordon growth (perpetuity) approach and the exit-multiple approach. They imply different things and deserve to be cross-checked against each other rather than picked one and called done.
Figure 2. Why terminal value dominates DCF intrinsic value
Share of total enterprise value contributed by the terminal value across three explicit-period horizons, for a representative business growing free cash flow at 5 percent and discounted at 9 percent.
- Gordon growth assumption. Terminal value equals terminal-year free cash flow times (1 + g) divided by (r − g). The terminal growth rate g almost never exceeds long-run nominal GDP growth, practically 2 to 3 percent for developed-market equities. A terminal growth assumption of 4 percent or higher implies the business continues to gain real economic share in perpetuity. Few businesses are entitled to that assumption.
- Exit multiple sanity check. Re-derive an implied exit multiple from the Gordon growth output: terminal value times (r − g), divided by terminal-year EBITDA or earnings, gives the multiple the Gordon framework is implicitly applying. If the implied exit multiple is 25× EBITDA but the company has traded historically at 12× to 15× and current industry peers trade at 13×, the Gordon assumption is rich.
- Fade discipline. The terminal year should reflect a steady-state business, not the company at the end of an explicit growth period that has not yet faded. If the explicit forecast has Amazon (AMZN) growing AWS revenue at 18 percent through year 10, the terminal cash flow base is sitting at an above-trend run-rate. Either extend the explicit period through the fade or normalize the terminal cash flow downward before applying perpetuity math.
- Reinvestment consistency. Gordon growth quietly assumes the business reinvests enough to support g in perpetuity. A terminal growth rate of 3 percent paired with a terminal reinvestment rate of zero is internally inconsistent. The reinvestment rate in steady state should equal g divided by the return on incremental capital; if the implied reinvestment is implausibly low, the terminal free cash flow is artificially high.
Share count and capital structure
The DCF math typically produces an enterprise value, which becomes equity value after netting debt, and per-share value after dividing by share count. Errors at this step are not subtle; they directly distort the per-share output by 10 to 20 percent in many cases.
- Diluted share count, not basic. Use diluted shares outstanding from the most recent 10-Q filed on SEC EDGAR, including the treasury-stock-method dilution from options and RSUs already issued. Basic share count understates the equity claim being valued.
- Stock-based compensation dilution. Companies that grant SBC at a meaningful percentage of revenue (common in software and biotechnology) issue new equity each year that dilutes existing holders. A DCF that neither projects share growth nor subtracts SBC as a real cash cost overstates per-share value. For Meta Platforms (META), Snowflake (SNOW), or any SBC-heavy issuer, the analyst's choice is to treat SBC as a cash expense (subtracted from operating income before discounting) or to grow share count year over year. Pretending neither happens overstates per-share intrinsic value.
- Buyback timing. Most published DCFs assume share count stays flat. If the company has a multi-year buyback authorization that mechanically reduces share count, the per-share value at the terminal year will be higher than the static-share model suggests. Conservative practice is to model share count flat and treat buybacks as upside.
- Capital structure, net debt. Use net debt as of the most recent balance sheet date, not a stale figure. Include short-term debt, long-term debt, capital lease obligations, pension underfunding (the part disclosed in 10-K footnotes that does not appear on the face of the balance sheet), and preferred stock when present.
- Operating leases. Under ASC 842, operating lease obligations now appear on the balance sheet as right-of-use assets and lease liabilities (the PCAOB's auditor consistency standard covers how auditors evaluate the consistency impact of new-standard adoptions like ASC 842). Older DCF templates that subtract only "debt" miss the lease liability and overstate equity value. For asset-light retailers, restaurant chains, and consumer-facing services, the lease liability can rival traditional debt in scale.
- Off-balance-sheet items. Litigation reserves, pension underfunding, environmental remediation obligations, deferred-tax positions, and minority-interest claims all sit between enterprise value and the common-equity holder. Skipping them means the DCF is valuing a different security than the one being purchased.
How to apply this checklist on any DCF model
The audit overlay works the same way whether the model under review is a self-built spreadsheet, a sell-side analyst's published model, or a third-party platform's automated valuation.
For a self-built model, the checklist is a discipline mechanism: before publishing an intrinsic-value figure to anyone (a research note, a portfolio committee, an investment journal), run each input against its verification questions. The check takes 15 to 20 minutes and surfaces the inputs that need a defended source.
For a sell-side or third-party model, the checklist is a trust-extension mechanism. A DCF output of $182 per share is a number; the same output annotated with the revenue path, the steady-state margin, the WACC components, and the terminal growth assumption is a defensible position. If a published DCF does not expose its inputs to verification, the appropriate response is not to argue with the output; it is to set it aside until the inputs are visible.
For platform-generated DCFs the same audit principle applies. The InvestViable Valuator surfaces the core model inputs (cash flow growth path, discount rate, and terminal growth rate) the user can override to reconcile the platform's intrinsic value with their own assumptions. An intrinsic-value estimate that hides its inputs is not auditable, and an un-auditable valuation cannot anchor a capital-allocation decision.
The output of running the DCF inputs checklist is rarely a different intrinsic-value number. It is a documented set of input choices with a defensible source for each, and a range of intrinsic values across plausible alternative inputs. The intrinsic value range, paired with a margin of safety discipline calibrated to the forecast reliability the audit revealed, is what feeds the maximum-acceptable-price decision. A point-estimate intrinsic value with un-audited inputs is the artifact of a model. A range of intrinsic values with audited inputs and an explicit margin of safety is the artifact of a discipline.
The full DCF construction methodology (explicit-period free cash flow, discounting mechanics, terminal-value selection, and the integration of relative-multiples cross-checks) is covered in the DCF guide. This checklist is the audit overlay that sits on top of any DCF the analyst builds or inherits.