Introduction
Share valuation determines the fair intrinsic value of a company's stock based on its economic fundamentals rather than its current market price. Many investors believe a specific formula can output a precise "correct" price for a stock. However, valuation estimates a probable range of value rather than exact future prices.
Investors face a challenging environment where certainty is scarce. For instance, the 10-year US Treasury yield eased to 4.14% on February 11, 2026, serving as a baseline for risk-free rates. Market participants looking for stability in their portfolio calculations feel anxious due to this volatility. You risk making poor buy or sell decisions based on false precision if you rely on rigid price targets during such times. This article guides you through the workflows and frameworks needed to build a realistic valuation range that accounts for this uncertainty.
Disclaimer: This article is for educational purposes only and does not constitute investment advice. It explains valuation approaches but does not recommend specific securities.
Distinction Between Market Price and Intrinsic Value
You must first distinguish between price and value to calculate a range. The stock market quotes a specific price for every listed company at any given second. This market price represents the amount you must pay to acquire a share, but it rarely reflects the actual value you receive. These two concepts differ clearly. Market price is objective and readily available, while intrinsic value is subjective and requires a detailed estimation of future business performance.
You must calculate intrinsic value using specific data points regarding a company's ability to generate cash. Warren Buffett defines intrinsic value as an estimate requiring the evaluation of future cash flows, growth assumptions, and discount rates. This definition implies that intrinsic value is not a fixed number found on a ticker tape but a figure derived from fundamental analysis. Different analysts often arrive at different conclusions because this process involves estimating the future.
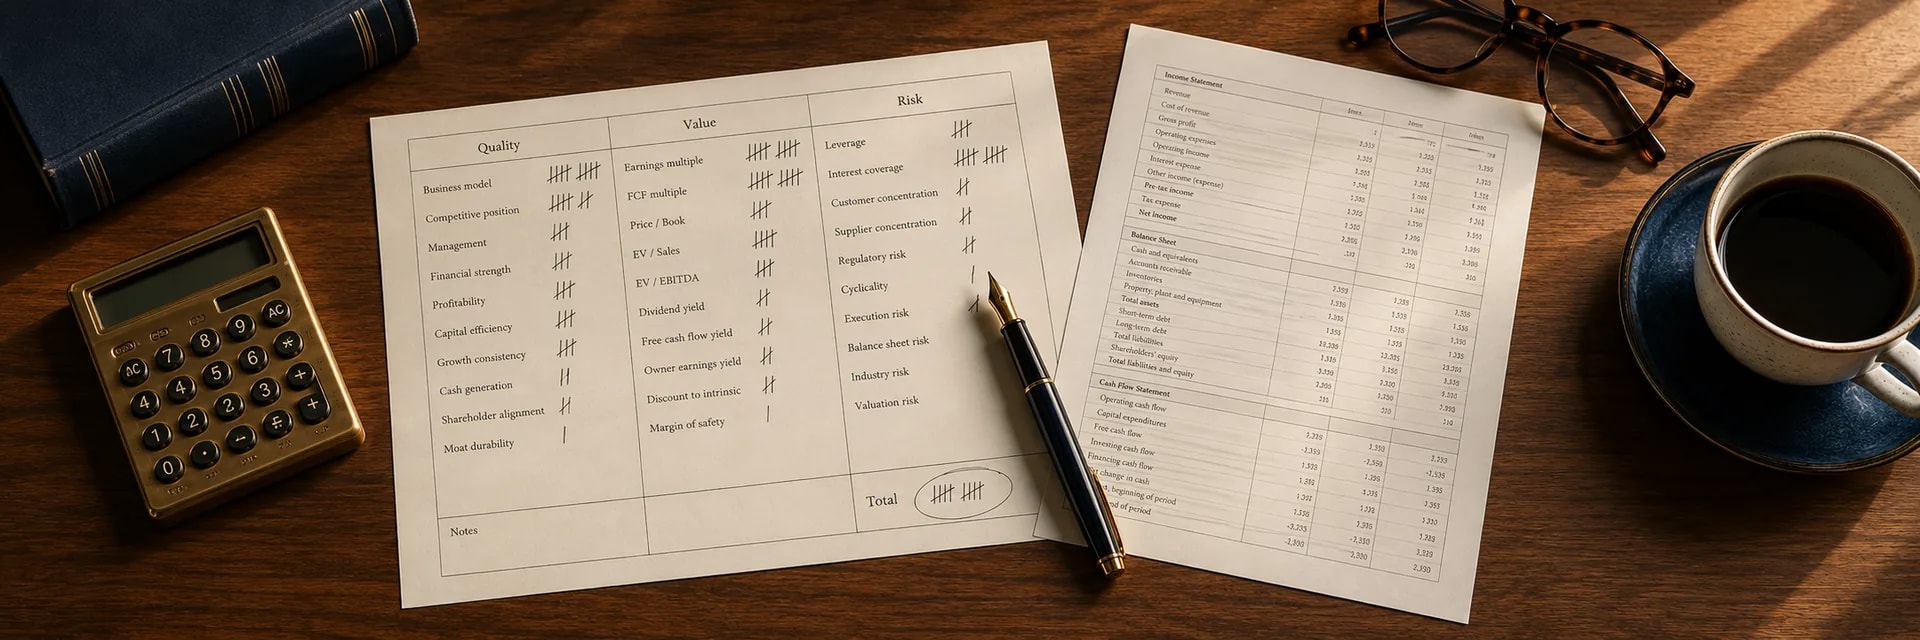
Two experienced investors will likely reach different value conclusions even when they analyze identical data for the same company. The McCracken Alliance notes that intrinsic value is subjective because every investor applies different risk tolerances and growth expectations to their models. You use a business valuation approach to narrow this subjectivity into a usable range. This fundamental work helps you determine if the market price offers a margin of safety or demands a premium you shouldn't pay.
Bridge from Enterprise Value to Equity Value
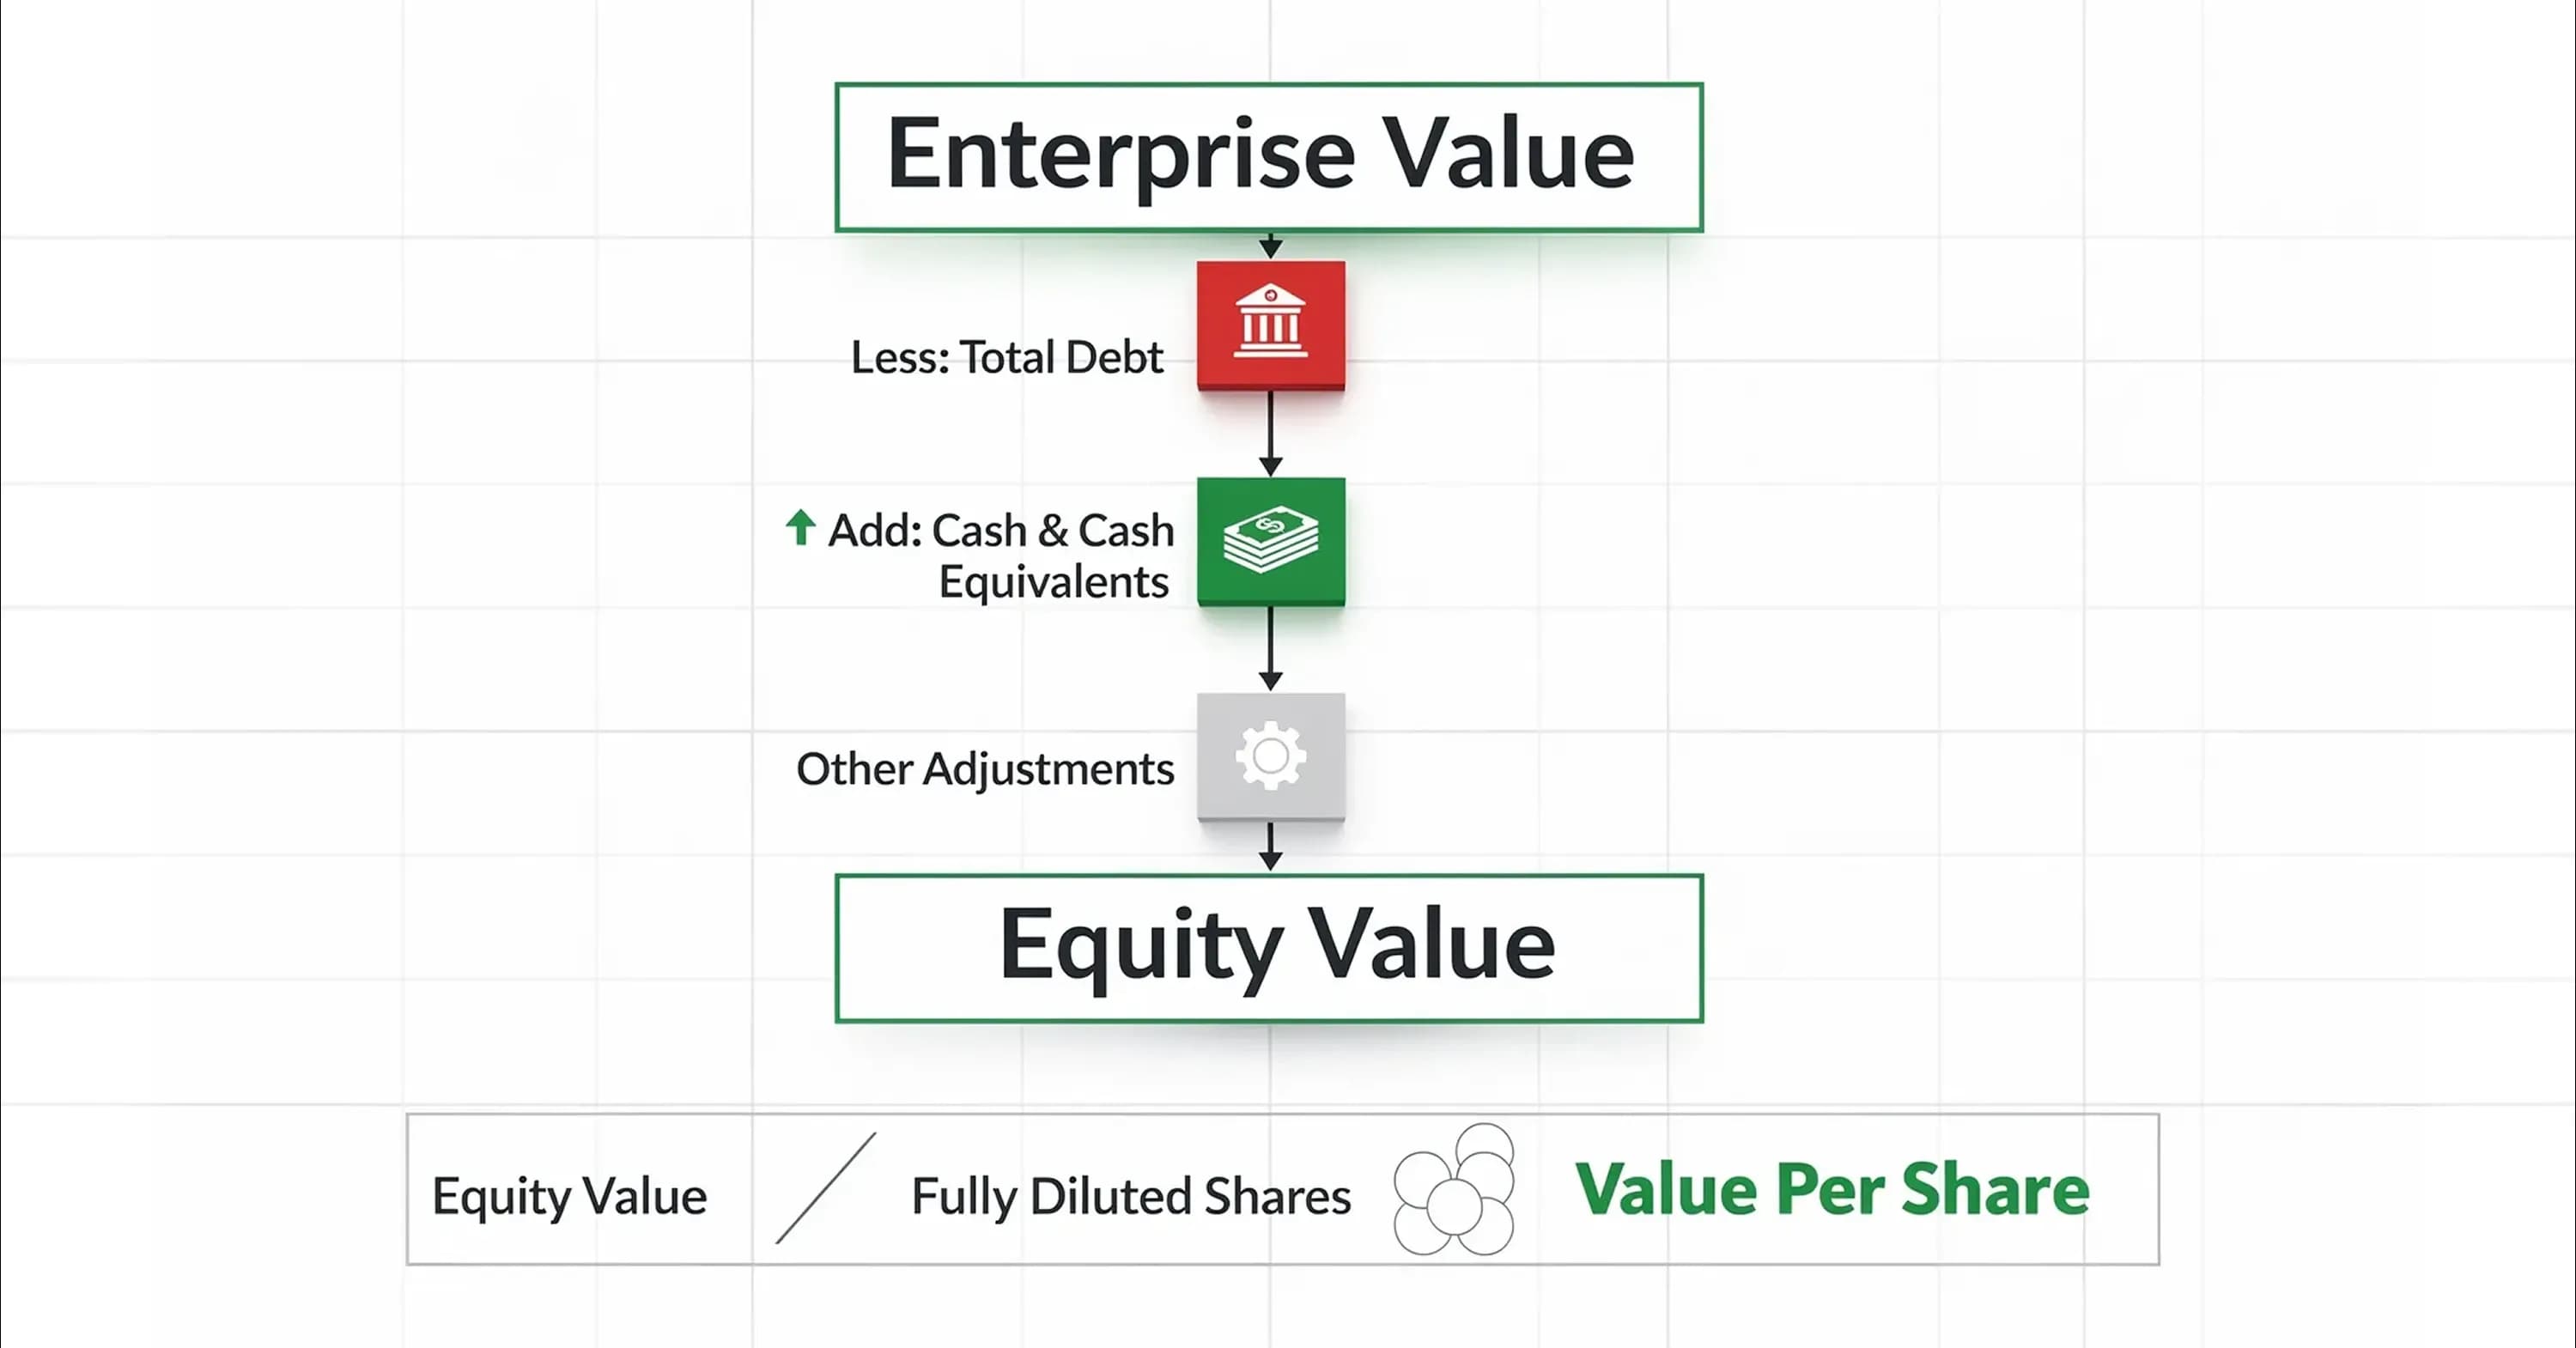
Understanding value leads to defining what shareholders actually own. Investors often confuse the value of the entire company with the value of the equity available to shareholders. You must understand how capital structure affects the price of a single share. The calculation starts with Enterprise Value, representing the total value of the firm's core business operations regardless of financing. You must bridge the gap between Enterprise Value and Equity Value using a "waterfall" method to find the value that belongs specifically to shareholders.
You subtract the company's debt from the Enterprise Value because debt holders have the first claim on assets. An acquirer would pay off the debt before distributing any remaining funds to shareholders if a company were sold today. Conversely, you add cash and cash equivalents back to the value because these assets belong to the new owners and lower the effective cost of the purchase. This subtraction and addition results in the Equity Value.
The final step requires dividing this Equity Value by the number of shares outstanding. This seems simple, but you must use the fully diluted share count rather than the basic share count. Dilution accounts for stock options, warrants, and convertible securities that could turn into shares and reduce the value of your holdings. A proper share valuation always accounts for this potential dilution to ensure you don't overpay. This bridge from total firm value to per-share value protects you from ignoring the company's liabilities.
Valuation Framework Selection
You can select a framework once you define the equity value. You must choose a valuation method that fits the company you analyze rather than applying one method to every situation. Company maturity, stability, and industry determine a framework's appropriateness. Many investors mistakenly believe that complex models with dozens of variables yield better results. However, simpler models often outperform complex ones because your understanding of the model decreases as the input complexity increases.
Aswath Damodaran confirms that simpler valuation models perform better since they reduce the number of assumptions you must make. Every additional variable you add to a model introduces a new point of potential failure. You should rely on logic to select your tool. For example, a stable consumer staples company suits a Discounted Cash Flow model, while a young software company might require a relative pricing approach.
Investors also need to accept that share valuation is not a science of precision. Uncertainty varies by company and industry type, meaning you can't judge a valuation solely by how precise the final number looks. A business valuation approach that acknowledges this uncertainty allows you to build a range of probable outcomes. This prevents you from forcing a volatile tech stock into a rigid model designed for a utility company.
Discounted Cash Flow (DCF) Application
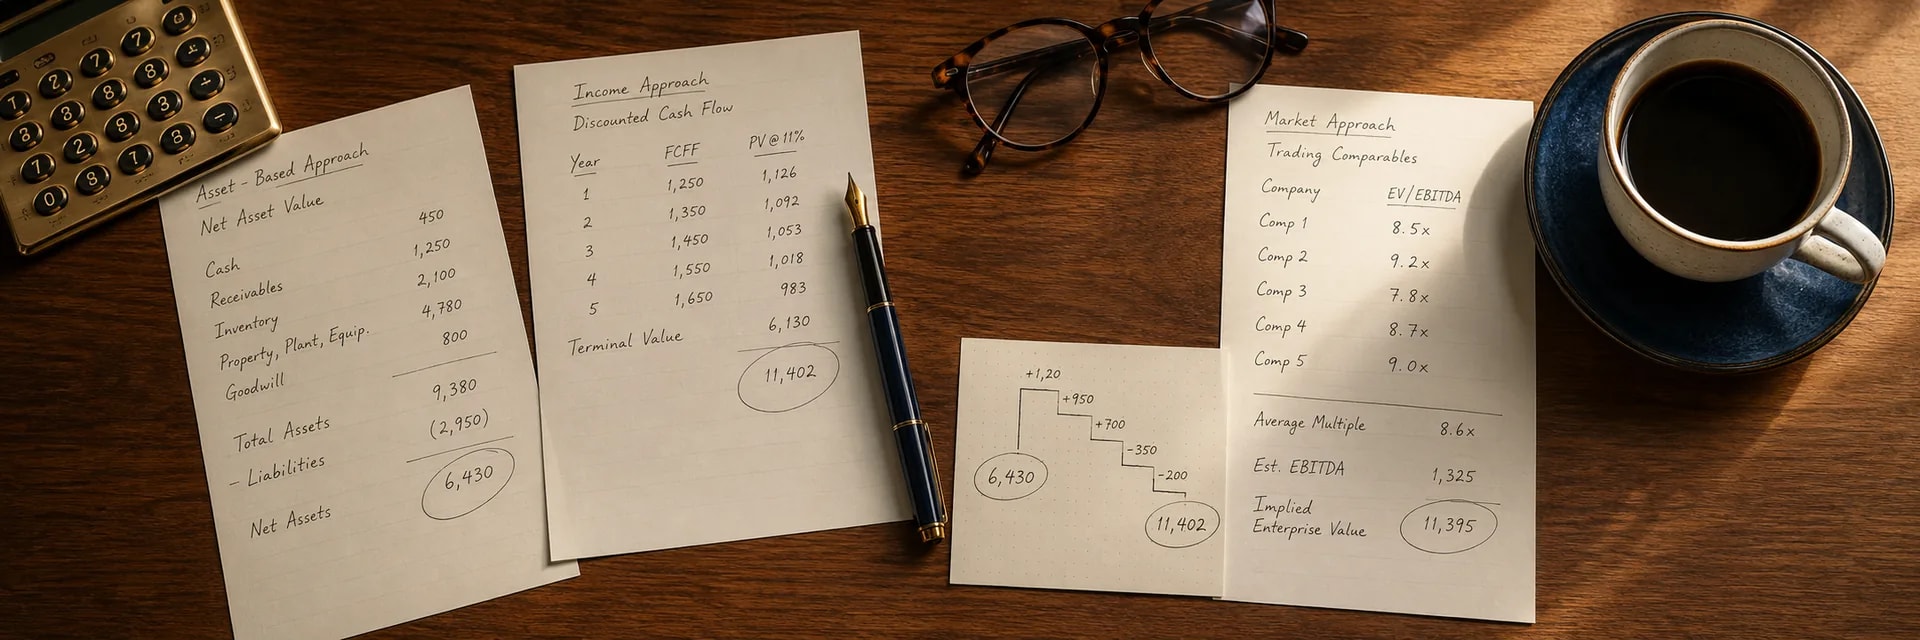
The Discounted Cash Flow (DCF) analysis works best for companies that possess stable business models and predictable cash flows. You use this framework to estimate the value of an investment based on its expected future cash flows. The model operates on the principle that the value of a company today equals the sum of the cash it will generate in the future, discounted back to the present value.
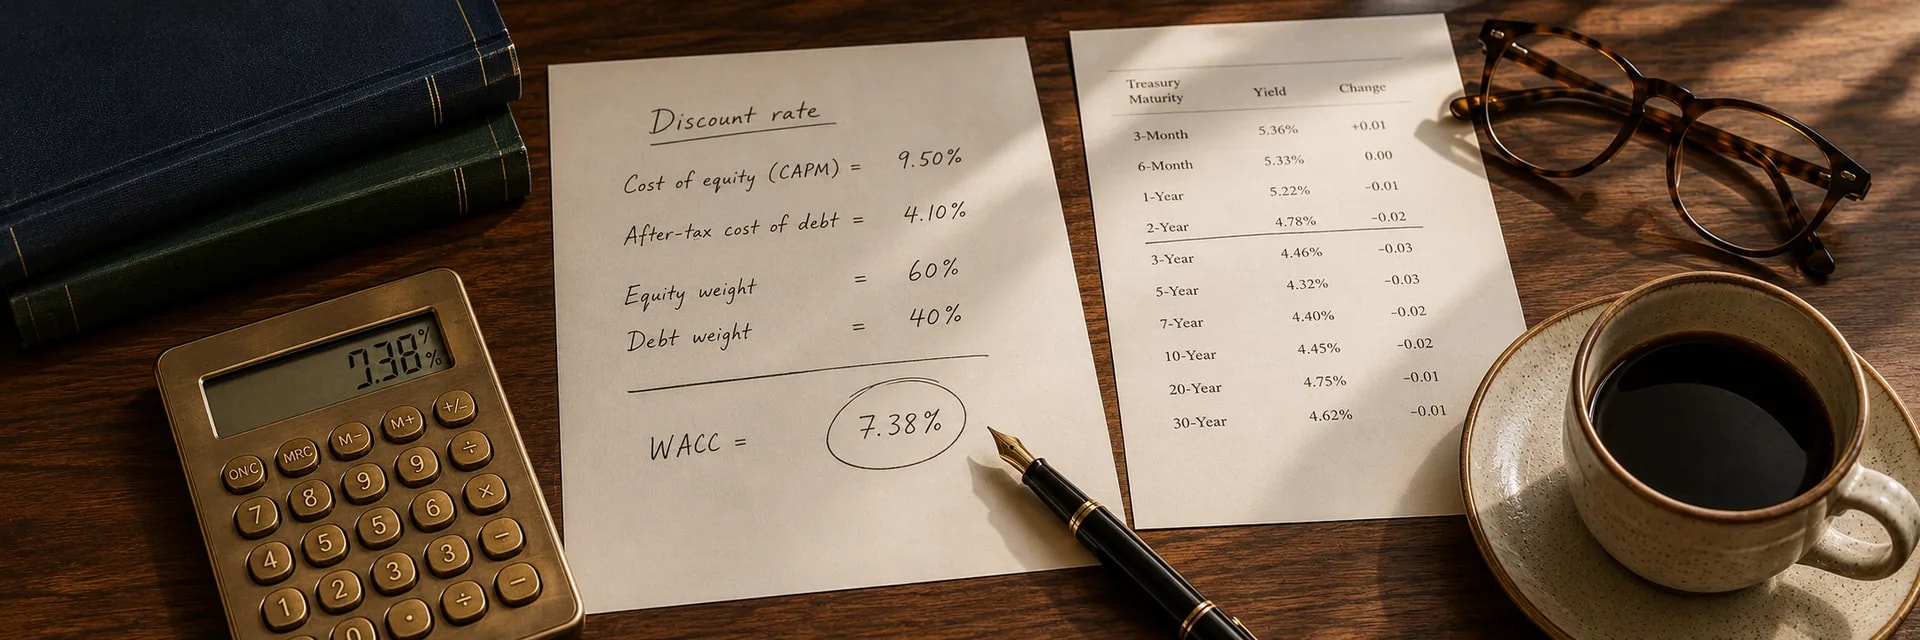
You need three primary inputs to perform a DCF analysis. These include estimated future cash flows, a terminal value, and a discount rate. The discount rate is often the Weighted Average Cost of Capital (WACC), and it accounts for the time value of money and the risk associated with the investment. This method forces you to think about the long-term drivers of the business. However, the DCF output will likely be unreliable if a company has erratic earnings or is in a distress situation.
Relative Valuation and Multiples
Some situations require looking outward rather than inward. Relative valuation determines the value of an asset by comparing it to the pricing of similar assets. You use this method when you need to understand how the market currently prices a specific sector or industry. Relative valuation looks outward at what investors pay for peers, unlike the DCF which looks inward at the company's cash.
Common metrics for this framework include the Price-to-Earnings (P/E) ratio and the Enterprise Value-to-EBITDA (EV/EBITDA) ratio. You calculate these multiples for a target company and compare them against an industry average or a specific set of competitors. This helps you identify if a stock trades at a discount or a premium relative to its peers. This method is faster than a DCF, but it assumes that the market is correctly pricing the peer group. Therefore, you should use relative valuation to complement intrinsic value analysis rather than replace it.
Valuation Range Workflow
A structured workflow organizes these methods into a cohesive output. You need a consistent process to convert raw financial data into a usable valuation range. A systematic approach prevents emotional bias from influencing your numbers and ensures you compare companies on an equal footing. You should follow this specific four-step procedure to build your valuation model.
-
Gather TTM financials: Trailing Twelve Month (TTM) data captures the most recent four quarters of performance and differs from the annual report. It provides a current picture of the company's health.
-
Normalize earnings: Adjust the operating income to remove one-time events like legal settlements or asset sales. These non-recurring items distort the company's true earnings power.
-
Select conservative growth rates: Choose growth assumptions that reflect historical averages rather than optimistic future projections. Small changes in growth rates drastically alter the final output.
-
Apply sensitivity analysis: Build three distinct scenarios, such as Bear, Base, and Bull, by varying your inputs for revenue growth and profit margins. This allows you to see how the valuation changes under different economic conditions.
This workflow culminates in a range of values rather than a single price. You must understand that the quality of the output depends entirely on the quality of these inputs if you use a share valuation calculator. Warren Buffett emphasizes that valuation inputs like growth rates and discount rates require reasonable margins of error for sound investment decisions. You ignore the reality that the future is unpredictable if you narrow your focus to a single point estimate.
Data Integrity and Calculator Usage
This workflow relies heavily on the accuracy of your information. Models only function as well as the data you feed into them. Even the best share valuation calculator will output a misleading result if you input incorrect data. This problem is often called "Garbage In, Garbage Out." You must prioritize data integrity by manually checking critical inputs. For example, many investors fail to use the fully diluted share count. This count includes stock options and warrants. You will artificially inflate the value of each share if you overlook dilution. You also need to verify currency conversions for foreign stocks and check that the risk-free rate matches the duration of your cash flow projections.
Verification protects you from investing in companies that look cheap but actually suffer from deteriorating fundamentals. Consider the case of BigBear.ai (BBAI). BigBear.ai revenues declined 20% year-over-year to $33.1 million in Q3 2025. This decline triggered a stock collapse.
An automated model might have missed that gross margin compressed to 22.4% while adjusted EBITDA turned negative at a $9.4 million loss. BBAI still trades at 12.29x forward P/S despite these poor results. This is well above its 3-year median. A thorough stock market valuation would catch these red flags, whereas a blind reliance on a calculator might miss the context.
Conflict Reconciliation and Margin of Safety
Accurate data may still yield conflicting results across different models. Different valuation models often tell different stories about the same stock. A DCF analysis might suggest a stock is undervalued, while a relative P/E valuation might signal it is expensive. You shouldn't view this conflict as a failure but as a prompt for deeper synthesis. The market might expect future growth to slow down significantly if the DCF is high but the P/E is low. You must investigate why the discrepancy exists rather than simply averaging the two numbers.
You need a buffer to protect against errors in your assumptions because valuation involves estimation. This buffer is called the Margin of Safety. It is the gap between intrinsic value and market price. This gap protects you against valuation errors and bad luck. You might only buy the stock at $70 if you calculate a fair value of $100 to ensure you have a 30% safety margin.
This approach helps you avoid value traps. Value traps appear undervalued on traditional metrics but actually mask deteriorating fundamentals or industry headwinds. You account for the fact that valuation is least precise when the payoff is greatest by demanding a margin of safety and using a valuation range.
Conclusion
Calculating a realistic share valuation requires you to accept uncertainty and focus on probability rather than precision. You can build a defensive valuation range that protects your capital by understanding the difference between price and value, selecting the appropriate framework, and verifying your data inputs. Investors who rely on a single number often miss the risks hidden in the assumptions. Those who use a range can make decisions with a proper margin of safety.
The goal of valuation is not to predict the future perfectly but to assess whether the current price offers a favorable scenario for long-term returns. Run a comprehensive valuation report on the InvestViable platform today if you're ready to see where your portfolio holdings fall within their fair value range.