Introduction
Stock market valuation often confuses investors because it rarely offers a clear signal for immediate action. Markets frequently hit record highs in 2026 while artificial intelligence drives massive capital expenditures, yet traditional metrics suggest that prices detached from historical norms. This contradiction leaves many participants unsure whether to chase momentum or retreat to cash. However, valuation doesn't function as a precise price tag that tells you exactly what a company is worth today. Instead, it measures investor sentiment relative to the business's economic reality.
Valuation multiples fluctuated wildly in the past based on interest rates, inflation, and technological shifts. Investors often make costly errors when they treat these metrics as binary "buy" or "sell" signals. A high price-to-earnings ratio might signal overvaluation, or it might reflect a structural shift in how companies generate cash flow. Therefore, understanding the context behind the numbers matters as much as the numbers themselves. You risk misjudging the market's long-term potential if you don't learn to interpret these signals within a broader framework.
This article moves beyond simple single-metric analysis to teach a professional approach to assessing stock worth. We guide you through triangulating different data points, such as earnings yields, risk premiums, and intangible asset adjustments, to find the truth within the market noise. To find this truth, one must first understand what valuation actually represents.
Disclaimer: This content is educational only, and not investment advice. It provides a framework to interpret valuations, not to time markets.
Valuation as a Probability Gauge
Investors often mistake a high valuation for a warning bell signaling an immediate market crash. Valuation metrics act more like a compass for long-term probability than a stopwatch for short-term timing. Prices rising significantly faster than earnings usually reduce the expected rate of return over the coming decade rather than cause a sudden correction. You gain a clearer perspective on your portfolio’s potential if you view these metrics as a gauge for future yield rather than a timing tool.
History supports the link between starting prices and long-term outcomes. Returns compress because a higher starting price reduces the dividend yield and limits multiple expansion. Currently, Vanguard anticipates annualized returns of 3.9% to 5.9% for U.S. equities over the next ten years, a figure that sits well below historical averages.
This data encourages a calculated approach to risk management. Momentum or sentiment may drive prices in the short term, but the mathematical gravity of stock market valuation eventually asserts itself. For instance, Goldman Sachs projects global equity prices to climb 9% over the next 12 months, but it notes that longer-term returns rely heavily on fundamental profit growth rather than rising valuations. Investors who understand stock valuation methods recognize that paying a premium today essentially borrows returns from the future. You can better accept that periods of high valuation likely precede periods of modest growth if you extend your time horizon beyond the immediate cycle.
The Art of Triangulation
Accepting modest growth is difficult when using limited tools. Assessing the market with a single number often leads to blind spots. A price-to-earnings (P/E) ratio might look expensive in isolation but appear reasonable when compared to interest rates or inflation. Professional investors use a robust framework known as triangulation to avoid these traps. This process cross-references multiple metrics to create a system of checks and balances that reveals the true cost of capital.
Systematically comparing equity yields against risk-free rates offers a clearer picture of value than looking at share prices alone. You can calculate the Earnings Yield by dividing a company's earnings per share by its stock price. This metric compares the return you effectively get from owning stocks against the yield of safe government bonds. For example, recent data shows the 10-year U.S. Treasury yield at approximately 4.24%, while the S&P 500 earnings yield sits near 3.6%. This tight spread suggests that investors receive little extra compensation for taking on the risks of the stock market.
This discrepancy highlights why equity valuation analysis requires looking at data from more than one dimension. You might miss that the risk premium, the extra return demanded for holding stocks, compressed if you only looked at earnings growth. The Shiller Excess CAPE Yield currently sits at 1.45%, well below its long-term average of 2.78%, which confirms that the reward for risk remains historically low. Charlie Munger advocated for this type of multidisciplinary approach because drawing models from different disciplines prevents you from clinging to a single, potentially flawed indicator. You can construct a more durable view of market reality by checking key financial ratios against one another.
Structural Shifts and Intangibles
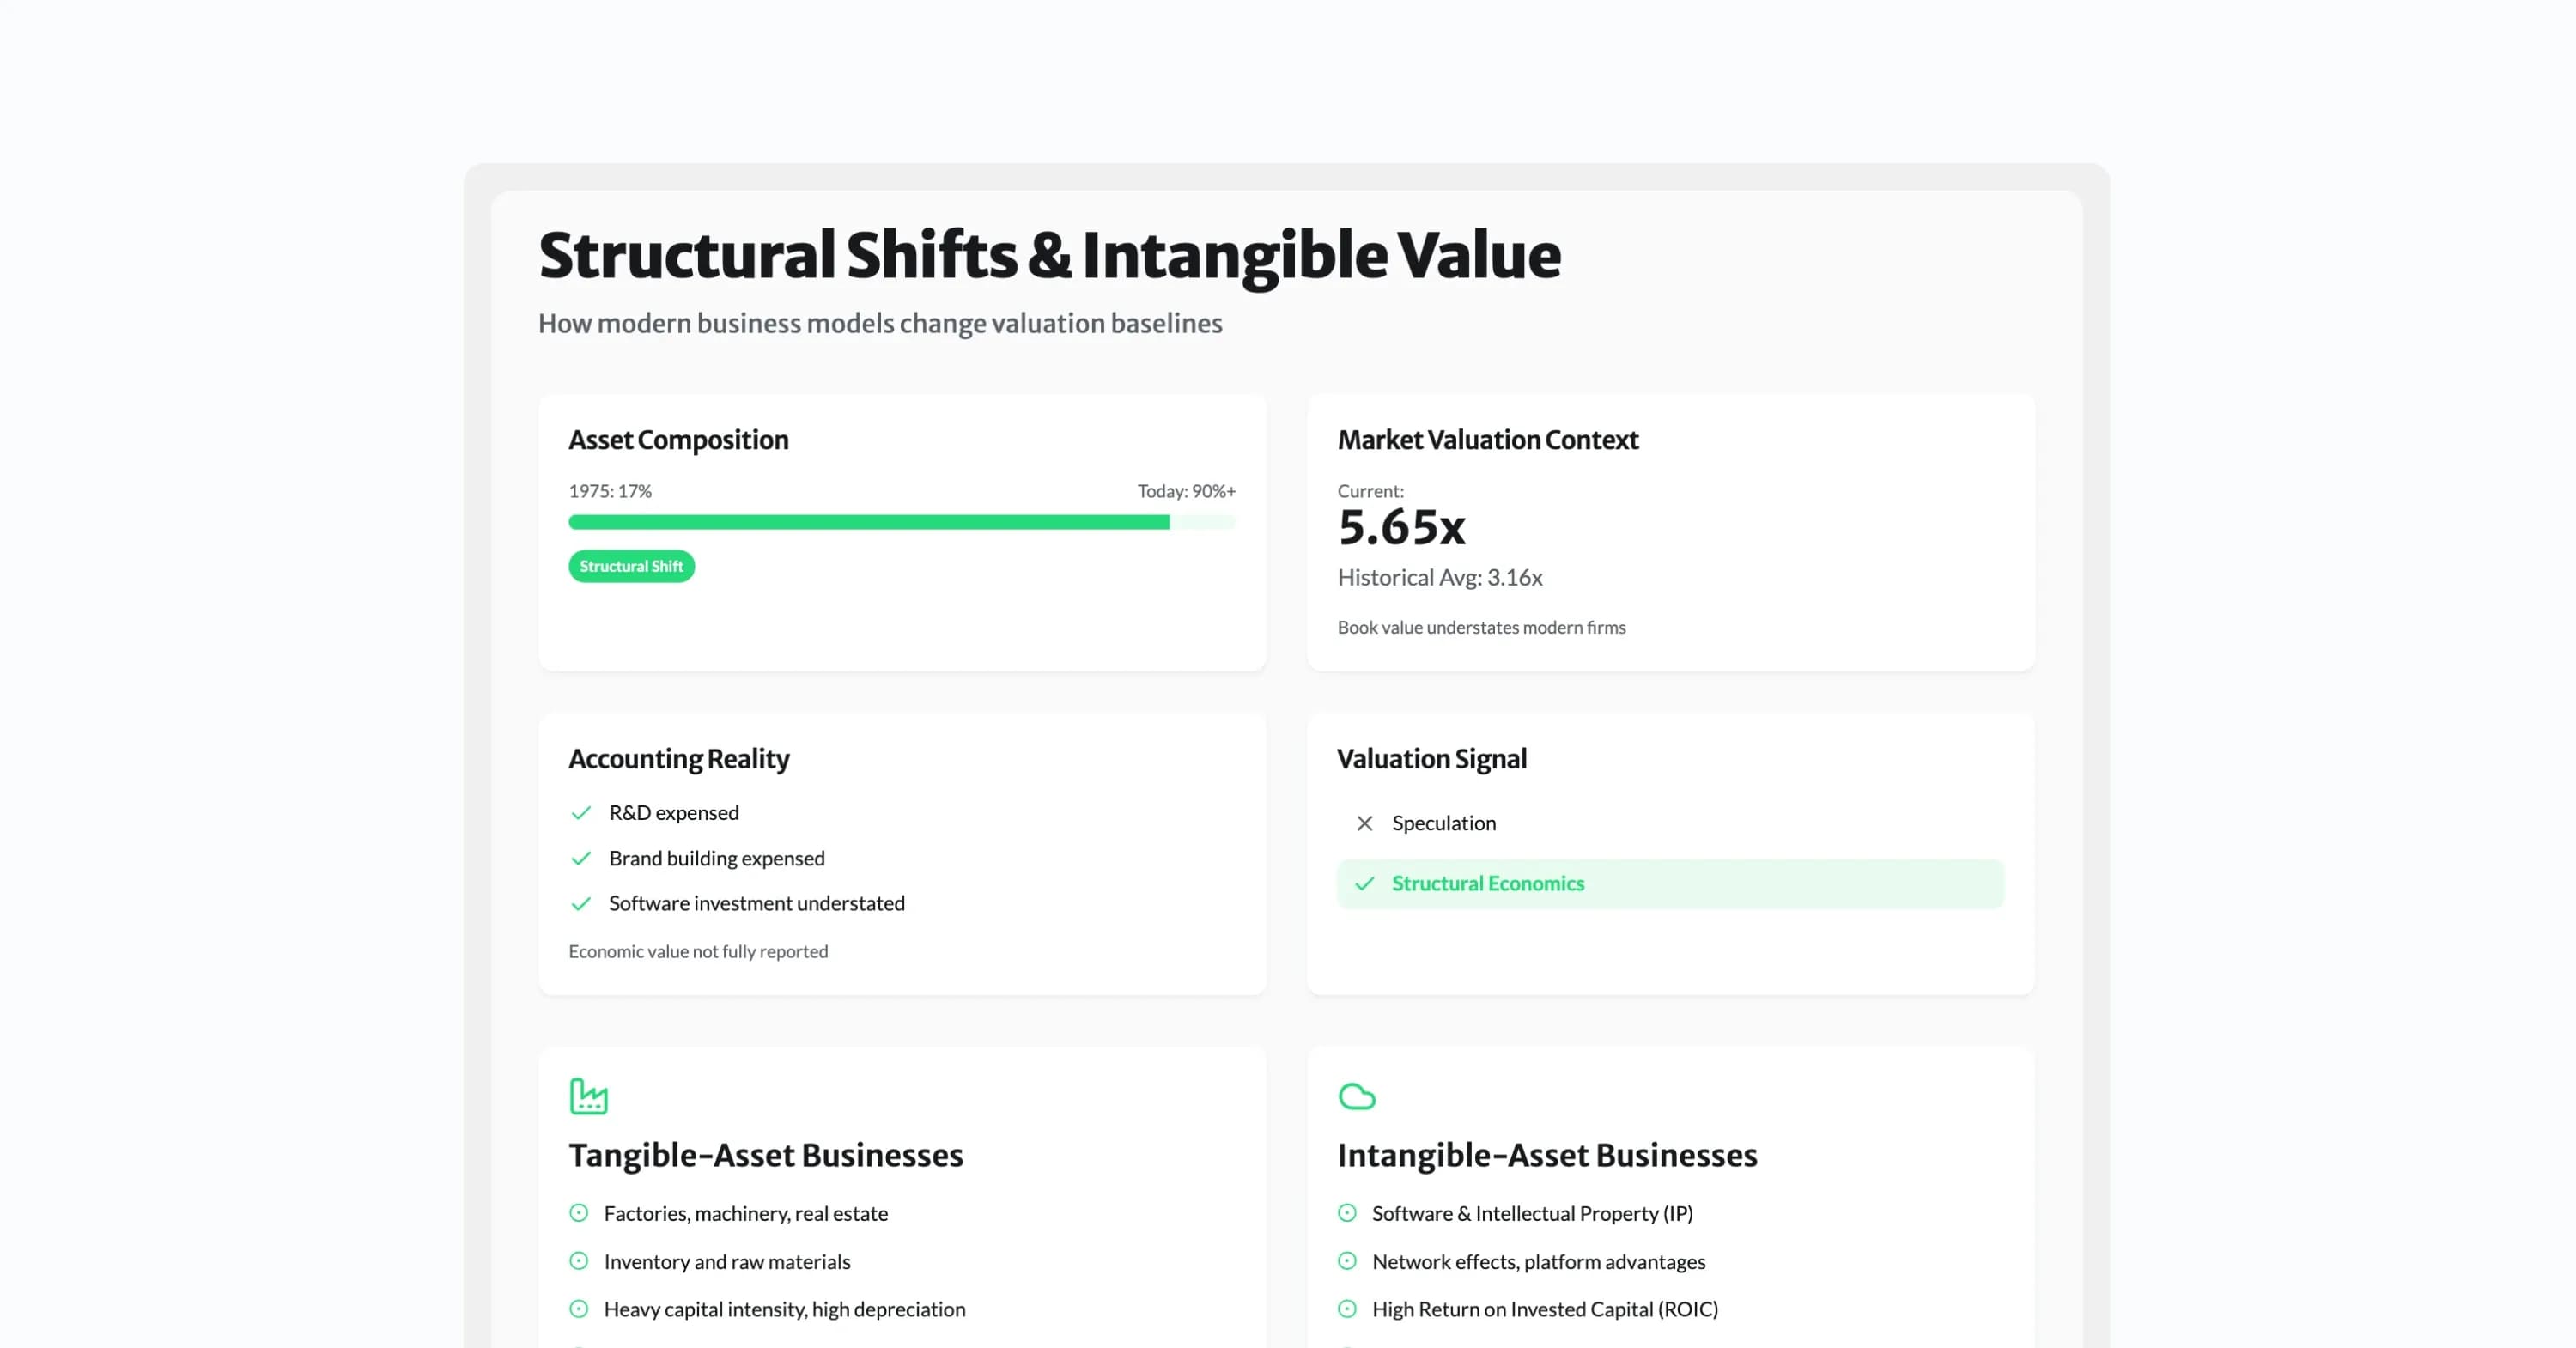
A durable view requires adjusting for how the market has evolved. Comparing modern market valuations to historical averages requires context regarding the economy's changes. Fifty years ago, the largest companies in the S&P 500 were industrial giants that required massive investments in factories, inventory, and machinery to grow. Technology companies that scale through software, intellectual property, and network effects dominate the index today. This evolution from tangible to intangible assets alters the baseline for what constitutes a "normal" valuation multiple.
The data illustrates this shift in corporate value composition. In 1975, intangible assets comprised just 17% of the S&P 500; today, intangibles exceed 90% of total assets. Reported book values often understate the true economic value of modern firms because accounting rules often force companies to expense investments in R&D and brand building immediately rather than capitalizing them. Consequently, the S&P 500 price-to-book ratio stands at 5.65, significantly higher than the historical mean of 3.16.
This distinct economic structure implies that traditional mean reversion might not happen as expected. Companies with significant intangible assets often benefit from economies of scale that allow them to generate high returns on invested capital with minimal incremental cost. Therefore, a higher stock market valuation today might reflect these superior unit economics rather than pure speculation. However, you must look at the underlying business quality to confirm this. While tech giants like Microsoft now allocate 25% of revenue to capital expenditures to build AI infrastructure, this spending supports assets that do not appear on the balance sheet in the same way a factory would. Understanding this education on intrinsic value helps investors distinguish between a structurally expensive market and one that has simply modernized.
The CAPE Ratio and Long-Term Signals
Once you understand the modern context, you can apply tools designed for the long game. Short-term market movements often distract investors from the signals that actually matter for wealth accumulation. Robert Shiller developed the Cyclically Adjusted Price-to-Earnings (CAPE) ratio to solve this problem. He smoothed out the volatility of profit cycles. This metric divides the S&P 500 price by the inflation-adjusted average of ten years of earnings. This smoothing effect filters out temporary spikes or drops in corporate profits and makes the CAPE ratio a vital part of any stock valuation calculation.
Empirical evidence suggests that starting valuations dictate future returns. Research Affiliates found that the CAPE ratio has a negative correlation of approximately 80% with subsequent 10-year stock market returns. This means that as the ratio goes up, expected returns go down. Currently, the Shiller PE Ratio sits significantly higher than its historical mean of roughly 17, which implies that investors should temper their expectations for the coming decade.
Critics often dismiss CAPE because it fails to time market tops. However, it forecasts long-term yield rather than immediate price action. An analysis of 56 economies confirms this link, showing that cheap markets delivered approximately 10% annual returns over 25 years, while expensive markets generated roughly 4%. Investors who respect this historical data understand that paying a high price today logically reduces the compounding rate of their capital tomorrow. This realization shifts the focus from predicting prices to managing expectations.
Constructing the Probabilistic Mindset
The most sophisticated models fail if the investor demands certainty where none exists. Successful investing requires you to accept uncertainty rather than fight it. Warren Buffett and Howard Marks both emphasize that macro factors like interest rates and market movements are unknowable and unpredictable. Consequently, view your portfolio not as a prediction of what will happen, but as a position prepared for a range of things that could happen.
Charlie Munger described the stock market as a pari-mutuel system where the odds change based on how other people bet. The goal in this system isn't to bet on every race but to identify the rare moments when the odds are heavily in your favor. Proper equity valuation analysis identifies these favorable moments. When valuations are high, the odds of high returns decrease, and the risk of loss increases. This discipline protects you from the common error of chasing performance just because prices are rising.
Adopting this mindset helps you maintain emotional stability during volatile periods. Howard Marks famously noted that the market can remain irrational longer than you can remain solvent. You won't bet the farm on a crash if you recognize that expensive markets can get more expensive before they correct. Instead, build portfolio resilience by holding adequate cash reserves or diversifying into undervalued assets. This ensures you can survive the irrational periods to benefit from the rational ones.
Practical Application Framework
Theory offers little value until you translate it into a consistent routine. You need a rigorous process to apply these concepts to your daily investment decisions. This process prevents emotional bias from overriding your logic. You can force yourself to look at the data objectively before you commit capital to any position by following a specific set of steps.
First, you must normalize the data you use in your stock valuation calculation. Strip out one-time charges or gains that distort the earnings number. You can use stock screener tools to screen based on standardized P/E ratios derived from fully reported earnings, ensuring transparency and data accuracy. When screening, comparing, and sorting based on P/E ratios, it is important to understand that one-time charges or gains can distort the earnings number. Second, contextualize the valuation against the current economic environment. Check the difference between the earnings yield and the 10-year Treasury yield. If the spread is narrow, you demand a higher quality of business to justify the risk.
Finally, establish a margin of safety. Since valuation is part art and part science, your calculation won't ever be perfect. Buy only when the market price falls significantly below your estimated value. This provides a buffer for errors in judgment or unforeseen economic shifts. Implementing this framework ensures that you don't need to be precisely right to achieve satisfactory returns over the long run.
Conclusion
We explored how a disciplined valuation framework helps you navigate market uncertainty by focusing on probabilities rather than precise predictions. No bell rings at the top or bottom of a market cycle. Investors must rely on a robust system of triangulation to assess their risk exposure. Relying on a single metric like the P/E ratio often leads to dangerous blind spots. Cross-referencing multiple signals allows for more rational positioning. Ultimately, stock market valuation tells you the level of risk you're accepting for a given unit of return, not the exact timing of the result.
The ability to interpret these metrics with nuance will become even more critical as structural shifts in the economy continue to alter the composition of indices. Investors who adopt a probabilistic mindset handle periods of volatility and lower expected returns better. We encourage you to apply this multi-layered framework to your own analysis, accepting the inherent uncertainty of the market while striving for resilience in your portfolio construction. 19:T39a1,{ "@context": "https://schema.o