
Treat the earnings-yield-to-bond-yield spread as a lens on long-horizon expected returns, not as a timing tool. Compare the earnings yield to a real yield, such as the ten-year inflation-indexed Treasury rate, rather than a nominal one. The nominal version answers a different question than the one most analysts think they are asking, and it can flip sign purely on a change in inflation expectations.
What the earnings yield actually measures
The earnings yield is earnings divided by price. On an index it is the aggregate earnings of the constituents divided by the aggregate market value, so a price-to-earnings ratio of 20 is an earnings yield of 5 percent.
One thing it does not measure is cash in hand. A bond coupon arrives in the holder's account. Accounting earnings do not: some are paid as dividends, some fund buybacks, and the rest is reinvested in the business or held. The earnings yield measures the earning power attached to a share at its current price, which is a claim on value rather than a distribution.
A trailing earnings yield uses the last reported twelve months. A forward earnings yield uses an estimate, which imports the optimism embedded in those estimates. A cyclically adjusted earnings yield uses the inverse of the CAPE ratio, whose denominator is a ten-year average of inflation-adjusted earnings. That version exists because a single year of earnings can be a cyclical peak or trough. The methodology guide on how to calculate cyclically-adjusted PE sets out the mechanics of building that ten-year denominator. It also covers the GAAP choice that drives most of the divergence between published readings.
One further limitation deserves stating plainly, because it is usually skipped. An earnings yield equals a long-run expected real return in two clean cases. The first is no real growth, with earnings effectively returned to shareholders. The second is growth funded entirely by reinvestment that earns exactly the cost of capital. Outside those two the direction depends on what reinvestment earns. Reinvestment above the cost of capital makes the earnings yield understate the expected real return, so it acts as a conservative floor. Reinvestment below it destroys value, and the earnings yield overstates what a holder should expect. A cyclical peak or weak accounting in the reported denominator does the same thing. The same denominator-quality problem that afflicts normalizing earnings for cyclical companies applies to an index aggregate.
What a bond yield measures, and why the units differ
A ten-year Treasury yield to maturity is the discount rate that equates the bond's contractual payments to its market price. Those payments are fixed in nominal dollars. If inflation runs hotter than expected over the decade, the coupons still arrive on schedule and buy less, so the lender demands compensation for that risk in advance.
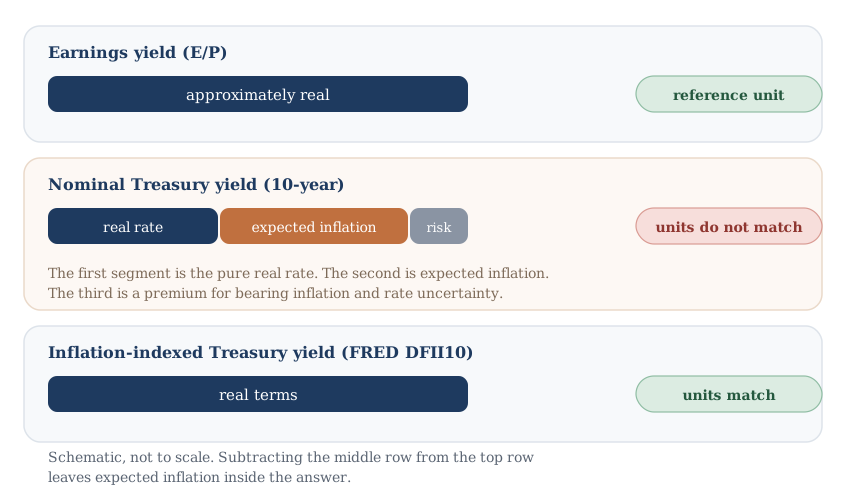
A nominal yield decomposes into a real rate, an expected inflation rate over the holding period, and a premium for bearing inflation and rate uncertainty. Only the expected-inflation component is a pure top-up, there to leave purchasing power roughly where it started. What remains, the real rate plus whatever premium the lender charges, is the real return the lender expects to earn. That expected-inflation slice is what makes the two numbers incommensurable.
Equity earnings behave differently. Over long periods, companies raise prices with the general price level, so nominal revenue and nominal earnings escalate with inflation. Corporate earnings are not a fixed nominal stream. Clifford Asness put the consequence directly in Fight the Fed Model, his 2003 paper in the Journal of Portfolio Management. Asness measured the pass-through: on average 94 percent of decade-long inflation showed up in nominal earnings growth, though that relationship explains only 36.5 percent of the variation. A bond coupon has no such property, so an earnings yield already carries an inflation adjustment inside it.
Firms with weak pricing power absorb input-cost inflation in their margins, and inflation is disruptive to real activity while it is accelerating. The pass-through is imperfect, and equities are not a clean inflation hedge over short windows. Over long horizons, though, the escalation of nominal earnings with the price level is structural, while a bond's coupon schedule is contractual and fixed.
Two quantities measured in different units cannot be subtracted and read as a spread, and that units error survives however sophisticated the surrounding commentary becomes.
Earnings yield vs bond yield: the Fed model and where it breaks
The comparison itself is simple. In its plainest form the model calls equities cheap when the earnings yield exceeds the ten-year Treasury yield. It calls them expensive when the Treasury yield is higher, and fairly valued when the two are equal. Asness records this formulation. He notes the model was allegedly found in a Federal Reserve report, though the name itself was attached by practitioners and never carried any official Fed endorsement.
An investor allocating between two asset classes does compare what each offers, and bonds and equities compete for the same capital. The intuition is respectable, which is why the comparison has proved durable. The relationship it asserts is visible in the data too: investors have historically accepted higher price-to-earnings multiples when nominal interest rates were lower.
The trouble is that the same evidence supports a different explanation. Asness's finding is that the multiple investors accept varies systematically with the perceived risk of equities relative to bonds. Adding perceived risk explains a pattern the naive model cannot. Asness measured it: over 1926 to 1965 earnings yields sat almost uniformly above ten-year Treasury yields, and over 1965 to 2001 they sat generally a bit below. The sign then reversed again. In Damodaran's annual series the earnings yield exceeded the ten-year bond rate in every year from 2002 through 2023, falling below it only in 2024 and 2025. A rule treating equality as fair value has no account of why the sign should hold on one side for two decades and then flip.
History shows the swing plainly. Aswath Damodaran's historical implied equity risk premium dataset publishes the trailing aggregate earnings yield and the ten-year Treasury bond rate side by side each year. In 1974 the earnings yield stood at 13.64 percent against a bond rate of 7.40 percent, a raw spread of positive 6.24 points. In 1999 the earnings yield was 3.07 percent against 6.44 percent, a raw spread of negative 3.37 points. The raw measure traveled 961 basis points between those two years.
Damodaran's implied FCFE premium over the same pair of years moved 354 basis points, from 5.59 percent to 2.05 percent. He does not difference the two yields. He solves for the discount rate that reconciles prices to expected cash flows. That calculation models growth and payout explicitly, so a change in the multiple is attributed partly to expectations rather than entirely to required return. His estimate moved just over a third as far, though the 1974 figure rests on smoothed historical growth rather than the analyst estimates available by 1999.
The mismatch, in arithmetic
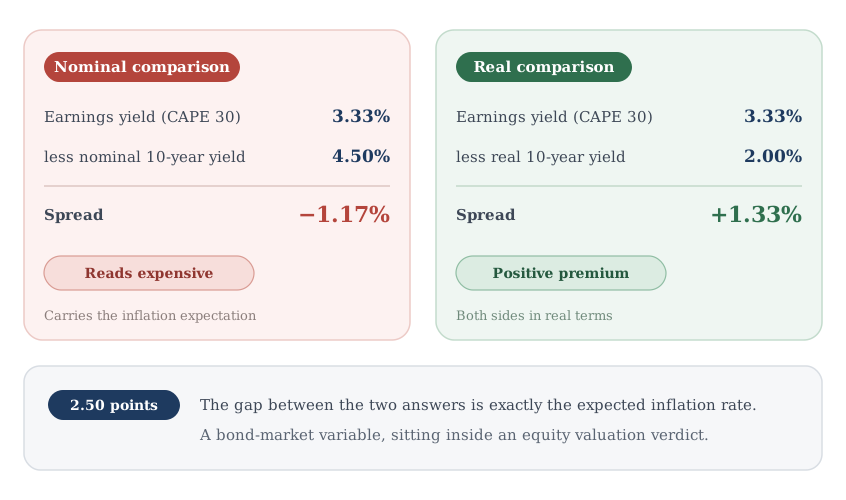
The cleanest way to see the defect is to run one comparison two ways on identical inputs. Take a cyclically adjusted price-to-earnings ratio of 30, which gives a cyclically adjusted earnings yield of 3.33 percent. Set the ten-year nominal Treasury yield at 4.50 percent, and expected inflation over the same ten years at 2.50 percent. The real yield is then approximately 2.00 percent. Subtracting inflation alone leaves the inflation-risk premium inside that residual, so read 2.00 percent as a real rate with a small premium attached.
Run the nominal comparison first. The earnings yield of 3.33 percent less the nominal yield of 4.50 percent gives negative 1.17 percent. The plain form of the rule calls that expensive.
Run the same inputs against the real yield. The earnings yield of 3.33 percent less the real yield of 2.00 percent gives positive 1.33 percent. On these inputs the comparison implies a positive expected real return above Treasuries.
Same market, same earnings, same bond, opposite conclusion. The difference between the two answers is 2.50 percentage points, the expected inflation rate itself under plain subtraction. The entire gap between the two verdicts is a bond-market variable that never belonged in the comparison. Expected inflation sits in the level of the nominal yield, but on the equity side only in the growth of nominal earnings, so differencing does not cancel it.
Figure 1. One comparison, two units, opposite verdicts
Illustrative inputs: CAPE of 30, nominal ten-year yield 4.50 percent, expected inflation 2.50 percent.
Two refinements matter. Subtracting inflation from a nominal rate is only an approximation. The Fisher relation is multiplicative, so the exact real yield is 1.045 divided by 1.025, less one, or 1.95 percent rather than 2.00 percent. The corrected spread becomes 1.38 percent instead of 1.33 percent. The approximation error is 5 basis points, against the 250 basis points the nominal comparison introduces.
The second refinement is the more damaging one. Hold the nominal yield at 4.50 percent and raise expected inflation from 2.50 to 4.00 percent. The Fisher real yield falls to 0.48 percent, and the corrected spread widens by 147 basis points to positive 2.85 percent. The nominal comparison does not move at all, because expected inflation reaches it only through the nominal yield, which is held fixed here. It still reads negative 1.17 percent. A 147 basis point shift in that real residual is invisible to it.
The corrected comparison: earnings yield against a real yield
The repair is mechanical: put both sides in real terms, then subtract.
One direct route uses an observed real yield rather than an estimated one. The Board of Governors publishes a ten-year inflation-indexed Treasury constant-maturity series, distributed through FRED as DFII10. It carries a liquidity premium, so it is a market real yield rather than a pure one. No inflation forecast is required to build it. It is also real in CPI terms, while nominal earnings escalate with the prices a company can charge. The two deflators track each other over long periods without being the same. The indexed yield strips out the inflation risk premium as well as expected inflation. It therefore sits a little below the residual left by subtracting inflation from a nominal yield. Its limitation is history: the series begins in January 2003, so any comparison reaching further back has to construct a real rate from a nominal yield and an inflation estimate.
Robert Shiller, Laurence Black and Farouk Jivraj formalized this correction in 2020 and gave it a name. The excess CAPE yield is the inverse of the cyclically adjusted price-to-earnings ratio minus a real long-term interest rate. It repairs the Fed model on both sides: a smoothed ten-year earnings denominator in the numerator, and a real rate in place of a nominal one. Their real rate comes from the nominal ten-year yield less a trailing ten-year average of inflation, not from the indexed series. The underlying monthly series of index prices, earnings, interest rates and consumer prices runs back to 1871. It is published on Shiller's data site as ie_data.xls, the primary public source for the series.
There is empirical work consistent with investors making this error, not just an appeal to logic. Modigliani and Cohn argued in 1979 that equity investors suffer from inflation illusion, capitalizing real earnings streams at nominal discount rates. Campbell and Vuolteenaho (2004) restate the same error as the market extrapolating past nominal growth without adjusting for time-varying inflation. They decomposed the S&P 500 dividend yield into a rational real-growth forecast, a subjective risk premium, and a residual they label mispricing. The level of inflation explains almost 80 percent of the time-series variation in that residual. Their paper cites the persistent use of the Fed model by Wall Street alongside the Modigliani-Cohn hypothesis as reason to expect the error.
That result cuts in an uncomfortable direction. If inflation illusion moves prices, the naive spread may describe how a lot of capital actually behaves. Describing behavior and being right about value are separate questions, and only the second is argued here.
Figure 2. Which yield belongs in the comparison
The earnings yield is measured in approximately real terms; only one of the two bond measures matches it.
What the corrected spread can and cannot tell you
A properly constructed spread is a calibration of long-horizon expectations. It says roughly how much real return a diversified equity holding is priced to deliver above the real return available on Treasuries. That reading assumes the earnings denominator is a fair statement of earning power. Read it as a range, since the earnings denominator, the yield and any inflation assumption are all choices. That is the same discipline applied in realistic valuation ranges.
The spread has no natural resting level. The premium investors require for holding equities instead of Treasuries is not a constant. This is the constructive half of Asness's argument: the premium moves with the perceived riskiness of equities relative to bonds. When bonds are seen as volatile, the premium demanded of equities compresses; when equities are seen as volatile, it widens. A reading below its own historical average is therefore a fact about the reading, not evidence that the premium is too low.
Nor is it a timing tool, and this is where most of the damage gets done. The pillar article on what CAPE measures and where it fails documents the same interpretive problem at length for the underlying ratio. Long-horizon statistical reliability does not convert into short-horizon actionability.
Three failure modes account for most of the misuse. The first is comparing a spread computed on a trailing earnings yield against a history computed on a cyclically adjusted one, which mixes two different denominators. The second is reading a nominal spread and a real spread interchangeably, which is the units error above. A nominal spread may still track how other investors behave, a separate use needing a separate label. The third is treating the spread as a switch, converting a continuous calibration into a binary allocation decision that the underlying statistics cannot support.
Name the earnings basis, the yield, any inflation assumption used, and the as-of date, because a spread quoted without those four cannot be checked.
Where this sits in a bottom-up workflow
A market-level spread is context, not a conclusion. Its practical use is upstream, in the return an investor decides to demand. A real yield is the opportunity cost a long-horizon equity position has to beat. That makes it a floor under the required return, and nothing more. The discount rate and WACC walkthrough covers how that floor gets built into a full cost of capital, alongside the equity risk premium and the company-specific adjustments.
Index-level arithmetic cannot answer a company-level question. Aggregating earnings across hundreds of issuers averages away every difference in pricing power, capital intensity, accounting quality and earnings durability. Those differences are the entire content of a valuation. A spread computed on the aggregate tells an investor nothing about whether one company is trading below what its own cash flows justify.
The InvestViable stock screener screens a universe of 3,000+ US stocks on fundamentals and the Investment Score. Sliced views such as the value-style slice of the Stock Universe apply thresholds to those same fields. Both work at the company level, and neither takes a market-level spread as an input. The InvestViable Valuator runs a DCF from three explicit inputs: the cash flow growth path, the expected return you demand as the discount rate, and the terminal growth rate. The real yield discussed here is one reference point for that discount rate. The tool does not derive it; the analyst sets it.
The discipline this article asks for is narrow and cheap. Before quoting any earnings-yield-to-bond-yield spread, state which yield is on the other side of the subtraction. If it is a nominal yield, the number carries an inflation expectation that does not belong in it, and the sign may reverse once that is removed.
InvestViable does not publish buy or sell recommendations on individual securities. All analysis is based on public financial data and a transparent methodology. The Investment Score formula is proprietary; the inputs and what the score evaluates are documented.