Introduction
Market valuation tools frequently misguide investors who look for immediate signals. The cape index shiller ratio stands as one of the most cited yet misunderstood metrics in modern equity analysis. This metric smooths out short-term profit cycles and provides a historical baseline for market pricing.
Today, people use this specific ratio to declare markets overvalued, yet it persistently fails to predict market corrections within actionable timeframes. Historically, the ratio reached 43 in December 1999 during the dot-com bubble peak, but investors who exited equities at similarly elevated levels in 1997 missed three years of exceptional returns.
Understanding what elevated readings genuinely mean requires looking beyond simple historical averages. A proper evaluation requires an understanding of the structural limitations, earnings quality distortions, and index composition shifts that alter the mathematical foundation of these metrics. We will examine how to critically evaluate these valuation signals and integrate them into a disciplined long-term framework.
Disclaimer: This article provides educational information only and does not constitute investment advice. The examples discussed in the article are illustrative and do not recommend securities or market timing.
What CAPE measures (in brief)
CAPE divides current market price by the ten-year average of inflation-adjusted earnings. The ten-year smoothing prevents temporary profit spikes from distorting long-term valuation, which is what makes the metric usable for multi-decade comparisons. The twentieth-century historical average sat near 15.21, corresponding to a 6.6% annualized return.
For the step-by-step formula, data sources, GAAP vs non-GAAP earnings choice, and where to find pre-calculated data, see How to calculate cyclically-adjusted PE. The rest of this article focuses on what elevated readings actually mean — and why CAPE fails as a short-term market-timing signal despite its long-run statistical reliability. A probabilistic analysis framework helps integrate structural shifts in how companies generate profits today into the interpretive layer.
Index composition shifts
These structural shifts in profit generation make modern equity markets look different from the industrial markets of the past century. Currently, the Standard and Poor's index comprises 503 common stocks that large-cap companies issue. Energy, materials, and industrial firms dominated this list decades ago. Today, technology and communication services companies represent over forty percent of the total index market capitalization.
This shift in sector weightings creates a mathematical mismatch when analysts compare current cyclically adjusted price earnings to pre-1990 levels. High-margin software businesses command higher multiples than capital-intensive manufacturing plants. The index committee regularly updates these constituents, and they recently added artificial intelligence and data-center companies in the March 2026 reconstitution. These continuous updates mean that a cape index valuation model compares the pricing of modern digital monopolies against the pricing of old railroad operators.
Financial researchers developed the Component concept to address this problem. The sensible methodology recalculates historical averages and uses only the current index constituents. When analysts isolate the specific companies that operate today and trace their historical valuations, the resulting multiple looks much more grounded.
Earnings quality distortions and denominator problem
Analysts must adjust for these composition shifts and evaluate the price-to-earnings fraction because it relies on the accuracy of its denominator. Corporate accounting practices changed over the past few decades, and these changes affect how the cape index shiller ratio interprets profitability. Companies structure their businesses differently today, and reported earnings do not mean the same thing they meant fifty years ago.
Accounting treatments and shifts in capital allocation distort the earnings data. Analysts must normalize these distortions to get a logical reading of market value. Analysts evaluate these distortions and look at how companies change their financial statements:
-
Executives allocate capital to large share repurchase programs that reduce share counts and boost per-share metrics, but these programs do not create equivalent economic value.
-
Technology firms rely on high-margin business models that generate intangible assets rather than physical equipment.
-
Standardized accounting rules evolved to incorporate mark-to-market pricing, and this pricing model introduces unpredictable swings into quarterly profit reports.
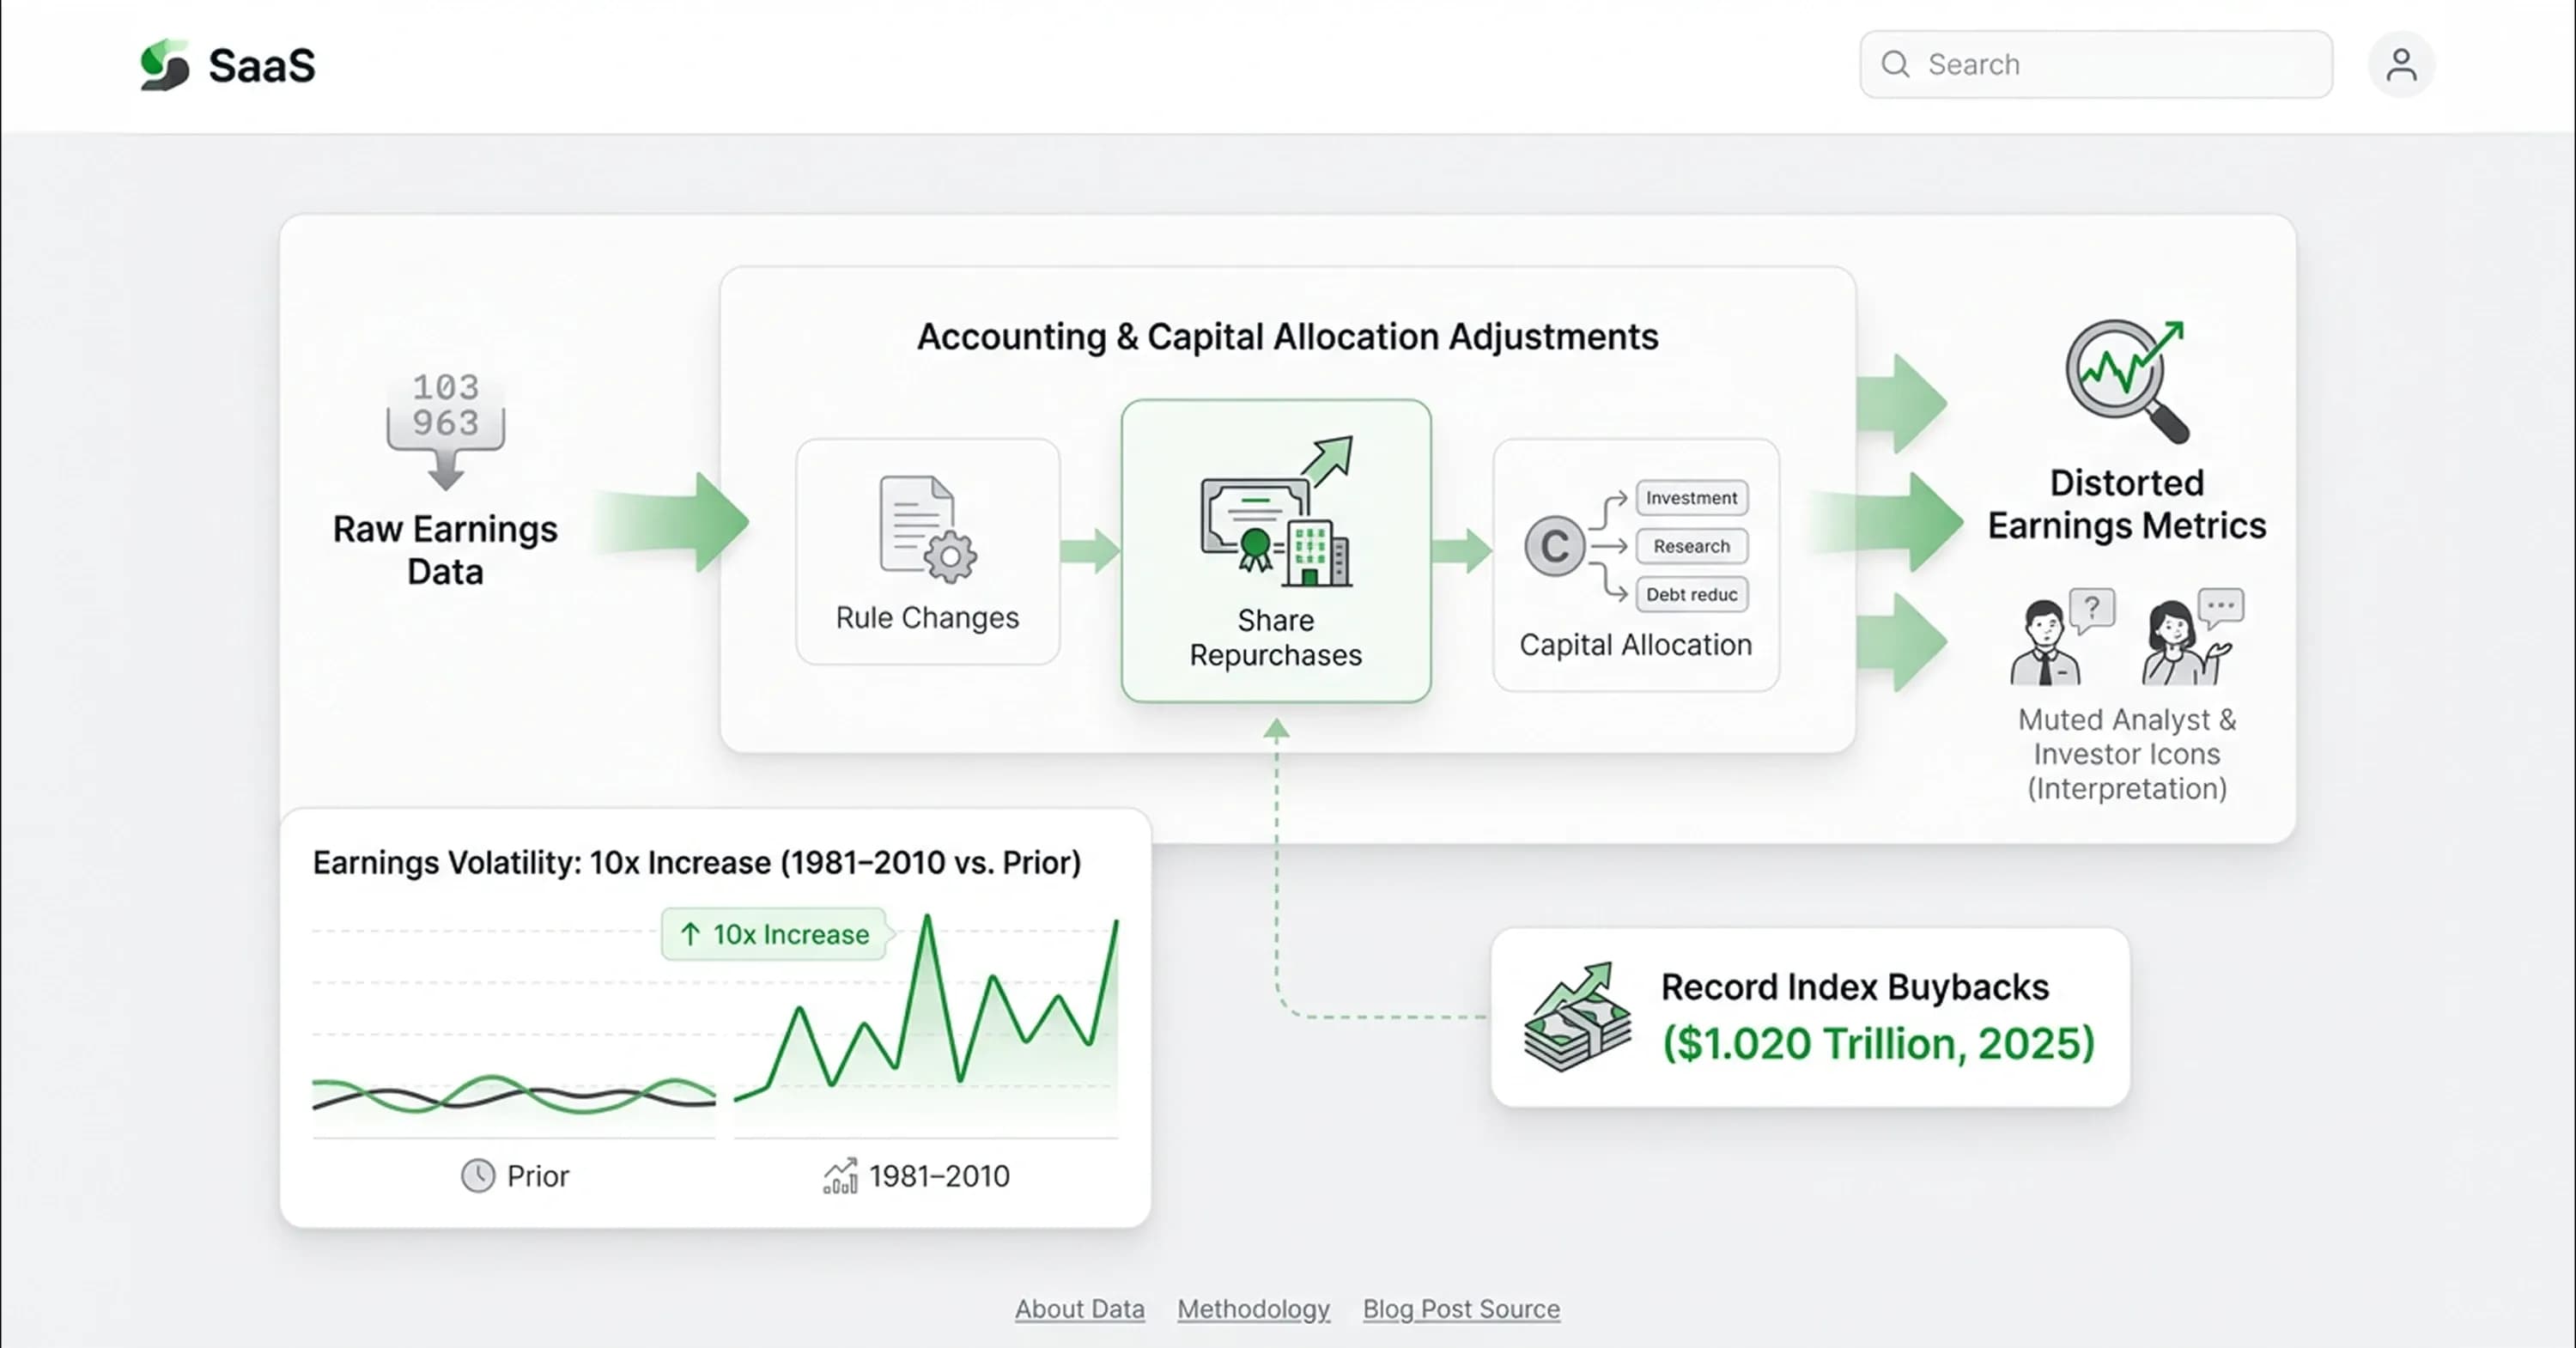
These shifts cause instability in the underlying data. Accounting standards govern earnings reports, and the earnings volatility increased ten-fold from 1981 to 2010 versus the prior period. Furthermore, twelve-month index buybacks reached a record $1.020 trillion by September 2025.
Because these repurchases inflate the denominator, a realistic fundamental analysis framework must adjust the raw earnings data before analysts assess overvaluation. If investors ignore these earnings quality issues, then they will misinterpret the historical baseline.
Predictive power degradation across time horizons
Financial metrics lose their reliability when underlying market structures change. The cape index valuation model demonstrates this predictive degradation across different time horizons. Historically, elevated multiples signaled poor future performance, but recent market cycles broke this established pattern.
Investors need an analytical approach to understand why high valuations don't guarantee immediate market corrections anymore. The stock market climbed significantly during the last decade despite elevated valuation readings. This divergence frustrates investors who expect traditional metrics to time market tops perfectly.
A disciplined evaluation of these metrics shows that they measure long-term return potential rather than short-term price movements. When structural shifts alter how companies generate profits, the historical baseline loses some of its predictive power. We must explore how these signals perform over extended periods and why they failed during recent equity rallies.
The disconnect between past data and present outcomes forces analysts to rethink traditional valuation frameworks. Standard models assume that markets revert to their historical averages quickly. However, structural changes in the modern economy delay this reversion process for decades. If capital keeps flowing into equities regardless of price, then historical boundaries lose their immediate relevance.
Evaluating cyclically adjusted price earnings horizons
Historical data reveals a strong inverse correlation between cyclically adjusted price earnings multiples and future market performance. When the metric climbs above its historical average, the subsequent ten-year returns usually don't increase. A recent CFA Institute analysis confirms this relationship and shows that higher CAPE values predict lower 10-year returns with a correlation coefficient of -0.7. This mathematical relationship helps analysts set objective expectations for long-term portfolio growth.
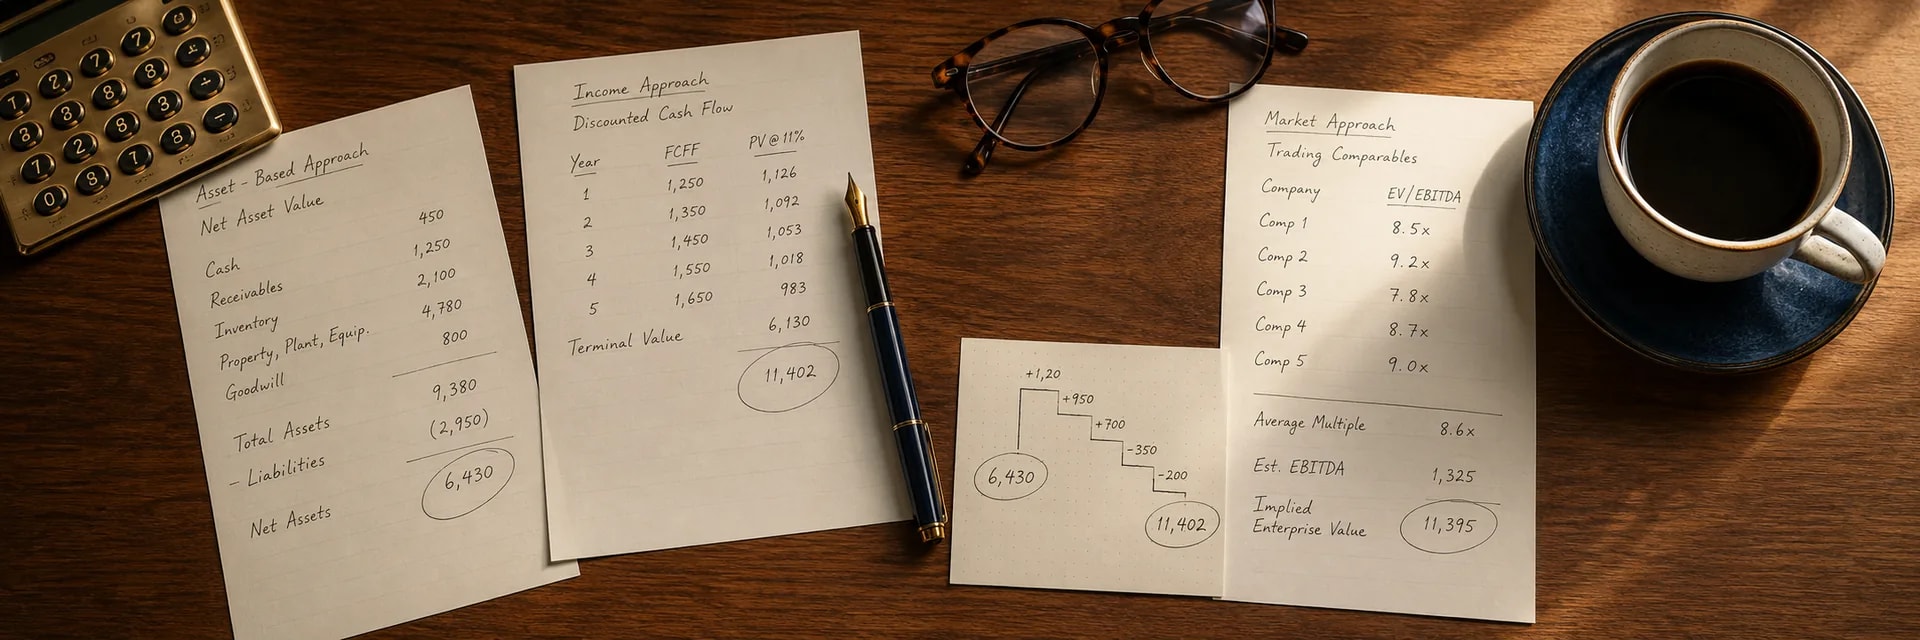
High starting valuations don't leave much room for multiple expansion over the next decade. Analysts who combine these baseline expectations with a traditional discounted cash flow analysis build a clearer picture of intrinsic value. Rather than predicting next month's market crash, the metric defines the realistic boundaries for equity returns over a twenty-year investment horizon.
Analyzing why cape index valuation model failed recently
The historical data shows clear long-term trends, but the metric recently struggled to predict market outcomes accurately. Financial researchers note that the CAPE failed to predict the strong returns from 1997 to 2007 despite elevated valuations. Several structural market changes caused this disconnect. Central bank accommodation flooded financial systems with liquidity, and this pushed investors toward equities regardless of their price tags.
At the same time, systematic capital flows from passive index funds automatically purchased shares and ignored traditional valuation boundaries. The technology sector also experienced an earnings revolution that generated unprecedented profit margins without requiring massive physical investments. Because modern markets transitioned toward earnings-driven returns rather than multiple expansion, high valuation readings don't automatically signal an imminent market collapse.
Practical interpretive framework for advanced investors
Investors need a rigorous approach to translate historical data into actionable portfolio decisions. The cape index shiller ratio works best as a calibration tool rather than a definitive timing signal. History shows that the metric is not always accurate in signaling market tops or bottoms.
Market exuberance can sustain high prices for years before any correction occurs. This requires patience. Furthermore, the high valuation reading does not account for prevailing risk-free interest rates. Because bonds sometimes offer low yields, investors willingly pay higher multiples for cyclically adjusted price earnings.
A methodical investor understands these limitations and integrates the metric into a broader valuation strategy. When multiple signals converge, analysts gain more confidence in their market assessments. Analysts use the following steps to evaluate market conditions:
-
Calibrate real return expectations for the next decade based on current elevated readings.
-
Compare the metric alongside other indicators like the price-to-sales ratio and the total market capitalization to gross domestic product ratio.
-
Ignore the ratio when timing short-term market corrections or identifying exact market bottoms.
-
Focus on underlying company fundamentals to identify individual equities that offer value despite broader market overvaluation.
If investors treat this metric as a portfolio construction input, then they avoid the costly mistake of exiting the market prematurely. Relying on a single ratio guarantees missed opportunities during sustained economic expansions.
Conclusion
These valuation concepts reveal that the cape index shiller ratio serves as a long-run return calibration tool rather than a definitive valuation verdict. History associates specific real return expectations with today's elevated prices, but this metric never dictates when the market will change direction. Investors resist narrative-driven exuberance when they recognize the structural evidence behind earnings quality and index composition shifts.
As markets increasingly reward fundamental analysis over multiple expansion, investors gain an operational advantage when they understand the limitations of valuation frameworks. Investors who maintain valuation discipline navigate uncertainty effectively and avoid flawed timing signals. InvestViable integrates these valuation principles into software for fundamental equity assessment. Investors can try the InvestViable valuation tool to independently verify the intrinsic worth of equity holdings. 19:T36