Introduction
Many beginners assume that a stock trading at $50 is cheaper than one trading at $500, but this belief leads to poor investment decisions. A low share price doesn't guarantee a bargain, just as a high share price doesn't indicate an expensive company. To understand what a business is worth, you must look past the ticker price and analyze the total market capitalization. This requires a shift from viewing stocks as electronic lottery tickets to viewing them as fractional ownership in a business.
The distinction between price and value is fundamental to successful investing. While the market sets the price every second based on supply and demand, the value relies on the company's assets, earnings, and cash flow. As Warren Buffett stated: "Price is what you pay, value is what you get." When you focus on stock market value, you assess the aggregate size of the company rather than the cost of a single share. This approach prevents you from overpaying for weak companies just because their share price looks low.
Disclaimer: This article is for educational purposes only and serves as a guide to market value concepts rather than investment advice or market predictions.
Sticker Price Fallacy
Most new investors judge a stock's expense by looking at the price tag, but this approach fails to account for the total number of shares.
Think about a large pepperoni pizza. If the chef cuts the pizza into four slices, each slice looks huge. If the chef cuts that same pizza into sixteen slices, each slice looks small. But the total amount of pizza on the table remains exactly the same. The stock market value meaning relates to the whole pizza, not the size of the individual slice. A company can have a low share price because it issued billions of shares.
To understand this disconnect, look at the data. As of early 2025, Berkshire Hathaway Class A shares trade at $750,005, while Apple trades at roughly $276 per share. A novice might assume Berkshire is the larger company. However, because Apple has far more shares outstanding, its market capitalization sits at $4.06 trillion compared to Berkshire's $1.1 trillion. The $276 stock represents a much larger business than the $750,005 stock.
This applies to smaller companies as well. Small-cap stocks often range between $250 million and $2 billion in total value, yet their individual share prices can be higher than those of massive corporations. You need to verify the total pie before you buy a slice. If you want to learn how to screen for these discrepancies, you can review our guide on fundamental analysis workflow.
Once you ignore the sticker price, you need to understand the math that determines the total price tag.
Mathematics of Value
You can determine the size of any public company by using a simple multiplication equation.
The stock market value formula is the current share price multiplied by the total number of shares outstanding. This gives you the market capitalization. For example, if a company sells shares for $10 and has one million shares outstanding, the market values the company at $10 million.
Buyers and sellers constantly shift this number as they agree on prices throughout the trading day. Fidelity Investments notes that market cap is calculated by multiplying share price by outstanding shares, which confirms that the per-share price alone tells you little. This math scales up to the entire economy. As of January 27, 2026, the S&P 500 reached 6,979 points, but the total market capitalization reached $62.3 trillion. The index points just track performance, while the capitalization tracks actual dollar value.
Investors should always verify these numbers and understand underlying company value before trading. If you want to understand the underlying value and set your own price target quickly, you can use our stock valuation tool to see and work with the data instantly.
While the math tells you what the market pays now, it doesn't necessarily tell you what the business is worth.
Intrinsic Value vs. Market Price
A distinct gap often exists between the price a buyer pays and the value the buyer receives.
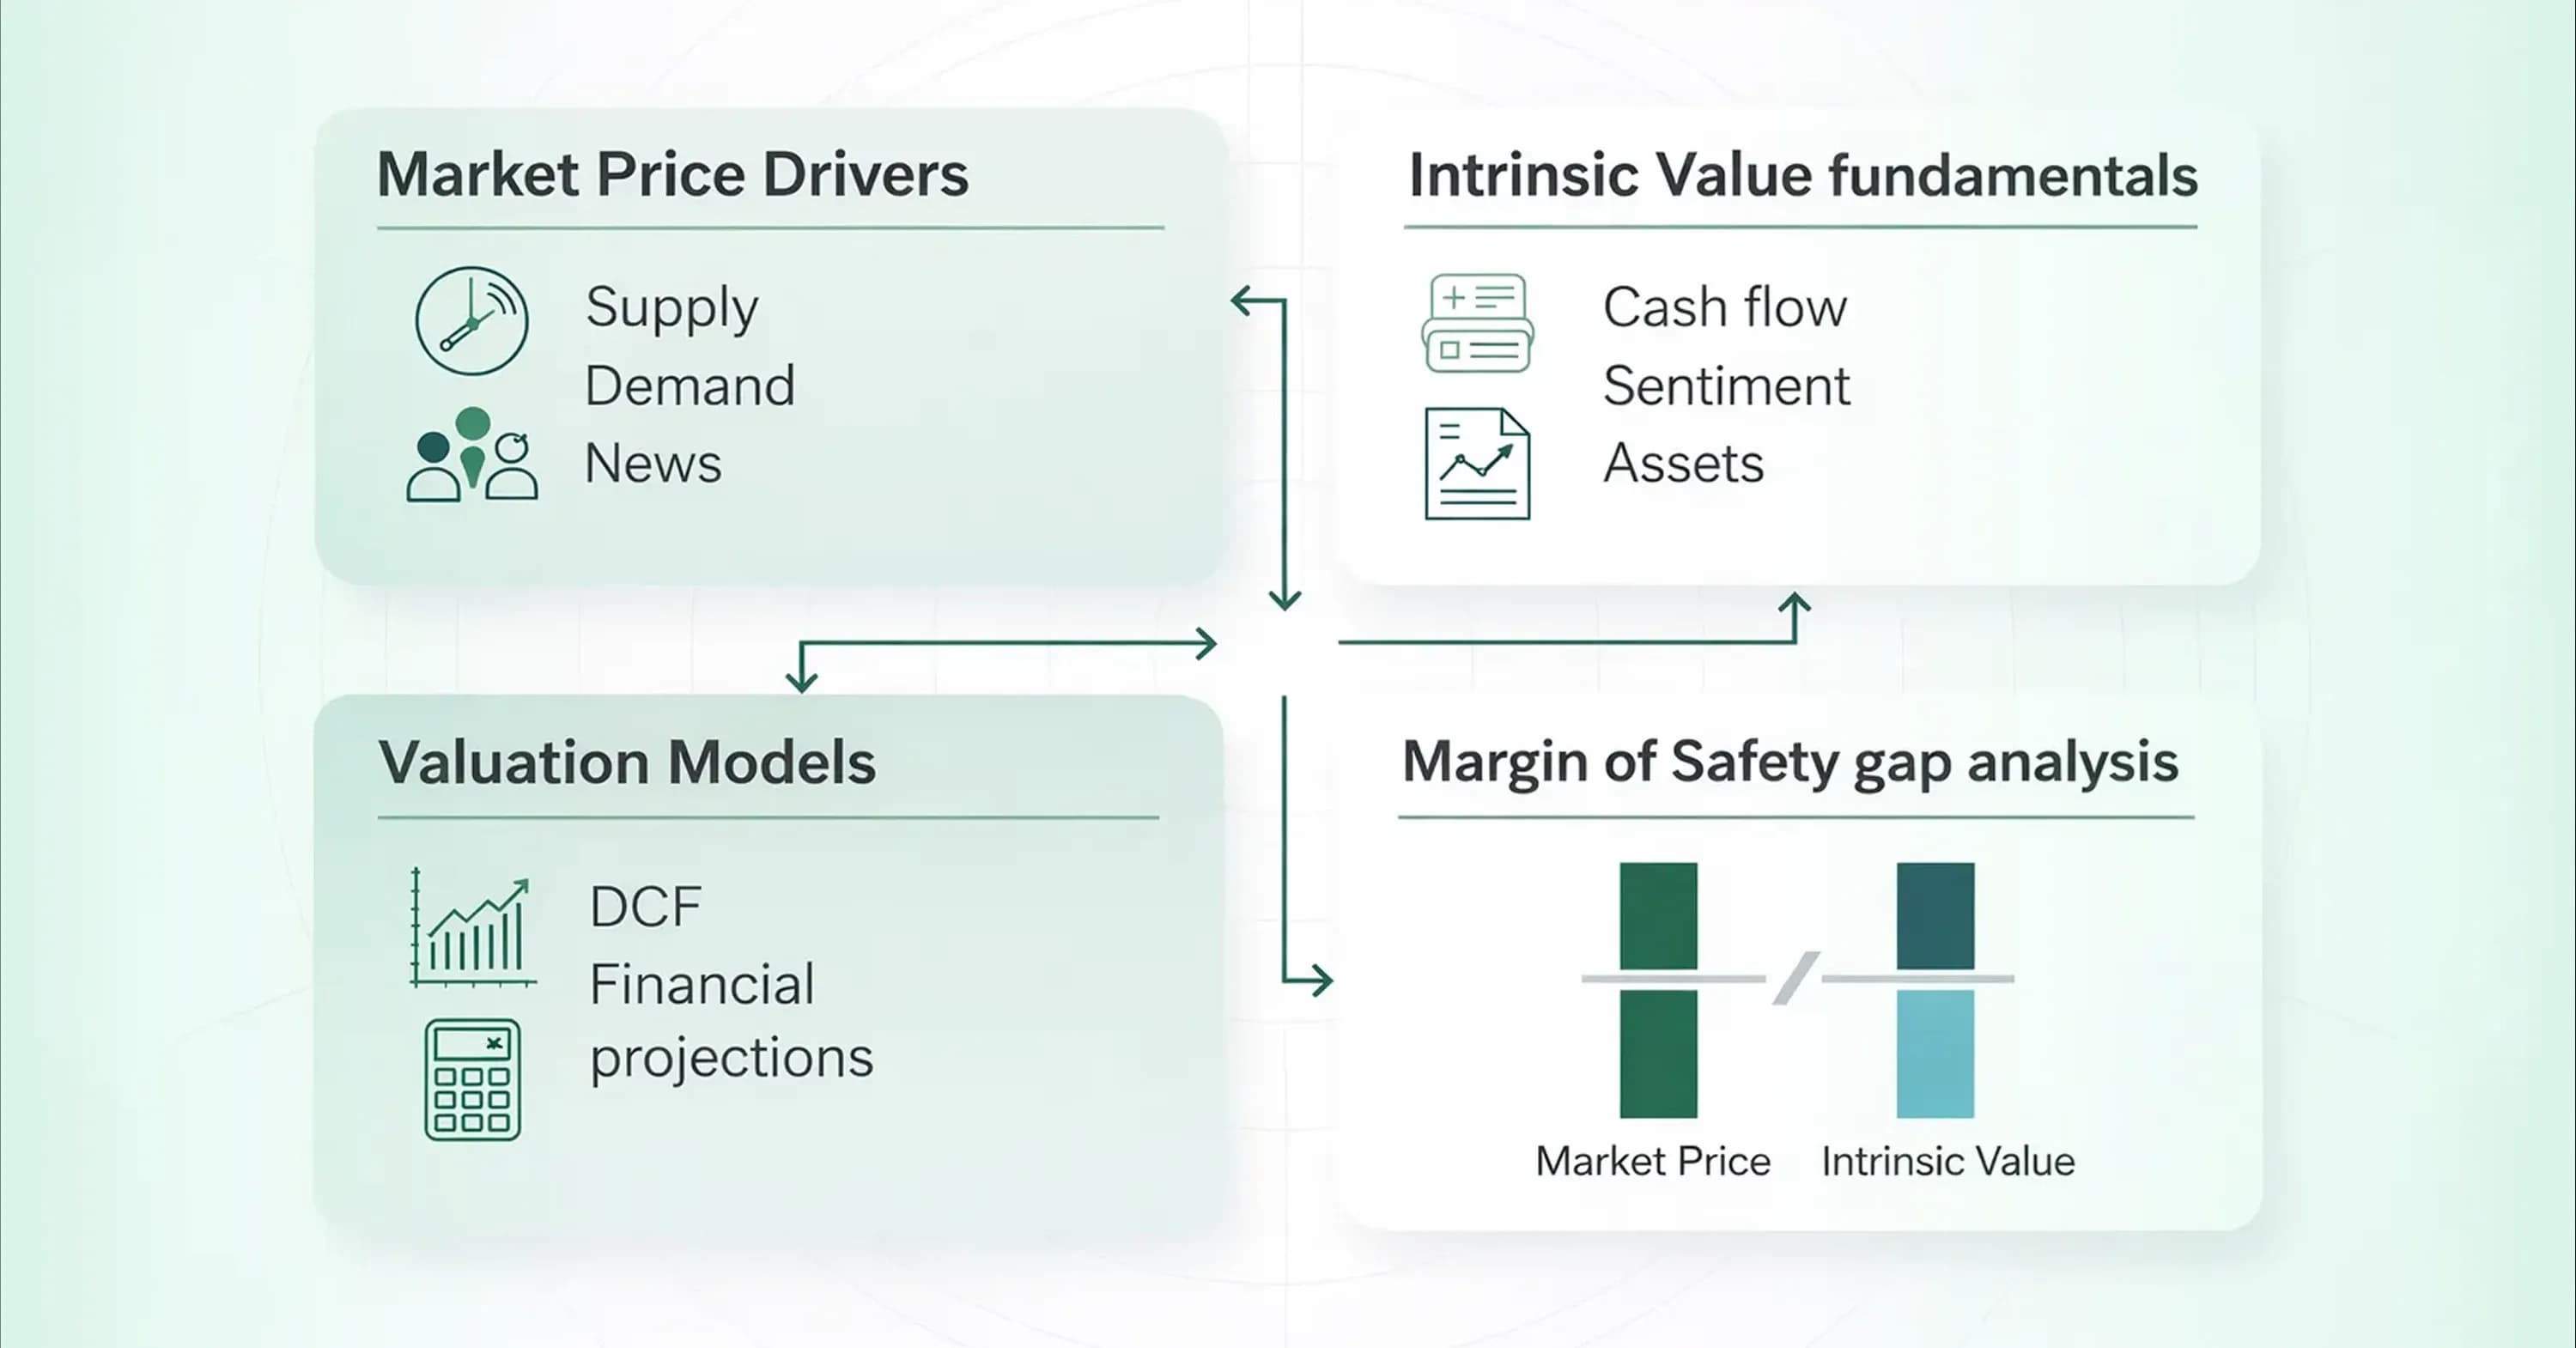
Market price represents the amount someone is willing to pay for a stock right now. Intrinsic value represents what the stock is mathematically worth based on the cash the company generates. Intrinsic value represents what a stock "should be worth" based on fundamental data, while market price just reflects the current balance of supply and demand.
Smart investors look for opportunities where the stock market value drops below the intrinsic value. This difference provides a margin of safety. Analysts at Morningstar use discounted cash flow models to determine this intrinsic value, and their results often differ significantly from the ticker price you see on your screen. The market price fluctuates on news and rumors, but intrinsic value relies on tangible assets and earnings. If you want to learn how to calculate this yourself, read our DCF valuation guide.
Recognizing the difference between price and value allows you to avoid overhyped stocks and find genuine bargains, but you must also remember that these calculations aren't static.
Corporate Actions and Value Shifts
Corporate actions change the variables in the valuation equation without always changing the business itself. You must understand how the stock market value formula reacts when a company alters its share count. For instance, when a corporation initiates a stock buyback, it purchases its own shares from the open market and retires them. This action reduces the number of outstanding shares. If the company's total profit remains the same, the profit per share increases because fewer shares exist to split the earnings. This concentrates ownership and often increases the share price, even if the total size of the business didn't grow.
Conversely, market fluctuations can shrink the total capitalization even for the strongest companies. The market cap for the top ten companies in the S&P 500 declined from $25.3 trillion to $24.9 trillion between December 2025 and January 2026. This drop occurred because buyers were willing to pay less for the shares, not because the businesses sold fewer products.
Smart investors look for these discrepancies. For example, recent data suggests that Berkshire Hathaway's price-to-tangible book value is below historical averages. This indicates a potential undervaluation despite the high sticker price. You can learn more about interpreting these signals in our investing education section. After a corporate action makes an adjustment to the share count, you should always recalculate to see where the value sits.
While share count changes affect market capitalization, they don't account for the debts the company owes.
Enterprise Value: The Real Cost
Enterprise value offers a more precise measurement of what it costs to buy a company than market capitalization does. While market capitalization tells you the price of all the shares, it ignores the company's debt and cash positions. Imagine you buy a house for $500,000, but the house comes with a $300,000 mortgage that you must pay off. The real cost of that house is $800,000. Enterprise value works the same way. It adds the debt to the market cap and subtracts the cash the company has on hand.
This metric reveals the true takeover price. If a company has a low market cap but carries massive debt, it's far more expensive than it looks. Conversely, a company with high cash reserves is cheaper than its market cap suggests because that cash effectively refunds part of the purchase price. The stock market value meaning changes significantly when you factor in these liabilities.
Consider the tech giants. As of early 2026, Nvidia's market cap exceeds Apple's, despite comparable share prices around the $177-276 range. To understand which is the better value, you would look at their balance sheets. The company with less debt and more cash presents a lower enterprise value relative to its earnings. An investor ignores this obligation at their own peril.
Once you understand the cost of a specific company, you also need to understand how broader market indices track value differently.
Distinguishing Index Points from Value
Investors often confuse the points they see on a ticker with the actual dollar value of the underlying economy. An index level, such as the S&P 500 trading at 6,900, is a composite score that tracks performance, not a price tag. These points don't represent dollars. They represent a weighted average of the companies within the index. Therefore, a 1% gain in index points represents a massive shift in actual stock market value because it reflects trillions of dollars moving across the economy.
Value also shifts unevenly across different sectors of the market. Large-cap indices often move differently than small-cap indices. For example, the Russell 2000 small-cap index surged 5.39% in January 2026, which outperformed the S&P 500's 1.44% gain. This data shows that value flowed into smaller companies at a faster rate than it flowed into the giants.
You must make a clear distinction between the headline number on the news and the valuation of the specific sector you want to buy. If you only watch the major index points, you might miss opportunities where the actual value is growing most rapidly. A high index number doesn't mean every stock is expensive, and a low index number doesn't mean every stock is cheap. You must look at the capitalization and enterprise value to know the truth.
Conclusion
Market value is a dynamic consensus that changes every second, but it doesn't always reflect the true worth of a business. As you've learned, the price ticker is just the tip of the iceberg. The real story lies in the market capitalization, the enterprise value, and the underlying fundamentals that generate cash flow. Investors who rely solely on share price or index points miss the mathematical reality that drives long-term returns.
The disconnect between price and intrinsic value creates opportunities for those who pay attention to the data. Instead of following the crowd or getting distracted by nominal share prices, you should focus on the metrics that matter. Look at the total shares outstanding, assess the debt levels through enterprise value, and verify that the company's earnings justify its market cap.
If you want to refine your search for undervalued companies further, consider using a Stock Screener Overview to filter stocks based on the stock market value criteria we discussed. By anchoring your decisions in math rather than sentiment, you position yourself to make smarter financial choices.