
InvestViable does not publish buy or sell recommendations on individual securities. All analysis is based on public financial data and a transparent methodology. The Investment Score formula is proprietary; the inputs and what the score evaluates are documented.
Why fundamental errors are upstream of every valuation
The discounting math in a valuation model is mechanical. So is the multiples math. Both depend entirely on the inputs that go in. When the inputs are wrong, the math produces a number with the appearance of precision and none of the substance.
Fundamentals as the analyst encounters them on any retail-facing data platform are the end product of a supply chain that runs from the company's regulatory filing through an extraction pipeline, an accounting interpretation layer, a normalization step, and finally a display surface, as documented in how stock market database design determines data reliability. Errors can be introduced at any stage. A filing extraction can pull from the cover page summary instead of the audited statement. An accounting interpretation can classify a recurring item as one-time. A normalization layer can apply a constant-currency adjustment that hides the operating reality. A display surface can show a trailing-twelve-month figure under the label "latest fiscal year." None of these errors is visible on the per-share output. They become visible only when the analyst traces each figure back to its primary source.
Most published critiques of fundamental analysis treat the discipline as a forecasting exercise. The harder problem is upstream. A forecast built on verified fundamentals is a defensible estimate. A forecast built on unverified fundamentals is a guess wearing a spreadsheet. The forecasting problem matters; the verification problem precedes it.
The checklist that follows assumes the analyst has access to a set of fundamentals from any source. It does not specify which platform; it specifies what to verify. The structure parallels the supply-chain audit of the data provider one direction over, and it sits laterally to why two platforms produce different intrinsic values for the same ticker. This checklist asks a narrower question: can the single set of fundamentals in front of the analyst be trusted to feed a model at all.
The fundamental analysis checklist, by category
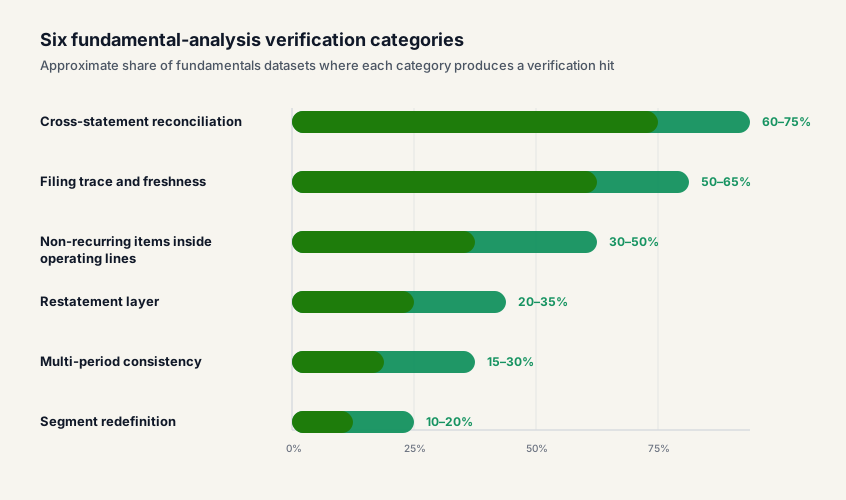
The fundamental analysis checklist below covers six verification categories. They are ordered by how often they surface a real data error in practice, not by how complex the check is to run. Filing trace and cross-statement reconciliation produce the most frequent hits because every figure has a primary source and every figure has to reconcile to the other two statements. Non-recurring item detection and restatement layering surface fewer hits but the ones they surface tend to move intrinsic value by larger amounts. Multi-period consistency and segment-redefinition detection are the long-tail checks that catch the errors the prior four miss.
For each category, the verification questions follow the same pattern: what is the figure, where did it come from, what is the audit version against the primary filing, and what error mode emerges when the figure and the audit version disagree. The questions apply to any equity issuer reporting on a quarterly cadence, whether the issuer is a mature consumer compounder, a software platform, an industrial manufacturer, or a diversified holding company. Industry-specific checks for banks, insurers, REITs, and regulated utilities require additional discipline not covered here because those businesses are valued with adjusted frameworks where the standard equity audit does not apply cleanly.
Figure 1. The six fundamental-analysis verification categories and their typical hit rate
Approximate share of fundamentals datasets where each category produces at least one verification hit on a randomly selected mid-cap U.S. equity issuer.
Use the checklist as a verification overlay on top of any set of fundamentals, not as a substitute for understanding the business. The checklist surfaces where the data deviates from defensible practice; the analyst still has to decide whether the deviation reflects a legitimate accounting choice or a data error.
Sanity-check fundamentals against the primary filings
The starting point of the audit is the primary filing. For U.S.-listed equity issuers this is the 10-K (annual) or 10-Q (quarterly) on SEC EDGAR. For foreign private issuers, the 20-F. For non-U.S.-listed companies, the equivalent annual or interim report on the home-country regulator. The filing is the audited record. Every fundamentals figure on every platform should trace back to a specific line item on a specific filing.
The sanity-check fundamentals workflow runs in three passes:
- Identify the filing date. Pull the most recent 10-Q from EDGAR for the issuer being audited. Note the period-end date and the filing date. The period-end date is what the figures describe; the filing date is when those figures became publicly known. A fundamentals dataset claiming "current" figures dated more than ninety days after the period-end is either showing pre-filing estimates or has fallen behind. For Apple (AAPL), which reports on a fiscal calendar ending in late September, the period-end date and the filing date both matter for any year-over-year comparison aligned to calendar quarters.
- Trace the headline figures. Pick three figures that anchor any valuation: trailing-twelve-month revenue, operating income (or operating margin), and diluted weighted-average share count (computed under the treasury-stock method, the SEC convention for the EPS denominator). Find each one on the cover-page summary of the 10-K or 10-Q (revenue and operating income on the income statement; share count on the cover page). Compare the platform's figure to the filing's figure to the dollar. A material mismatch is the first signal that the platform applied an adjustment that is not surfaced on the output.
- Note the basis disclosure. The cover page of every 10-Q discloses whether the company has filed any amendments (10-Q/A) or restatements since the original filing. If amendments exist, the platform might be serving the amended version or the original; the audit needs to know which.
For issuers reporting in non-USD currencies, the filing-trace pass adds one step: confirm whether the platform is showing the figures in the reported currency (e.g., yen for a Japanese issuer) or USD-translated. The translation method (spot rate, average rate, constant currency) materially changes growth rates and margins for any period that crossed a significant currency move.
The filing trace is not a one-time exercise. Fundamentals get backfilled, restated, and adjusted over time. A figure that traced cleanly six months ago may have been amended since. The discipline is to re-run the trace whenever the analysis depends on a specific period's data, especially for any historical period more than one fiscal year in the past.
Cross-statement reconciliation: income statement, cash flow, balance sheet
The income statement, the cash flow statement, and the balance sheet are three views of the same underlying business activity. They reconcile to each other through specific accounting identities. When fundamentals data is correct, the three statements tie. When the data is wrong, the failure to tie is usually the first signal.
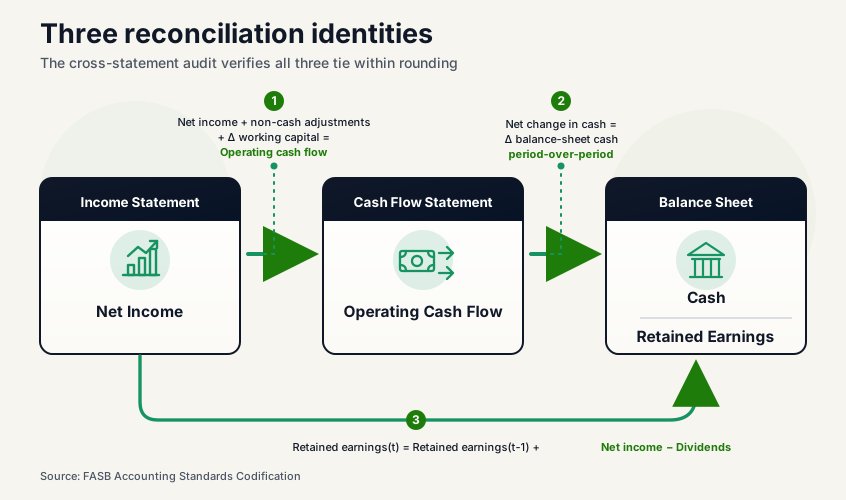
The reconciliation runs through three identities. Each one is testable against figures available on the same 10-K or 10-Q.
The first identity ties net income to operating cash flow. The cash flow statement starts with net income and adjusts to arrive at operating cash flow by adding back non-cash items (depreciation, amortization, stock-based compensation, deferred taxes) and adjusting for changes in working-capital items (accounts receivable, inventory, accounts payable, accrued liabilities). The reconciliation surfaces immediately when stock-based compensation is recorded as an operating expense on the income statement and then added back as a non-cash item on the cash flow statement. For Meta Platforms (META), where SBC runs at approximately twelve percent of revenue, the add-back on the cash flow statement should approximately equal the SBC expense flowing through cost of revenue and operating expense lines. A platform that shows the income-statement margins but hides the cash-flow add-back is presenting an incomplete picture of operating performance.
The second identity ties the net change in cash on the cash flow statement to the change in cash on the balance sheet. The bottom of the cash flow statement (net change in cash, which is the sum of operating, investing, and financing cash flows) equals the change in the cash-and-equivalents line between consecutive balance sheets. The reconciliation is a direct algebraic check: prior-period balance-sheet cash plus current-period net change in cash equals current-period balance-sheet cash. Failure to tie indicates that one of the three statements is sourced from a different period or has been adjusted without flowing the adjustment through the others.
The third identity ties net income to the change in retained earnings. Retained earnings on the current balance sheet equals prior-period retained earnings plus current-period net income, less dividends declared and any share-repurchase-related adjustments. For Johnson & Johnson (JNJ), a dividend-paying issuer with multi-year buyback authorization, the reconciliation surfaces immediately whether the platform's net-income figure is in the same currency, period, and accounting basis as the balance-sheet retained earnings figure. A break in this identity is almost always an indicator that the income statement and balance sheet were extracted from different filings.
Figure 2. The three reconciliation identities that tie the financial statements together
A simplified diagram of the three identities the cross-statement audit verifies: net income → operating cash flow, net change in cash → balance-sheet cash, and net income → retained earnings.
Working-capital changes are where most of the reconciliation difficulty lives. Each working-capital line on the balance sheet (accounts receivable, inventory, accounts payable, accrued liabilities) has a corresponding line on the cash flow statement; the change in one should equal the corresponding line on the other within rounding and acquisition-related adjustments. When the working-capital changes do not tie, the most common explanation is that the platform extracted the balance sheet from one filing and the cash flow statement from another.
Restatements, one-offs, and fundamentals data quality over multiple periods
Restatements and non-recurring items are where fundamentals data quality breaks down most often once the within-period reconciliation passes. Both produce figures that look correct in isolation and turn out wrong when compared to prior-period data or the original-as-reported version.
FASB ASC 250 and the PCAOB consistency standard govern how changes in estimate, changes in principle, and corrections of errors flow into restated financial statements. Material corrections trigger 10-K/A or 10-Q/A restatements. The SEC keeps both versions on EDGAR. The audit question is which version the fundamentals dataset is serving. Platforms vary: some serve original-as-reported but overwrite with restated figures after a one-year window; others always serve restated. The fundamentals data quality of a historical period depends on this choice, which is rarely surfaced on the per-period figure.
Non-recurring items inside operating lines are the second source of multi-period inconsistency. Companies report two parallel versions of their income statement: the audited GAAP version filed with the SEC and a management-defined "non-GAAP" or "adjusted" version often highlighted in earnings releases. SEC Regulation G requires non-GAAP measures to be reconciled to the nearest GAAP equivalent, but it does not constrain which items management chooses to exclude. Common exclusions include stock-based compensation, restructuring charges, amortization of acquired intangibles, and impairments. For Nvidia (NVDA) during periods of significant acquired-intangible amortization, the GAAP operating margin and the management-adjusted operating margin can differ by several percentage points; both numbers are correct in their own definitions, but they describe different operating bases.
The audit for non-recurring items runs three checks:
- Frequency check. A "non-recurring" item that appears in every annual report for five consecutive years is operating expense, regardless of how management labels it. The CFA Institute Research Foundation publishes valuation research that covers the analytical discipline for re-treating recurring "one-offs" as operating costs.
- Magnitude check. An item flagged as one-time but representing over five percent of revenue or fifteen percent of operating income deserves explicit treatment, not exclusion.
- Direction check. Management-defined adjustments tend to flow in one direction: removing costs to increase reported profitability. An adjusted-margin series that runs five to ten points above the GAAP margin every quarter is a signal the platform is showing the management view rather than the audited view.
Multi-period consistency adds a final check. Companies occasionally redefine business segments (governed by FASB ASC 280), change revenue-recognition policies, adopt new accounting standards (lease accounting under ASC 842 is one recent example), or change fiscal-year ends. Each break reduces the comparability of historical periods. A platform that shows a clean multi-period series across one of these breaks has either restated the prior periods (analytically consistent but uses look-ahead information) or stitched the periods together without adjustment (mechanically inconsistent). Aswath Damodaran's published valuation work treats input verification as a precondition for any defensible intrinsic-value estimate. The analyst needs to know which convention the platform applied before trusting the long-term growth rate or margin trajectory.
How to apply this checklist on any platform's fundamentals
The fundamental analysis checklist works as a pre-valuation gate regardless of where the fundamentals come from. Whether the source is a retail-facing aggregator, a self-built extraction from EDGAR, a sell-side analyst's model export, or an institutional terminal output, the same six categories produce the same verification questions.
The pre-valuation workflow runs in five steps:
- Pull the most recent 10-K or 10-Q from EDGAR. The audit anchors on the primary filing, not on the platform's display. Cross-reference the period-end date and the filing date.
- Run the filing trace on the three headline figures. Trailing-twelve-month revenue, operating margin, and diluted weighted-average share count. Compare each to the filing line item.
- Run the cross-statement reconciliation. Verify the three identities: net income to operating cash flow, net change in cash to balance-sheet cash change, net income to change in retained earnings. A break on any one is a stop-the-process signal.
- Screen for non-recurring items. Identify the items management has classified as one-time. Apply the frequency, magnitude, and direction checks. Decide which items belong inside the operating base for the valuation.
- Confirm the restatement layer and the multi-period basis. For any historical period used in growth-rate or margin-trajectory analysis, verify whether the platform serves original-as-reported or restated figures, and whether segment definitions are consistent across the periods.
The output of the audit is rarely a different set of fundamentals. It is a documented set of input choices with a defensible source for each, and a list of the specific platform conventions that the downstream model now needs to inherit explicitly. The five-step workflow takes twenty to thirty minutes for a single issuer and surfaces the data-quality issues that would otherwise show up as inexplicable model behavior three weeks later.
For investors who want a reference model to anchor the post-audit fundamentals against, the Valuator on Invest Viable surfaces the core model inputs (cash flow growth path, discount rate, and terminal growth rate) the user can override against audited fundamentals. An intrinsic-value figure that hides its inputs is not auditable. A model that exposes its inputs to the same checklist treatment is.
The discipline this article describes sits at the entry point of any valuation workflow. Verified fundamentals feed into the DCF inputs checklist, which audits the model assumptions (revenue path, margin trajectory, discount rate components, terminal value structure, share count) once the inputs are confirmed. The intrinsic value range produced by the DCF, paired with a margin of safety calibrated to the verification quality the checklists revealed, is what anchors the maximum-acceptable-price decision. A point-estimate intrinsic value built on un-audited fundamentals is the artifact of a model that has assumed its inputs. A range of intrinsic values built on audited fundamentals with documented data-quality choices is the artifact of a discipline.