Introduction
Investors often view numbers on screens as unchangeable facts. They see a Price-to-Earnings (P/E) ratio of 15 and assume it represents the truth, much like the temperature on a thermometer. However, financial data is not a static resource. It is a manufactured product that travels through a complex supply chain before it reaches a brokerage app. A single broken link in this chain can distort valuation metrics and lead to disastrous capital allocation decisions if a stock split adjustment is missed or earnings updates lag.
The infrastructure that processes this information is invisible to most, yet it determines the reliability of every chart and ratio used for analysis. Major financial institutions understand that the "plumbing" matters as much as the analysis itself.
For instance, operational failures in data systems can have significant consequences, such as when Citibank wired $900 million to lenders by mistake because of processing errors and governance deficiencies. This reality affects individual market participants as well: if equity market data is flawed, the investment thesis is flawed. Reliable analysis starts with questioning the source, age, and integrity of the trusted numbers.
Disclaimer: The information presented herein is intended solely for educational purposes regarding market data and visualization workflows and should not be interpreted as trading or investment advice.
Scope of Equity Data
Equity market data defines these numbers as the legal and structural ownership in a public company rather than just a ticking price on a screen. Market participants often fixate on price movements, but the discipline centers on the specific rights attached to a security, such as voting power and dividend entitlement. This distinction matters because a price without context lacks meaning. For example, a stock price might drop by half because of a stock split, but the value of the holding remains unchanged.
Professionals demand equity market data that captures these corporate actions with absolute precision. A data feed must account for every merger, spin-off, and rights issue to maintain the integrity of historical analysis. Valuation ratios lose their validity and charts become misleading without this structural backbone. The data encompasses the entire lifecycle of a security from its initial public offering to its potential delisting. Investors understand this scope and realize that they analyze a complex legal instrument rather than a random number generator.
Data Feeds and Delivery
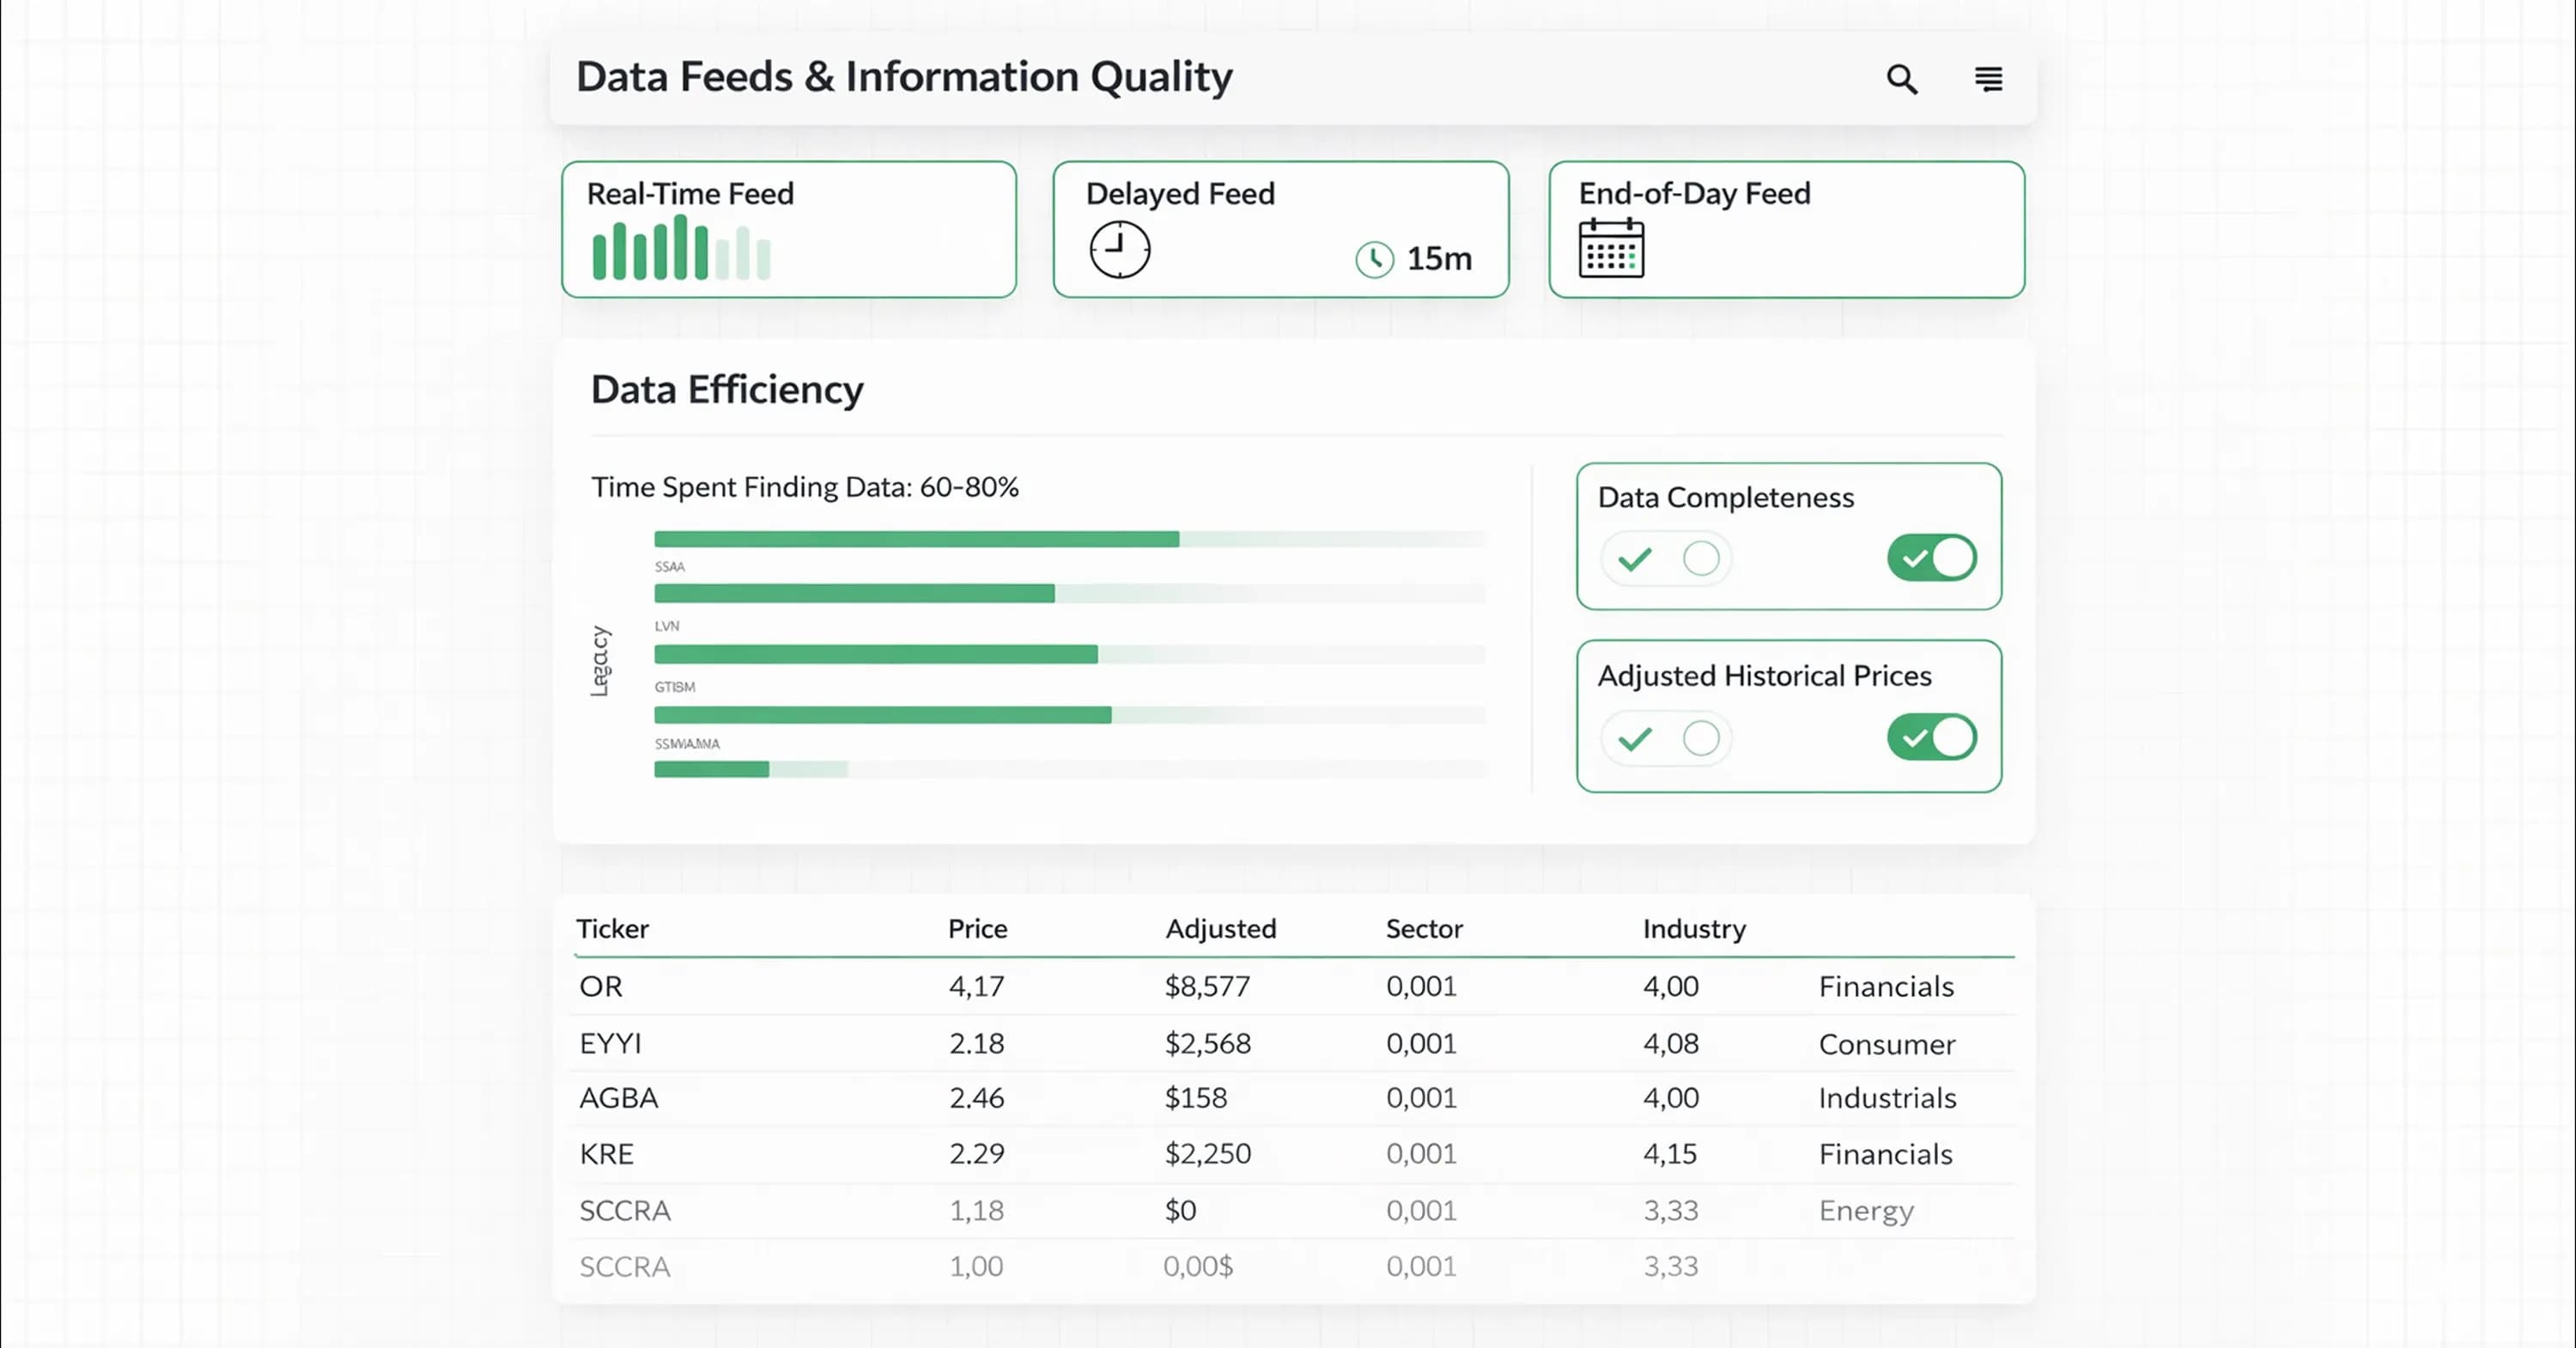
Financial institutions receive information about this complex instrument through specific delivery mechanisms known as feeds. These feeds act as contractual agreements that determine when and how information arrives at the terminal. The industry segments these feeds into real-time, delayed, and end-of-day categories.
Individual investors often pay premiums for real-time access because they assume that speed equals advantage. However, fundamental analysis rarely requires speed. Latency refers to the delay between a market event and its reception, and it rarely affects the thesis. A fifteen-minute delay does not change the intrinsic value of a company over a five-year horizon.
Data completeness matters more than speed. Investors often struggle to aggregate scattered information into a usable format. A study by MIT Sloan notes that people spend 60-80% of their time trying to find data, and this represents a massive productivity loss.
This inefficiency highlights the importance of a reliable equity market data screener that centralizes information. Smart analysis prioritizes skepticism toward the data source instead of chasing milliseconds. Analysts prevent errors when they assess whether a feed includes adjusted historical prices or accurate shares screener filtering capabilities.
Five Pillars of Valuation Data
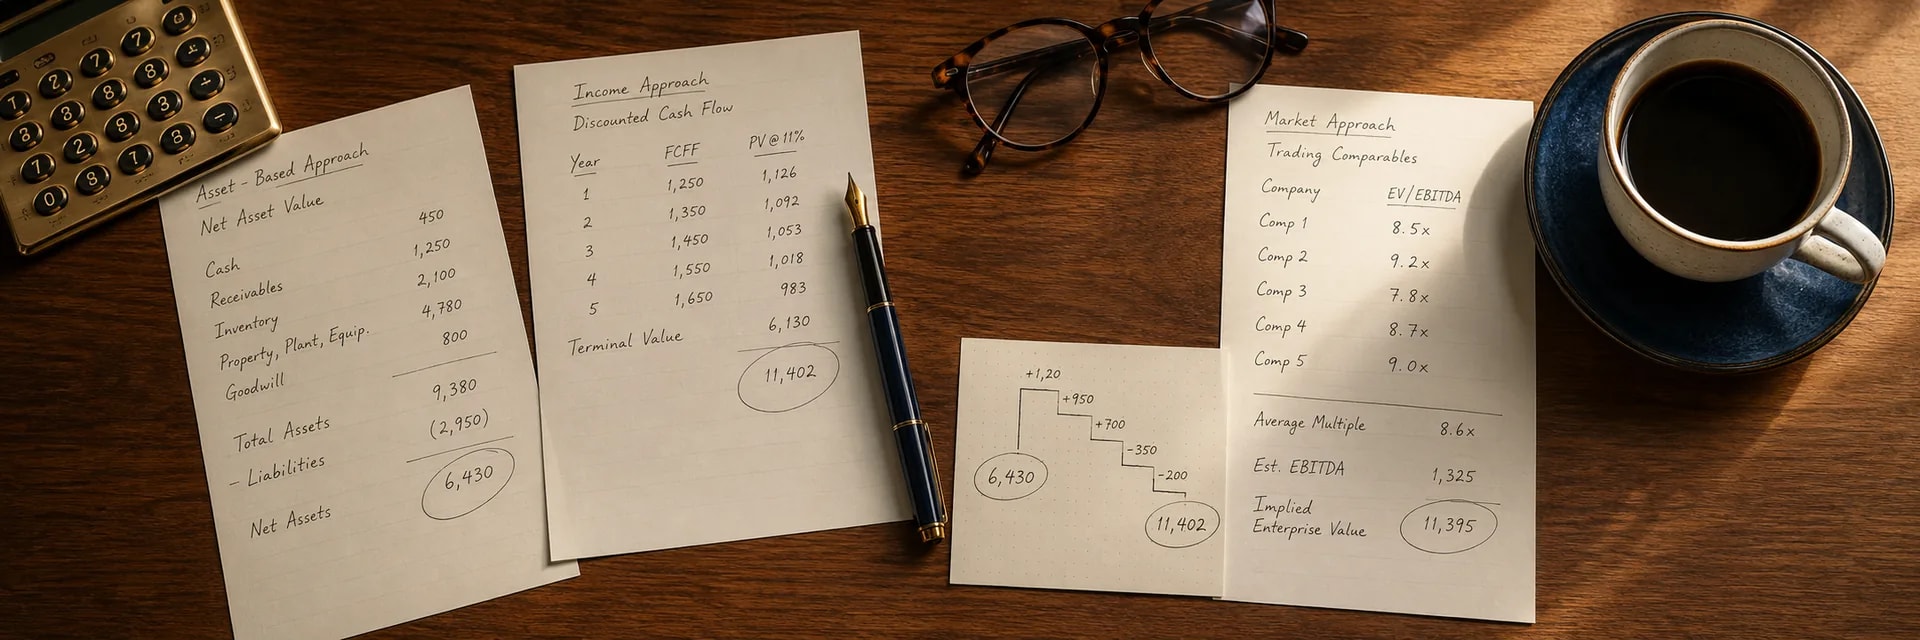
Reliable feeds deliver the raw material for valuation models, which rely on a strong foundation of five distinct data types: quotes, corporate actions, fundamentals, estimates, and classifications. Quotes provide the market price, while corporate actions adjust that price for splits and dividends.
Fundamentals come from regulatory filings like the 10-K and offer the raw accounting numbers necessary for analysis. However, the accuracy of this data depends heavily on the equity market data provider. Errors often occur when providers extract data from non-standardized financial statements.
For example, inconsistent treatment of intangible assets can skew valuation metrics. Research shows that firms allocate significantly more purchase price to definite-lived intangible assets when they exclude amortization from non-GAAP earnings.
This accounting discretion complicates the comparison between companies. Furthermore, reliance on analyst expectations introduces another layer of risk. Studies indicate that analyst earnings forecasts achieve only 52.71% accuracy for one-year-ahead predictions. Investors use stock valuation methods and must verify the underlying data sources before accepting the output of any model.
Estimates and Forecasts
The "Estimates" pillar specifically requires verification because it often misleads investors who mistake consensus forecasts for high-probability outcomes. An equity market data provider aggregates these predictions from various sell-side analysts to create a consensus number.
However, these figures frequently reflect optimism rather than reality. Analysts tend to project growth rates that exceed economic feasibility. Analysts' long-term earnings growth estimates are consistently overly optimistic and hover around two times GDP growth levels.
This bias creates a dangerous feedback loop where investors price stocks based on unattainable targets. The market reaction can be severe when companies inevitably miss these inflated expectations. Investors discount estimates appropriately when they understand the methodology behind them. A prudent approach views a forecast as a sentiment indicator rather than a fact, and this requires independent testing.
Data Supply Chain Workflow
Independent testing of data requires an understanding of the complex engineering process that raw financial information undergoes before it reaches a terminal or website. The journey involves multiple stages where errors can occur. Investors appreciate the fragility of the numbers they trust when they understand this workflow. Rigorous custody chains ensure that a trade executed on an exchange eventually appears as a metric in a portfolio analysis.
-
Ingestion: The system collects raw data from stock exchanges, regulatory filings, and news aggregators through high-speed digital pipelines.
-
Validation: Automated algorithms scan incoming information for anomalies. For example, a stock price might drop 90% in one second to indicate a glitch rather than a crash. Poor data quality costs organizations 8-12% of revenue due to the expenses involved in detection and correction.
-
Warehousing: The validated data enters a database that stores it with precise timestamps. These timestamps allow analysts to reconstruct market conditions from the past without future knowledge contaminating the view.
-
Calculation: Engines process the raw numbers to generate derivative metrics, such as P/E ratios or moving averages. This transformation phase converts static figures into the dynamic valuation ranges that fundamental analysis frameworks rely on.
-
Visualization: The final output appears on an equity market data screener. This output presents the processed information in charts and tables for human interpretation.
Investors who grasp these steps understand that the interface they see differs significantly from the provider that sources the material.
Providers versus Platforms
This separation of interface and source means that a sleek mobile application often obscures the actual source of the financial information it displays. Investors frequently confuse the platform and the equity market data provider. The platform serves as the user interface, while the provider supplies the underlying numbers. Many brokerage apps and websites act merely as a facade and display data purchased from third-party aggregators. This distinction matters because a visually appealing app can still rely on low-quality, delayed, or unverified feeds.
The provenance of the data determines its reliability. Provenance refers to the documented history of the data's origin and the changes it underwent before reaching the screen. Without this traceability, an investor cannot know if a P/E ratio excludes a recent one-time charge or if a dividend yield accounts for a scheduled cut. MIT Adjunct Professor Michael Stonebraker emphasizes this point: "Without clean data, or clean enough data, your data science is worthless." Serious analysis requires knowing who actually engineered the numbers because the platform itself often serves just as a messenger.
Equity Market Data Provider Evaluation
Investors look past the messenger to assess the quality of a data provider by checking for specific transparency standards. A reliable provider publishes clear methodology documents that explain how they handle corporate actions, restatements, and currency adjustments. This transparency allows for independent verification of the data's accuracy.
Furthermore, high-quality sources implement strong tracking systems. Research shows that effective data provenance frameworks require unified documentation addressing data authenticity, consent, privacy, and legality. If a provider cannot explain the origin of their historical data or their policy on survivorship bias, the integrity of their feed remains questionable. Technical errors still distort the final analysis even when the provider is reputable.
Technical Pitfalls in Valuation Analysis
Even reputable providers cannot eliminate hidden flaws in the data pipeline that frequently compromise investment theses without the investor ever noticing. These technical errors often stem from how systems handle complex corporate events or cross-border listings.
Equity market data feeds that fail to adjust for these nuances create a distortion in the valuation metrics, and this leads to decisions based on false premises. Constant vigilance regarding these invisible pitfalls protects capital from avoidable mistakes.
-
Currency and ADR Risks: American Depositary Receipts (ADRs) introduce mapping errors when the underlying currency fluctuates violently. Since the US dollar declined significantly against major world currencies in the first half of 2025, unadjusted ADR data can misrepresent the actual operating performance of international companies.
-
Survivorship Bias: Historical datasets often exclude companies that went bankrupt or were delisted. Studies suggest that survivorship bias explains approximately one-third of the measured equity risk premium over the past century, which inflates expected returns.
-
Corporate Action Failures: Missed adjustments for stock splits or spin-offs destroy the accuracy of price charts. These errors break standard stock market value calculation formulas and render historical comparisons useless.
-
Stale Data: An equity market data screener might display "live" prices while showing fundamental ratios based on outdated quarterly filings. This mismatch skews valuation multiples.
One specific bias creates a particularly dangerous illusion for backtesting strategies and historical research.
Survivorship Bias Impact
This specific bias, known as survivorship bias, creates a dangerous optimism in historical backtesting by removing failed companies from the dataset. When a market screener filters for "all stocks," it typically returns only the companies currently listed, and this effectively erases the history of businesses that went bankrupt or were acquired at a loss.
This illusion leads investors to believe that the market is safer and more profitable than it actually is. A Wharton study highlights the severity of this exclusion. The market value of the original 1957 S&P 500 survivors represents only 31% of the 2003 year-end S&P 500 market value. Ignoring the failures distorts the reality of risk.
Data Quality Importance
Investors can counter this distortion because, while markets remain outside control, the quality of information used for analysis remains within reach. We explored how the journey of equity market data affects every decision, from the initial screen to the final valuation. Investors look past the user interfaces of brokerage apps and demand transparency about data provenance and calculation methodologies.
Audits of data sources and an understanding of the supply chain mechanics protect portfolios from preventable errors. Reliable investment analysis depends on clean, accurate inputs. The InvestViable Valuation tool provides rigorous data standards and transparent valuation metrics for research workflows.