Introduction
The market environment of February 2026 presents a distinct split. The Energy and Materials sectors have surged, while the Technology sector lags behind. In such a fragmented landscape, a shares screener serves as a vital tool for long-term investors who seek value, unlike a market scanner that captures short-lived daily price swings. A professional screener acts as a rejection mechanism that filters out thousands of subpar companies and leaves a manageable shortlist of candidates for fundamental research.
This distinct approach changes the screening process from a hunt for quick wins into a disciplined funnel for valuation candidates. For instance, the Energy sector outperformed the S&P 500 with a 23% gain through mid-February 2026. This performance highlights the need for sector-specific filtering. Investors who apply rigorous data standards can isolate these opportunities and avoid the noise of short-term market fluctuations.
Disclaimer: This article provides educational content only and not investment advice. The screening helps prioritize research but it does not select winners.
Essential Data Requirements for Effective Screening
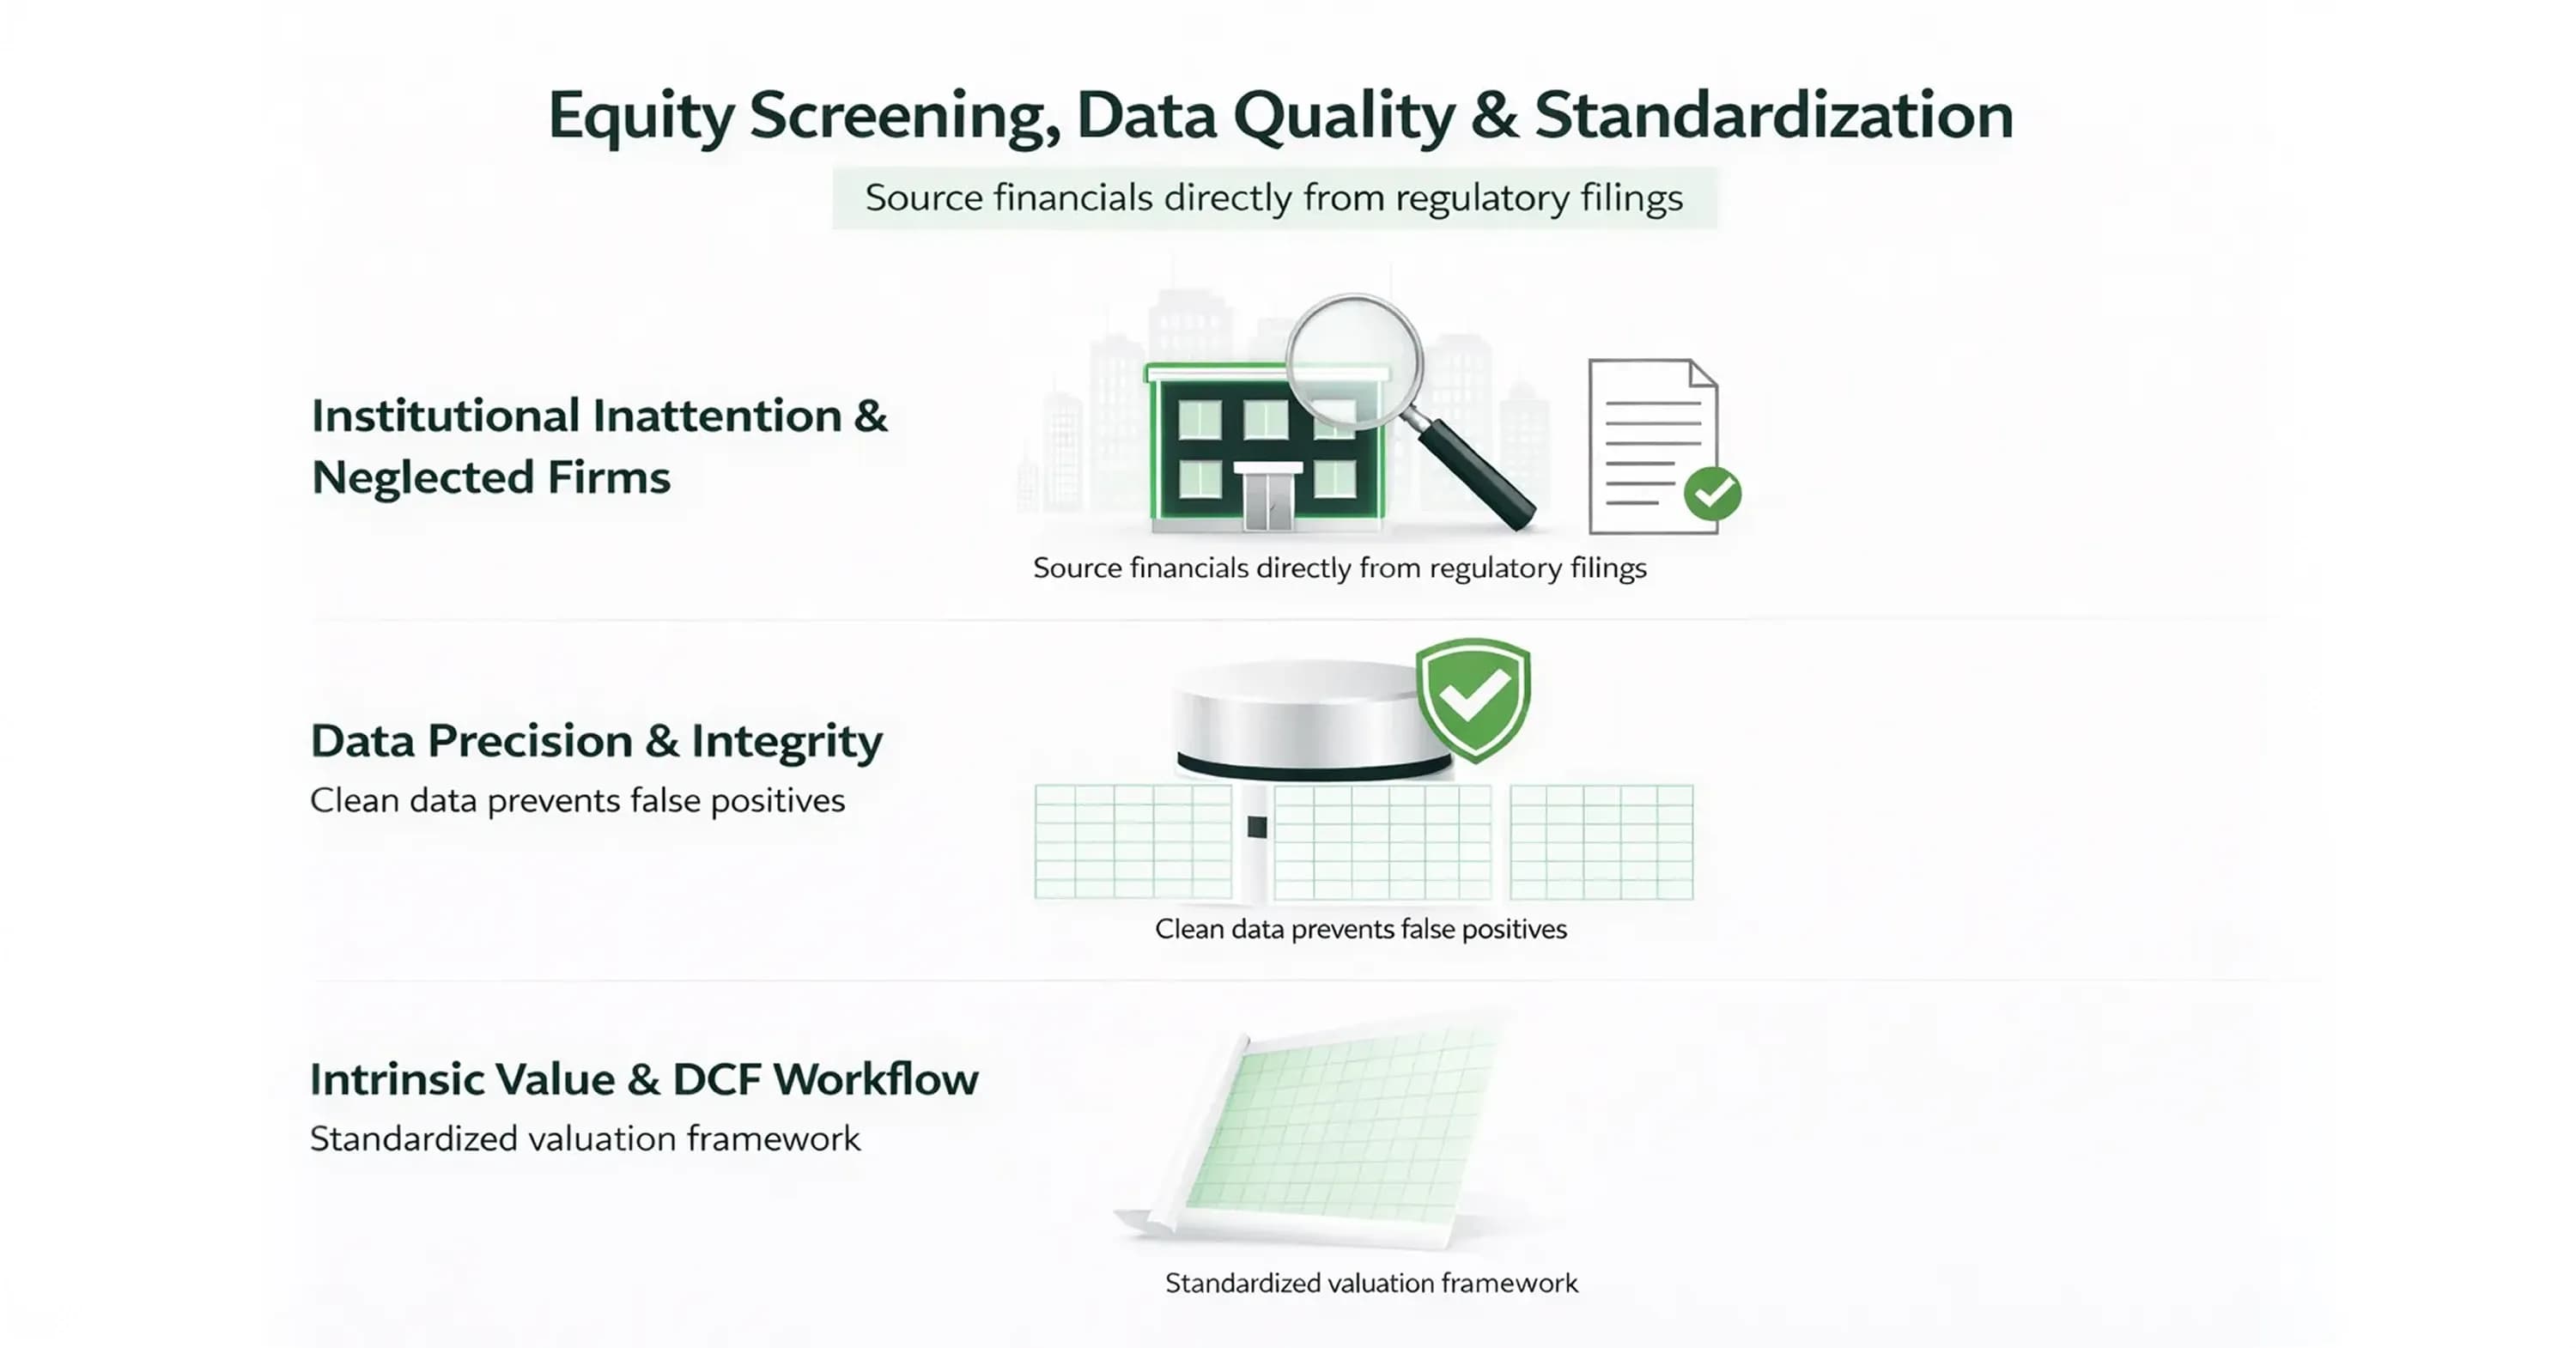
Aswath Damodaran notes that screening identifies neglected firms that markets undervalue due to institutional inattention. These neglected companies often lack analyst coverage, so the data provider must source financials directly from regulatory filings rather than consensus estimates. However, identifying these candidates requires metrics that mean the same thing across different sectors.
Investors who understand stock market value calculation formulas know that unadjusted data leads to flawed intrinsic value estimates. Furthermore, the workflow demands export capabilities. Moving from a name list to a Discounted Cash Flow (DCF) model requires exporting financial statements into Excel or CSV formats to avoid manual entry errors.
Effective application of these rigorous standards relies on data precision and data integrity rather than just the number of available filters. A strong equity screener must prioritize clean, normalized data to prevent false positives from entering the research list. If the underlying financial data contains errors or lags, the resulting shortlist will mislead the investor regardless of the sophistication of the filter criteria.
This data transfer capability lets the analyst shift focus from data gathering to interpretation and ensures that the valuation phase begins with a high-fidelity dataset. Without these foundational data standards, the screening process becomes a source of noise rather than a filter for quality. Data quality provides the foundation, but the screener also needs consistent rules to compare companies effectively.
Standardization in Equity Screener
An effective equity screener relies on standardized metrics to facilitate valid comparisons between companies. For example, comparing a technology firm's Forward Price-to-Earnings (P/E) ratio against an industrial firm's Trailing Twelve Month (TTM) P/E yields a distorted view of relative value. Investors must ensure the tool applies consistent timeframes across the entire dataset to maintain logic.
Corporate actions also demand attention. Stock splits, spin-offs, and special dividends distort historical pricing if the data provider does not adjust previous periods retroactively. Without these adjustments, historical growth rates appear artificially volatile, and valuation ranges and fundamental analysis frameworks break down. This rigorous standardization supports the philosophy that screening acts as a rejection tool and eliminates firms that fail to meet specific business, management, and financial tenets. Adherence to these tenets sets the stage for a structured selection process.
Systematic Shares Screener Workflow
A systematic workflow uses these strict standards to turn a shares screener or stock screener into a candidate funnel. This process removes emotion from selection because it adheres to a strict set of logical steps that progressively narrow the field. Howard Marks famously noted that "everything is good at a price," and this implies that price serves as the primary rejection criterion. Investors can apply this logic through a structured process:
-
Define the Universe: Liquidity filters remove thinly traded stocks that institutions cannot buy, while sector filters isolate current opportunities. For instance, the Energy sector has recently offered a free-cash-flow yield above 7%, compared to the S&P 500's 4%, and this creates a compelling starting point for value filtering.
-
Apply Valuation Metrics: Filters for Enterprise Value to Earnings Before Interest, Taxes, Depreciation, and Amortization (EV/EBITDA) or Price to Free Cash Flow identify companies trading below intrinsic value.
-
Layer Quality Controls: Return on Invested Capital (ROIC) and gross margin stability separate value traps from genuine bargains.
-
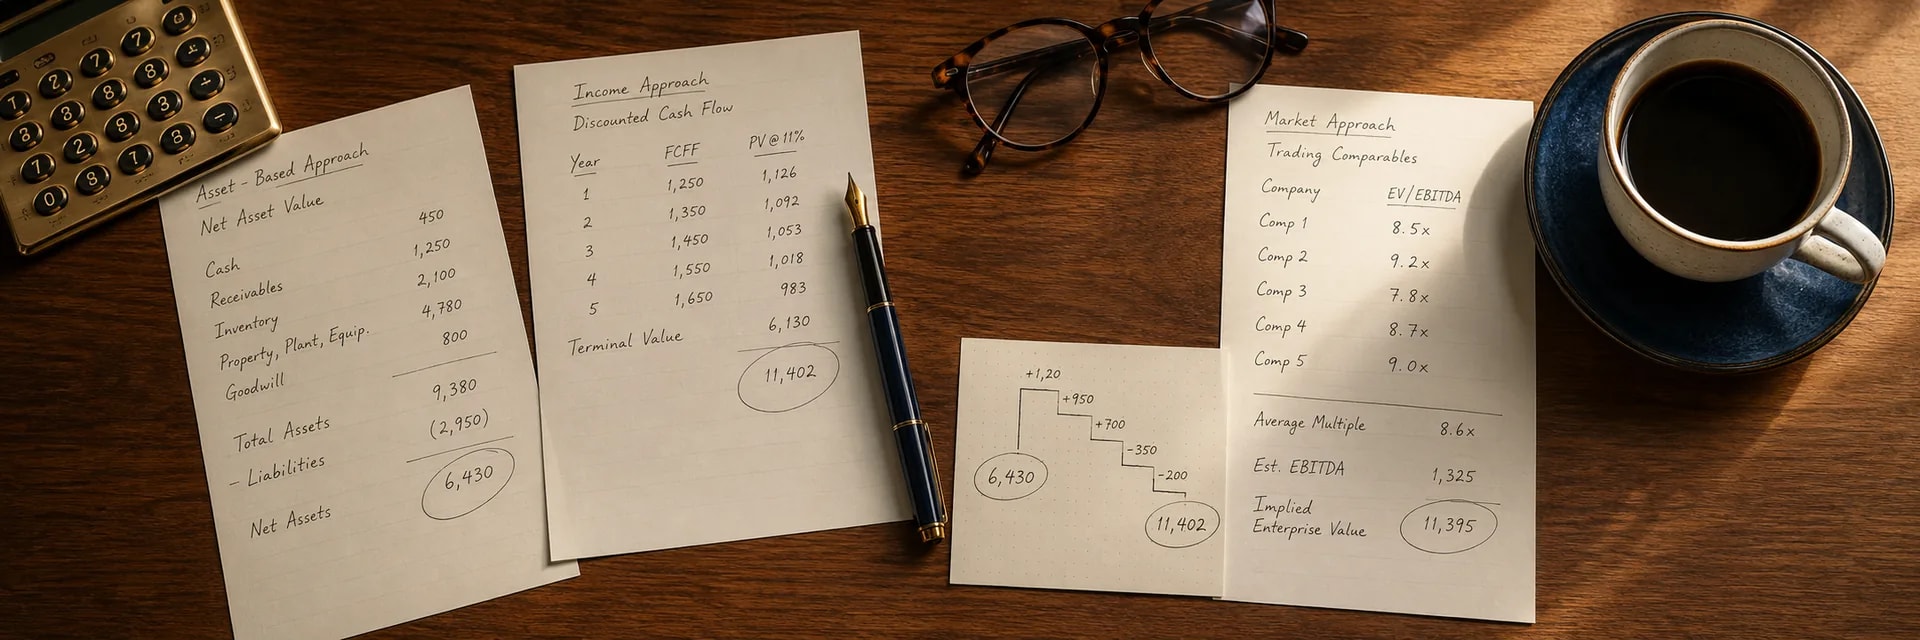
Execute the Hand-off: The final list populates stock valuation methods and moves the process from broad filtering to specific modeling.
This workflow ensures that only candidates with genuine potential reach the labor-intensive modeling phase. This modeling phase requires human oversight because automated tools often miss nuances that a systematic workflow cannot capture.
Critical Pitfalls in Automated Filters
Automated filters offer speed, but they often hide structural risks that a manual review would catch immediately. A shares screener processes data based on rigid rules, which means it cannot distinguish between organic growth and financial engineering.
Stock-based compensation and aggressive capital raising often inflate the share count. This dilution hurts existing shareholders even as headline net income rises. For example, detailed analysis of Tesla's fully diluted EPS revealed a value of $177.83 versus the basic EPS figure. This difference highlights the deceptive impact of significant option dilution. Investors who rely solely on basic metrics in a stock screener risk buying into companies where the per-share value is eroding.
Furthermore, the search for a perfect filter set often leads to over-fitting. A rigorous screening process accepts that no company is flawless. It uses the tool to flag candidates for the fundamental analysis workflow rather than to make final decisions. Relying on an automated output without human verification invites errors, specifically regarding these common technical blind spots:
-
Share Count Dilution: Rising share counts offset net income growth and reduce per-share ownership.
-
Non-Recurring Items: One-time asset sales artificially boost earnings ratios and distort P/E values.
-
Debt Maturity Walls: Screeners often miss upcoming refinancing risks that appear in the footnotes.
-
Survivorship Bias: Historical data excludes failed companies, which leads to overstated hypothetical returns. Research indicates that survivor-only databases cause screening strategies to significantly overstate returns compared to inclusive datasets. This specific distortion requires closer examination.
Survivorship Bias
Survivorship bias represents a statistical anomaly where the equity screener database includes only companies that currently exist. This flaw erases all past failures from the dataset. This omission distorts the investor's perception of risk because the screening universe looks artificially healthy. When a company goes bankrupt or gets delisted due to fraud, data providers often remove its historical metrics from the active screening list.
Consequently, backtests run on these sanitized lists yield results that are not realistic. Evidence supports this danger, as delisted stock returns averaged 9-10 percentage points lower than firms included in standard Compustat data. Prudent investors adjust their expectations downward when reviewing historical screening performance to account for the inevitable value traps that vanished from the record. Recognizing these hidden risks ensures that the screening process remains robust.
Once your screener is set up using the workflow above, see Three value-investing strategy recipes: Deep Value, QARP, Sector Rotation for specific filter configurations that target different value-investing philosophies and the market conditions where each works best.
Conclusion
In summary, a well-constructed shares screener works as an efficient rejection tool that allows investors to say "no" to 99% of the market and focus resources on the 1% of companies that deserve attention. Rather than treating the screening output as a final buy list, the disciplined investor views it as the starting point for a rigorous manual valuation process.
This funnel approach minimizes the risk of falling for value traps and ensures that only candidates with genuine quality and safety margins reach the modeling phase. The InvestViable's Stock Screener is built around this exact philosophy, with a proprietary investment score and base valuations that serve as a natural bridge between initial screening and deeper analysis. The screener is organized into 51 pre-built screens — by sector, by investment style, or by theme — so you can start filtering immediately rather than building criteria from scratch. From there, investors typically take their refined shortlist and validate the findings on the Valuation page.