Role of Stock Analysis in Risk Management
Recent volatility in the software and technology sectors reminds investors that stock prices don't go up in a straight line. Investors who blindly chased momentum recently caught a falling knife, with the software sector suffering its worst day in ten months and the IGV ETF dropping 22% from its highs. While most market participants ask, "How much can I make?" seasoned professionals who survive these downturns start with a different question: "How much can I lose?"
This mindset shift forms the foundation of a Negative Screening Process. This method focuses on systematically eliminating companies with structural flaws instead of hunting for the next big winner. You protect your capital from devastating losses when you filter out businesses that show signs of distress, accounting manipulation, or poor governance. This article provides a repeatable, 5-step checklist that functions as a safety filter. If you apply this rigorous analysis of stocks to your potential investments, you can avoid the value traps that look cheap but are actually on their way to zero. This process starts with the most critical check: the cash.
Disclaimer: This article is for educational purposes only and serves as a methodology guide rather than investment advice or a recommendation of specific securities.
Step 1: Audit Earnings Quality
Smart investors know that profit on paper doesn't always mean money in the bank. Approach every income statement with skepticism because management teams can use accounting tricks to boost net income figures. However, they can't easily fake cash flow. You should verify that the company generates cash from its operations when you perform your analysis of stocks.
A reliable business converts its earnings into cash. Test this by comparing Operating Cash Flow (OCF) to Net Income. Healthy companies, like Apple, show this strength. In 2023, Apple reported an OCF of over $110 billion against a net income of $97 billion. This surplus proves that the business collects revenue.
Be careful when this relationship reverses. You need to calculate the OCF-to-Net Income ratio if a company reports high profits but low cash flow. A ratio below 0.8 warns that the quality of earnings has started to erode. You face a major red flag if that ratio drops below 0.5 or becomes negative. This discrepancy suggests that the company struggles to collect payments from customers or holds too much unsold inventory. Before you proceed to fundamental analysis, disqualify companies failing this basic cash test. Once a company passes the cash test, you must verify its long-term survival prospects.
Step 2: Examine Financial Solvency
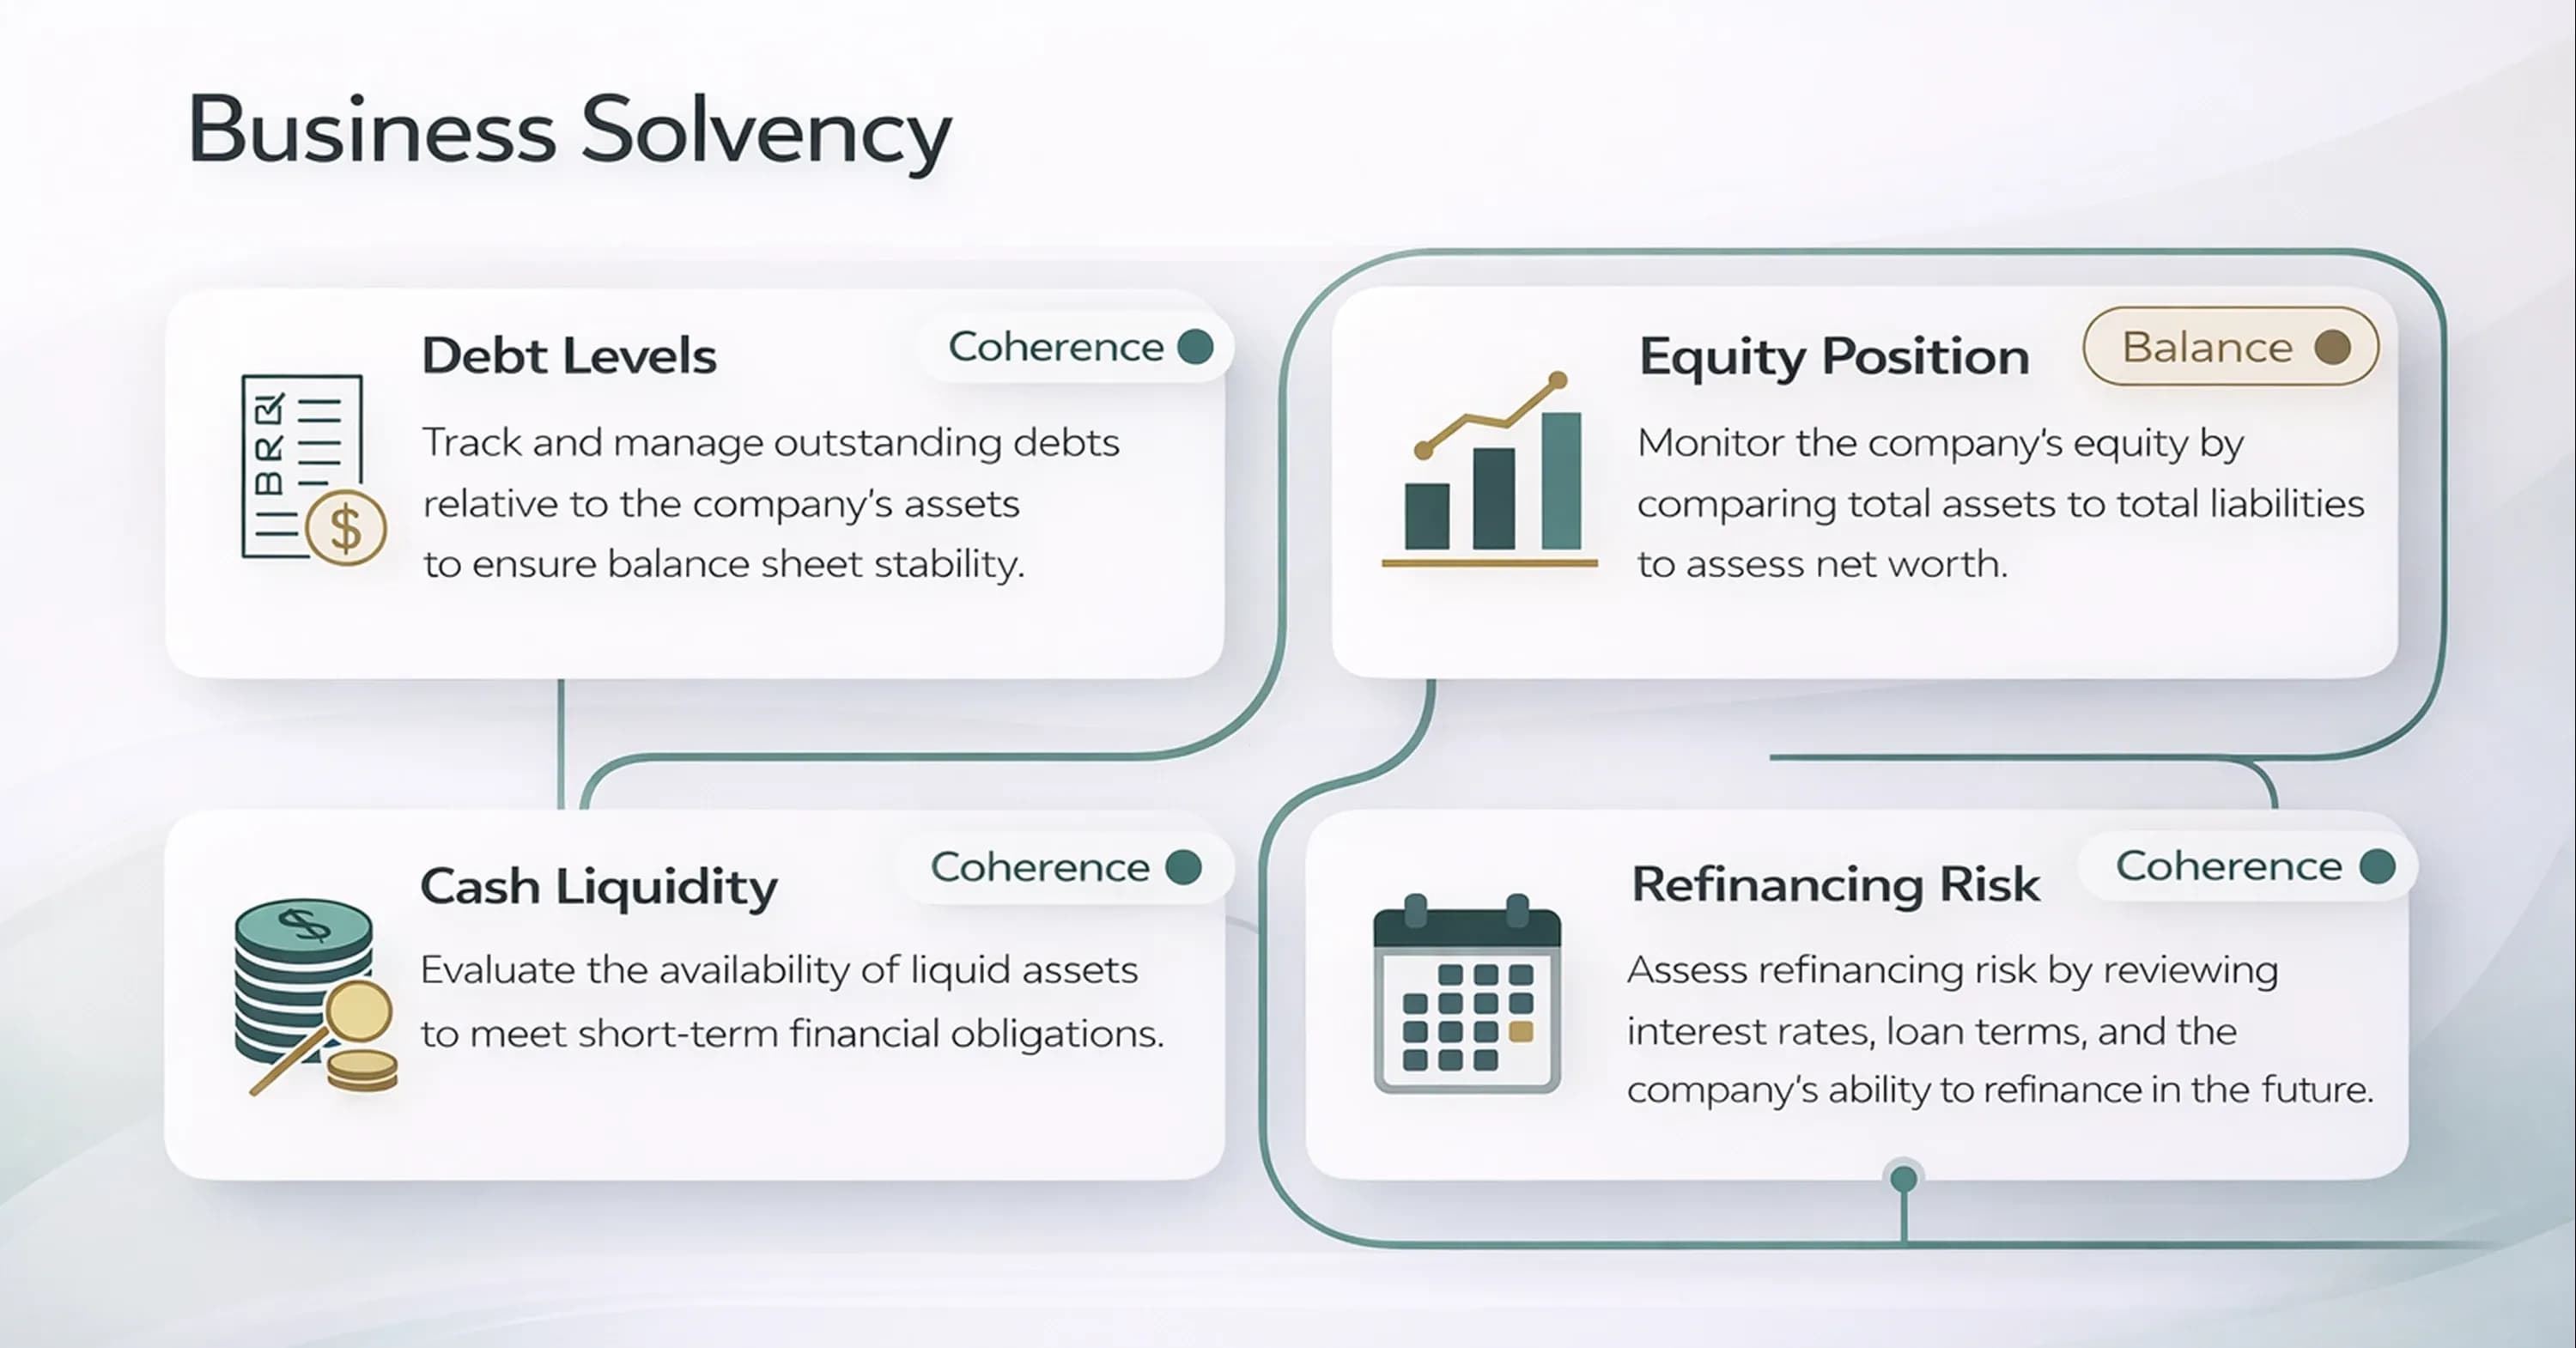
Economic downturns test the durability of a business, and only those with strong balance sheets survive. While the income statement tells you how much a company earned this year, the balance sheet tells you if the company can survive until next year. You must assess the defensibility of a company's financial position by reviewing its debt levels and equity.
Debt restricts a company's options during tough times. Investors watch the debt-to-equity ratio. A ratio exceeding 2.0 signals financial distress for small publicly traded companies. This leverage means creditors own more of the business than shareholders do. Liabilities overwhelm assets in extreme cases. For example, Peloton reported negative shareholder equity of -$347 million and a debt-to-equity ratio of -431.9%. Negative equity means the company owes more than it owns, which creates a high risk of insolvency.
Cash management also drives solvency. Statistics show that 82% of small business failures link to poor cash flow management or a misunderstanding of cash flow. Ensure the company holds enough liquid assets to cover its short-term obligations when you conduct an equity evaluation. Avoid the business if it relies on new debt to pay old debt. Our financial education section offers more on assessing these risks. Solvency guarantees survival, but you also need to trust the people in charge.
Step 3: Evaluate Leadership Integrity
Management teams can pay public relations firms to polish their biographies, but they can't hide their trading activity. You need to verify that leadership maintains alignment with shareholder interests. Analyze whether executives buy or sell their own stock to check this. Historical data supports the value of "skin in the game," as the Inside Ownership 100 Index outperformed the S&P 500 by 3.64% annually over a decade.
Stay vigilant when insiders exit their positions en masse. While executives sell shares for many reasons, a lack of buying warrants caution. For instance, Meta insiders executed 1,440 stock transactions in the first half of 2025, and every transaction was a sale. Similarly, Zoom CEO Eric Yuan sold $214 million worth of shares over two years with negative net insider activity.
Consistent selling suggests that the people who know the company best see better opportunities elsewhere. You should view heavy insider selling as a negative signal that reduces the probability of future returns as part of your probabilistic analysis framework. True leadership integrity means executives stand to lose money if the stock price drops, just like you do. They have little reason to fight for the company's long-term survival if they have already cashed out. Your stock analysis methodology steps must include a review of these insider transaction patterns. While insiders reveal sentiment, the financial statements often hide aggressive tactics.
Step 4: Spot Accounting Red Flags
Financial anomalies often appear in the footnotes long before a stock price collapses. While management teams can smooth earnings to meet quarterly expectations, the relationship between revenue and the balance sheet usually reveals the truth. You must look for any distortion in the financial statements that suggests aggressive accounting practices.
A common warning sign occurs when accounts receivable grow faster than revenue. This trend indicates that the company records sales but fails to collect the cash, or it might be stuffing distribution channels to hit targets. The quality of revenue becomes questionable when receivables grow faster than revenue, and this often precedes a write-down.
You can also apply the Beneish M-Score to detect statistical probabilities of fraud during your equity evaluation. This mathematical model uses eight ratios to identify earnings manipulation. A score above -1.78 indicates a high probability of earnings manipulation, while a score above -2.22 suggests likely manipulation. Investors who ignore these metrics face disastrous results.
For instance, Super Micro Computer stock declined more than 70% after its audit firm resigned over revenue recognition issues. Our automated due diligence check, the investment score, helps you understand company’s strengths and weaknesses. You must assess the company's competitive position after verifying the accounting numbers. Verified numbers only matter if the business possesses a defense against competition.
Step 5: Assess the Economic Moat
Strong gross margins prove that a company possesses a durable economic moat. A business must either lower prices or spend on sales to maintain its market share when it faces intense competition. This dynamic leads to margin erosion, which signals that the company’s products have become commodities.
You can see this deterioration in the software sector, where AI disruption now threatens traditional business models. Recent data shows that enterprise software faces margin compression as customers consolidate tools and AI competitors emerge. While the median SaaS company reports gross margins of 76%, the operating margins sit at just 1% because the cost to acquire and keep customers is too high. This gap proves that these companies burn cash just to stay relevant.
Examples illustrate how quickly a moat can vanish. Varonis, a data security company, saw its operating margin decline to 2.6% from 9.7% in just one year. This drop suggests that the company lost pricing power or faced higher costs to deliver its service. Your analysis of stocks must identify these trends early. You will avoid companies that are fighting a losing battle for profit if you include gross margin review in your stock analysis methodology steps.
Conclusion
The rigor of safety checks defines the difference between a lucky gambler and a successful investor. Applying this 5-step checklist transforms your portfolio management from a game of chance into a disciplined practice of risk elimination. Treat this list as a strict "Go/No-Go" decision matrix. You must disqualify a company immediately if it fails to convert earnings into cash, drowns in debt, shows signs of insider distrust, displays accounting anomalies, or suffers from margin erosion.
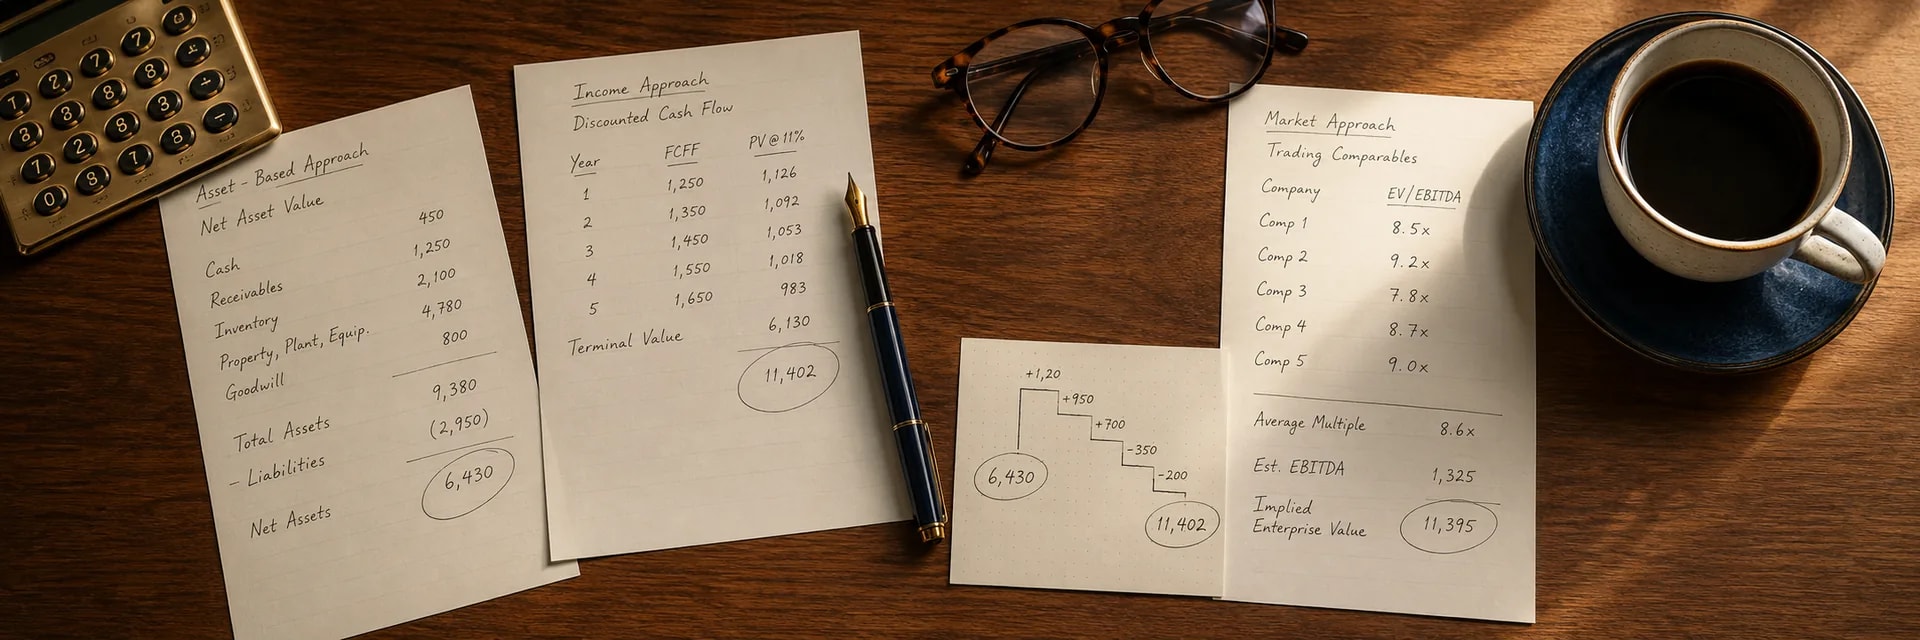
Sustainable wealth creation requires prioritizing the safety of your principal above the excitement of potential gains. A boring safety check is the foundation of an exciting portfolio because it ensures that you only bet on companies with structural integrity. Once a stock passes this gauntlet, it earns the right to a deeper valuation analysis where you can determine its fair price.
Our valuation tool helps you understand company value, set your own price targets with a margin of safety, and create valuation reports to share with other investors. We encourage you to pick one stock in your current portfolio today and run it through this analysis to see if it deserves your capital. 19:T