
InvestViable does not publish buy or sell recommendations on individual securities. All analysis is based on public financial data and a transparent methodology. The Investment Score formula is proprietary; the inputs and what the score evaluates are documented.
Why the same ticker gets different intrinsic values across platforms
The discounting math is mechanical. Discount future free cash flows by the cost of capital, add a terminal value, subtract net debt, divide by shares outstanding. Every platform handles the arithmetic the same way, whether the platform is a retail aggregator, a sell-side spreadsheet, or an institutional terminal.
The variance across platforms looking at the same company comes from upstream choices made when the platform pulled data from its sources. Different time-period bases of the fundamentals produce different denominators for any per-share metric. Different share-count definitions produce different denominators for any per-share metric. Different GAAP-versus-adjusted treatments produce different margin assumptions. Different point-in-time conventions produce different snapshots of the same balance sheet.
Most retail-facing data aggregators pull from a combination of regulatory filings, vendor feeds, and proprietary adjustments before publishing their per-share intrinsic value figures. Each platform makes different normalization choices upstream of the math. None of these choices is wrong in the abstract, but they are not the same. A per-share intrinsic value computed on one set of inputs cannot be directly compared to a per-share intrinsic value computed on another.
The audit framework that follows assumes the math is fine. It targets the six input categories where data normalization choices and accounting-treatment choices accumulate into the visible divergence. The structure parallels the DCF inputs checklist one pillar over: where that article audits the assumptions a DCF model makes, this one audits the data the platform fed the model in the first place. It also sits laterally to the single-platform fundamentals audit that runs upstream of cross-platform reconciliation: that checklist verifies a single set of fundamentals against the primary filings; this one reconciles the divergence between two or more platforms once the within-platform audit is clean. Together they form the two halves of any stock market database audit workflow.
The six-category platform-data audit
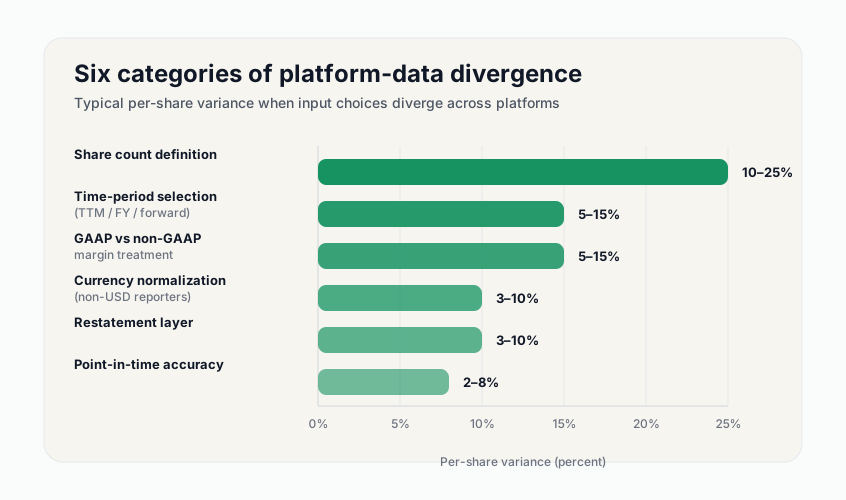
The six categories below cover the inputs where platform divergence actually accumulates. They are ordered roughly by how much they typically move the per-share intrinsic value: share count is the largest direct contributor because it sits at the bottom of every per-share calculation; time-period selection of the fundamentals compounds through any forecast; GAAP-versus-adjusted treatment of margins changes the cash-flow base; currency normalization affects non-USD reporters disproportionately; restatement layer changes the historical record the model trained on; point-in-time accuracy determines whether the data the platform shows is what the market actually knew at the time.
For each category, the verification questions follow the same pattern: where does the platform get this input, what assumption is implicit in the platform's choice, how does that choice compare to a defensible benchmark, and what error mode emerges when the choice diverges from yours. The audit answers the question of why valuations differ across platforms by surfacing the specific upstream choice that produced each piece of the gap.
The audit applies even when an investor uses only one platform. Verifying a single intrinsic-value figure against its documented inputs is the same exercise as reconciling two platforms against each other. The second platform just makes any input choice visible that the first platform did not surface. The benefit of running the six checks across multiple sources is that the divergence between them often pinpoints the specific input where the platforms' methodologies diverged most from the analyst's own model. The reconciliation outputs a defensible range, not a single number to trust or argue with.
Figure 1. Six categories of platform-data divergence and their typical impact on per-share intrinsic value
Approximate range of per-share variance produced by each input category when one platform's choice diverges from another's, for a representative mid-cap issuer; Currency band applies to non-USD reporters.
Share count definition: the single largest source of per-share divergence
Share count sits at the bottom of every per-share calculation, so any difference in how a platform defines the denominator flows directly into the visible output. Five share-count definitions are in active use across data platforms, and platforms do not consistently disclose which one they apply:
- Basic shares outstanding. Period-end count of currently-issued common stock, as reported on the cover page of the most recent 10-Q on SEC EDGAR. Used by most quick-view valuation surfaces. Understates the equity claim being valued because it ignores in-the-money options and restricted stock units that will dilute current shareholders.
- Diluted shares (treasury-stock method). Basic plus the additional shares that would be created if all in-the-money options and RSUs were exercised, with proceeds assumed to repurchase common stock at the average market price. This is the SEC convention for the EPS denominator. Most institutional models default to this.
- As-converted diluted shares. Diluted shares plus any shares that would be created on conversion of convertible debt and preferred stock. Relevant for issuers with material convertible capital structures.
- Weighted-average diluted shares. Used for trailing-twelve-month EPS by GAAP convention. Different from period-end diluted shares for fast-growing or buyback-heavy issuers. Some platforms substitute it for period-end diluted shares in their per-share metrics; others do not.
- SBC-adjusted shares. Forward-looking projection that adds annual stock-based compensation dilution to the diluted count for each year of the forecast period. Used by analysts who want to treat SBC as a real cash cost over the explicit period rather than as a one-time accounting item. This is the treatment Aswath Damodaran's published valuation work advocates for SBC-heavy issuers. This produces the most conservative per-share intrinsic value and the largest divergence from the basic-shares platforms.
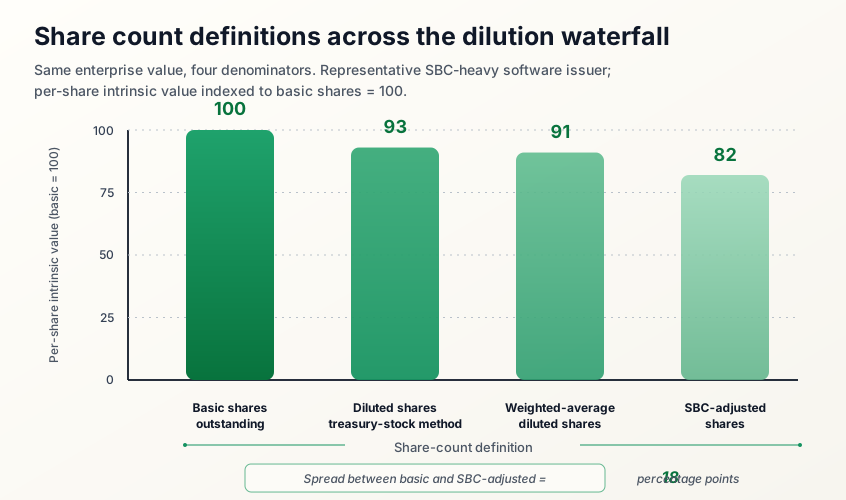
A platform that uses basic shares and a platform that uses SBC-adjusted shares can compute identical enterprise values and show ten to twenty-five percent different per-share intrinsic values for a stock-based-compensation-heavy issuer. For Meta Platforms (META), where stock-based compensation runs at approximately twelve percent of revenue, this divergence shows up directly in any per-share metric a platform publishes; the same enterprise value divided by the basic share count and the SBC-adjusted share count produces materially different per-share intrinsic values for the same valuation thesis. The share count definition the platform applies is rarely stated on the per-share output. The audit question: where does this platform pull share count from, and at what point in the dilution waterfall does it stop.
Figure 2. How share count definitions diverge across the dilution waterfall
Approximate per-share intrinsic value impact for a representative SBC-heavy software issuer, holding enterprise value constant. Each bar shows the per-share figure produced by a different share-count definition applied to the same underlying valuation.
Data normalization: trailing-twelve-month, fiscal year, or forward
The time-period base of the fundamentals is the second-largest source of platform divergence. Three normalization choices are common, and the same ticker on the same day can show three different "current" revenue numbers depending on which one a platform applied:
- Trailing-twelve-month (TTM). The most recent four quarters of reported financials, rolling. Captures the most recent operating reality, including the latest quarter. Updated whenever a new 10-Q lands. Standard for valuation work that takes the present as the starting point.
- Latest fiscal year (LFY). The most recent 10-K data, fixed for the year. Auditable and consistent across companies with different fiscal calendars, but can lag the operating reality by up to twelve months for companies that report on a calendar-year basis.
- Forward consensus (FY+1, FY+2, FY+3). Sell-side analyst expectations for future periods, aggregated. Quality varies; coverage is uneven for smaller issuers. Some platforms use forward TTM as the denominator for forward P/E and forward EV/EBITDA. The same ratio name can refer to different periods on different platforms.
Beyond the time-period selection, two additional normalizations matter:
- Currency translation. Issuers reporting in non-USD currencies (most non-U.S. companies) are translated to USD by retail-facing aggregators for cross-comparability. The translation method matters: spot-rate translation at each reporting date, average-rate translation over the period, or constant-currency restatement. For an issuer with a fiscal year that crossed a 15 percent currency move, the choice of translation method changes reported growth rates by single-digit percentages. To verify, pull the original reporting currency from the company's filings on the home-country regulator (or the SEC EDGAR 20-F for foreign private issuers) and reconcile to the platform's USD-translated figure.
- Calendar alignment. Comparing two issuers with different fiscal-year-ends requires the platform to align both to a common reporting period. Some platforms align to the calendar year; others align to the most recent quarterly period each issuer has reported. Cross-company multiples computed on different alignment conventions are not directly comparable; the CFA Institute Research Foundation publishes valuation research covering this comparability discipline in detail.
The verification question for each normalization category: which choice did the platform apply, and is it consistent with the choice your own model used.
GAAP versus non-GAAP and the "adjusted" trap
U.S.-listed companies report two parallel versions of their income statement: the audited GAAP version filed with the SEC, and a management-defined "non-GAAP" or "adjusted" version often emphasized in earnings releases and investor presentations. The non-GAAP version typically excludes stock-based compensation, restructuring charges, amortization of acquired intangibles, impairments, and items management classifies as "one-time." SEC Regulation G governs how non-GAAP measures must be disclosed and reconciled, but it does not constrain which items management chooses to exclude.
Different platforms make different choices about which version to surface:
- Some platforms display the GAAP operating margin as the headline metric and provide non-GAAP only on drill-down.
- Some platforms display the company's preferred "adjusted" margin as the headline and bury GAAP in a footnote.
- Some platforms compute a proprietary "normalized" margin that strips out items the platform's methodology classifies as one-time, which can differ from both the GAAP and the management-adjusted versions.
For an issuer where SBC runs at fifteen percent of revenue and restructuring is a recurring annual item, the GAAP operating margin and the management-adjusted operating margin can differ by ten to twenty percentage points. Any downstream margin-based valuation inherits the choice the platform made, including DCF terminal margins, EV/EBITDA multiples, and operating-margin peer comparisons.
The "adjusted" trap is the assumption that the management-defined version is the true operating reality. It is not necessarily so. Stock-based compensation is a real cost. Restructuring that happens every year is operating expense, not a one-time item. Amortization of acquired intangibles reflects capital already spent. A platform that surfaces only the adjusted version has implicitly endorsed management's classification choices.
The audit question: which version of the margins did the platform use, and does that match the version your own model treats as the operating base.
Point-in-time accuracy and restatement layering
Historical financial data is not as fixed as it looks. Companies routinely restate prior-period financials when material errors are identified or when accounting standards change. FASB ASC 250 governs the accounting treatment for changes in estimate, changes in principle, and corrections of errors, with the PCAOB's auditor consistency standard covering the auditor's parallel obligation when those changes flow through to restated financial statements. The SEC keeps the original filings on EDGAR; restatements appear as amended filings (10-K/A, 10-Q/A). The question for any data platform is whether the historical record it serves is the original filing or the restated version.
Two layering conventions are in active use:
- Original-as-reported. The platform preserves the figures as they appeared in the original filing on the date that filing was made public. This is the point-in-time-accurate record: what the market actually knew at that date.
- Restated. The platform overwrites the original figures with the restated version, so historical periods reflect current accounting and any correction. This is the analytically-consistent record: historical periods are computed on a basis comparable to current periods.
For backtests and historical performance studies, the original-as-reported convention is the only defensible choice. Using restated data introduces look-ahead bias because the model "knew" the corrected numbers before the market did. For current intrinsic-value modeling, the restated convention is usually preferable because forward forecasts should be built on the most accurate available base. Platforms vary in which they serve; some serve original-as-reported in the historical archive but switch to restated after a one-year window; others always serve restated.
A related concern is backfilled fundamental data. Fundamentals are often released with a one-to-six week delay between quarter-end and the 10-Q filing, then revised over time as adjustments and audit corrections accumulate. Platforms that backfill the most-recent-available figure into the original quarter-end date overstate the data quality available at that date. The audit question: at what time was each historical data point first available to the public, and does the platform mark or surface that lag.
How to apply this audit on any platform's number
The audit overlay works the same way whether the platform under review is a retail-facing aggregator, a sell-side spreadsheet, or an institutional terminal output.
The reconciliation workflow is six steps:
- Pull the platform's per-share intrinsic value figure. Note any methodology disclosure the platform offers. Most platforms surface partial methodology in a footnote, an "About" page, or a help-center article.
- Identify the share count. Look for explicit disclosure ("diluted weighted-average," "fully diluted including SBC dilution"). If absent, infer from the divisor: divide the platform's enterprise value by its per-share number to recover the share count, then compare to the 10-Q diluted figure.
- Identify the time-period base. Determine whether the fundamentals are trailing-twelve-month, latest fiscal year, or forward. Cross-check the revenue and margin figures against the most recent 10-Q on EDGAR.
- Spot-check GAAP versus adjusted. Compare the platform's operating margin to the GAAP operating margin from the latest 10-Q. A material difference indicates the platform is using a non-GAAP or proprietary version.
- Verify restatement layer. For any historical period that matters to the analysis, compare the platform's figure to the figure in the original 10-K or 10-Q. A mismatch indicates the platform is serving restated data.
- Confirm currency basis. For non-USD reporters, verify whether the platform's figures are in reported currency or USD-translated, and at what rate.
The output of the audit is rarely a different intrinsic-value number. It is a documented reconciliation showing which inputs the platform used and where they diverged from yours. Most platform-valuation differences resolve to one or two specific input choices, typically share count and the GAAP-versus-non-GAAP margin treatment. Once the reconciliation is in hand, the platform's output becomes a defensible data point in a range rather than a number to argue with.
For investors who want a reference model to anchor the reconciliation against, the Valuator on Invest Viable surfaces the core model inputs (cash flow growth path, discount rate, and terminal growth rate) the user can override against the audit conclusions. An intrinsic-value figure that hides its inputs is not auditable; an audit overlay that reconciles to documented inputs is.
The discipline this article describes sits upstream of the DCF inputs checklist, which audits the assumptions a DCF model makes once the inputs are chosen. The data audit sits at the source; the DCF audit sits at the model. Both feed into the margin of safety discipline that translates intrinsic value into a maximum-acceptable price. A point-estimate intrinsic value from a platform whose inputs you have not reconciled is the artifact of a black box. A range of intrinsic values from platforms whose inputs you have audited and reconciled is the artifact of a discipline.