
Introduction
Many investors mistakenly believe that all financial data is created equal and assume that the price on a brokerage app suffices for deep analysis. However, a live quote service designed for trade execution differs fundamentally from a structured stock market database built for investment research. Confusing the two causes flawed investment theses because quote services often lack the historical adjustments and corporate action data to reconstruct accurate past performance.
Real-time feeds excel at showing the current price, but they often fail to explain how that price relates to the company's history after stock splits, spin-offs, or dividends. Financial market data serves as the backbone of quantitative finance, and using a fragile backbone for valuation models invites structural failure. Investors who rely on ephemeral snapshots rather than rigorous databases risk building an entire portfolio on numbers that do not reflect economic reality.
Disclaimer: The information presented in this article is intended solely for educational purposes related to data infrastructure concepts and should not be construed as investment advice or a recommendation.
Fundamental Distinction: Snapshots vs. History
Structural differences in data infrastructure separate quick execution from deep analysis. Live quote services prioritize speed and current price, while a global equity data repository prioritizes historical accuracy and consistency. Traders use live feeds to execute orders immediately, but value investors require a stable foundation to model future growth. A live feed deletes the past as soon as the price changes, whereas a research database preserves the context of every trade.
Reliance on a live feed for valuation or backtesting creates structural errors in the analysis. For example, a live feed might show a stock price drop of 50%, but a historical database identifies this as a 2-for-1 stock split rather than a loss of value. Research from Crown University confirms that if the data is incomplete, inaccurate, or biased, the models produce unreliable predictions.
These discrepancies compound over time and destroy the integrity of investment models. A study on data quality found that differences between monthly and daily returns compounded to 0.43% per month or roughly 6% per year. Such errors render long-term compounding calculations useless. Investors who build a reliable fundamental analysis intrinsic stock value workflow rely on databases that reconstruct history rather than databases that just report the current moment.
Six Core Data Domains of Stock Market Database
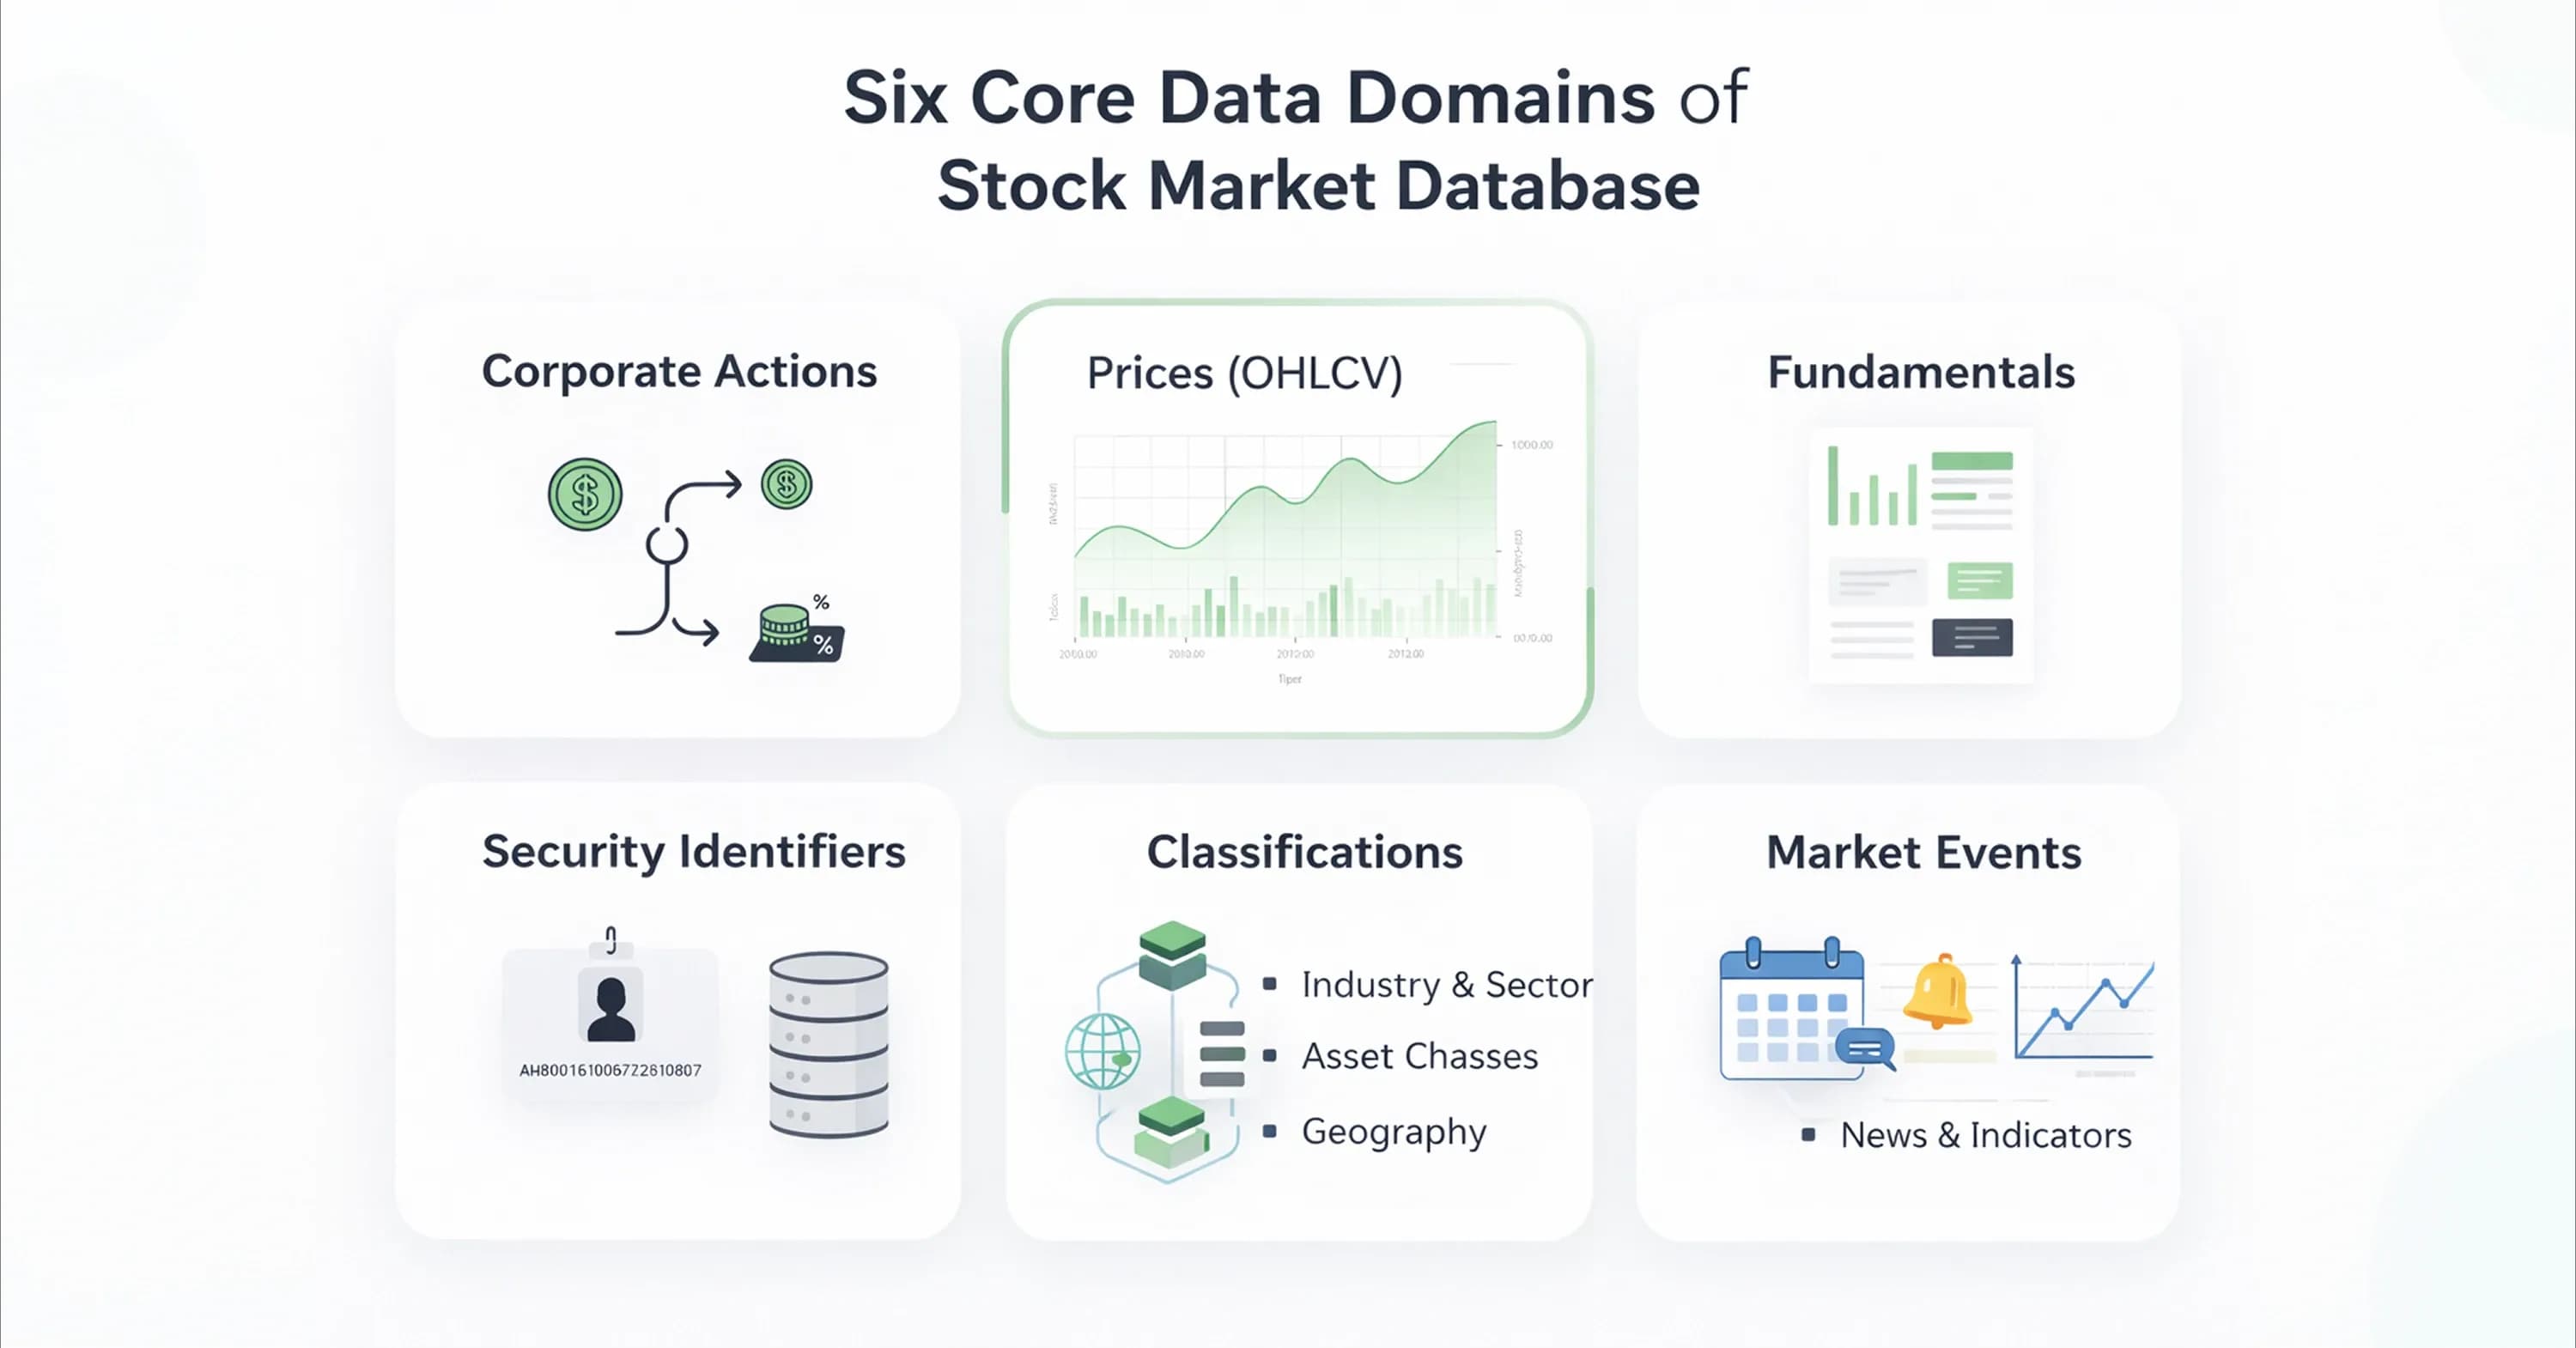
Databases that reconstruct history require more than just a stream of price numbers. A complete stock market database integrates six distinct data domains to create a thorough picture of a company's economic reality. If a valuation model lacks any one of these domains, it becomes vulnerable to blind spots.
The following components form the architecture of professional-grade data:
-
Prices (OHLCV): Open, High, Low, Close, and Volume data provide the raw inputs for technical analysis and liquidity assessment.
-
Fundamentals: Income statements and balance sheets offer the financial health metrics required for stock valuation methods and other intrinsic value calculations.
-
Corporate Actions: Splits, dividends, and spin-offs allow the system to adjust historical prices for continuity.
-
Security Identifiers: Tickers change, but permanent identifiers map the correct data to the correct company over decades.
-
Classifications: Sector and industry codes allow for peer comparison and risk management.
-
Currencies: Exchange rates enable the standardization of financials for multinational companies.
Data errors in these domains are common and costly. Research shows that more than 36% of industry classifications disagree between major providers at the two-digit level. Furthermore, complex corporate actions require precision.
For instance, complex spin-offs require careful treatment that includes price adjustments and dividend reconciliation. Without these integrated layers, an investor cannot accurately assess a company's past performance or future potential.
Hidden Hazards in Data Quality
Even with these integrated layers, data often contains invisible traps that mislead researchers. Investors often assume that historical data represents an unchangeable record of the past, but this assumption is an illusion. Specific data hazards, such as survivorship bias and look-ahead bias, silently inflate performance metrics and lead to dangerous overconfidence. Investors must understand these risks when they learn how to build stock market database architectures for personal research.
Survivorship bias occurs when a dataset excludes companies that have gone bankrupt or delisted. This exclusion leaves only the successful companies in the history and makes historical returns look much better than they actually were. Studies indicate that survivor-only backtesting artificially inflates annual returns by nearly 5 percentage points.
Look-ahead bias presents another significant risk. This error happens when a model uses information that was not actually available at the time of the prediction. For example, a model might assume an investor knew the Q4 earnings report on January 1st, even though the company released the report on January 15th. Research confirms that look-ahead bias occurs when models access future information and create artificially inflated results. Investors avoid these traps when they use a analysis of stocks safety checklist value traps and rigorous data validation.
Invisible Cost of Survivorship Bias
Rigorous data validation must account for companies that disappear from the market. Survivorship bias creates a systematic distortion in investment research because it erases failure from the record. When a company goes bankrupt, its final stock price often drops to near zero. If a data provider simply removes the stock from the database without recording that final loss, the dataset effectively "forgets" the bad investment. A reliable global equity data repository must retain these delisted securities to provide an honest view of market risks.
Academic researchers have long struggled with this issue. Early studies found that major files missed thousands of delisting returns and introduced systematic errors into financial studies. Further analysis shows that omitted delisting returns make it impossible to calculate accurate returns for a feasible portfolio. Investors who test strategies on sanitized datasets often face disappointing results in the real world.
Adjustment Logic Trap
Disappointing results also stem from mathematical errors in price history. Comparing the raw price of a stock today to its raw price ten years ago provides little value due to stock splits and dividend payments. Databases use adjustment factors to normalize these prices, but this mathematical process requires constant vigilance. A single incorrect date or ratio can ruin an entire dataset.
Even professional datasets contain these benign errors. An audit of a major database revealed incorrect stock split dates and coding differences that can reverse research conclusions. Specifically, researchers found 91 coding differences regarding stock splits in a widely used dataset. If a database fails to account for a 2-for-1 split correctly, the system interprets the adjustment as a 50% market crash and triggers false sell signals in an automated valuation model.
Architecture as Trust Signal
Automated valuation models require a rigorous data pipeline to prevent these false signals. Engineers describe the rigorous process of transforming raw market feeds into a reliable stock market database as the Bronze, Silver, and Gold data pipeline.
Raw data arrives in the Bronze layer, where it often contains errors, duplicate entries, and formatting inconsistencies. The system processes this information into the Silver layer, and algorithms clean, deduplicate, and normalize the records. The Gold layer aggregates this refined data into analytics-ready formats for complex modeling, such as a stock market valuation probabilistic analysis framework that demands high-precision inputs.
This architectural separation ensures that the data for decision-making remains distinct from the chaotic stream of live quotes. Organizational structure plays a vital role alongside technical structure. Professional standards dictate that data providers must separate critical functions from front-office operations to prevent conflicts of interest. This separation protects the integrity of the historical record from the immediate pressures of trading desks.
A strong system adheres to strict governance protocols to maintain an unalterable history. Regulatory bodies like FINRA mandate that firms preserve electronic records exclusively in a non-rewriteable, non-erasable format to verify accuracy. These audit trails ensure that investors can trust the data to remain static and truthful regardless of market volatility.
Standardization Protocols
Trustworthy data must also connect across different periods and systems. Data silos occur when disconnected information makes holistic analysis impossible. Standardization protocols prevent this issue. Investors who learn how to build stock market database architectures realize that linking price data with fundamental data requires rigorous mapping. For instance, a company might change its name or ticker symbol, but the database must link all historical records to a unique, permanent identifier to maintain continuity.
Standardization also applies to fiscal periods. Companies report earnings on different schedules, so the system must align these reports to a standard calendar for accurate comparison. This consistency enables valid research. Industry guidelines emphasize that data quality assurance requires consistency across market conditions because methodologies must remain unbiased even during periods of low trading volume or market stress.
Investor Audit Checklist
Investors can identify unbiased methodologies by examining specific structural features. High-quality platforms offer transparent methodologies, while lower-quality services often hide the source and timing of their data.
The following checklist identifies critical signals of data integrity:
-
Point-in-Time Accuracy: Reliable databases record exactly when a data point became available to the public. Research shows that companies report fundamental data with delays and often backfill it later. Updating historical records without noting the original publication date creates look-ahead bias.
-
Restatement Handling: Companies frequently correct past financial statements. A trustworthy database keeps the original record and adds the restatement as a new entry. This practice allows investors to see what the market actually knew at the time rather than a sanitized version of history.
-
Source Transparency: Professional providers list the specific exchange or regulatory filing where the data originated. An absence of source attribution often indicates that the provider scrapes data from unreliable third parties.
-
Backfill Management: Systems must account for late-arriving data. Because data vendors often backfill fundamental data upon availability, the database design must explicitly handle these delayed updates to prevent false signals in backtesting models.
Conclusion
Preventing false signals ultimately protects the entire investment thesis. Data quality represents a fundamental investment risk that impacts research reliability, and it is more than a technical concern for IT departments. Governance and transparency suffer when data providers function merely as utilities.
Investment analysis requires the same rigor from a stock market database as it does from financial modeling. Source validation, bias checks, and historical adjustments help protect capital from avoidable errors. InvestViable provides access to professional valuation tools that establish a trustworthy foundation for analysis.