Introduction
Every day, ticker tapes flash red and green across screens worldwide. This constant movement can feel chaotic. It triggers an emotional response that urges you to act quickly before you miss out or lose everything.
However, the most successful investors know a secret. They understand that the number flashing on the screen often has little to do with the actual worth of the business behind it. Learning to distinguish between the noise of the market and the quiet accumulation of value is the single most important skill for long-term wealth.
Disclaimer: This article is for educational purposes only and does not constitute investment advice. Financial decisions should be based on your specific situation and research.
1. Definitions: Stock Market Price vs. Intrinsic Value
The first step in gaining discipline is defining your terms. Most confusion in finance comes from mixing up what you pay with what you get. Price and value are not synonyms. They are often opposites.
Stock market price is simply an auction result. It is the specific dollar amount that a buyer and a seller agreed upon for a single transaction at a specific moment. It fluctuates based on supply, demand, news, and mood.
Intrinsic value, on the other hand, is a calculation. It represents the present value of all the cash that a business will generate for its owners in the future. It is not a fixed number like a price tag. It is an estimate based on business fundamentals like revenue, margins, and debt.
Here is the key distinction you must internalize:
-
Price is arbitrary and volatile. It screams for attention.
-
Value is fundamental and slow-moving. It whispers.
When price drops below value, you have a margin of safety. This is the core concept of value investing. You want to buy a dollar’s worth of assets for fifty cents. If you only look at the price, you will never see the opportunity. You will only see a dropping line on a chart.
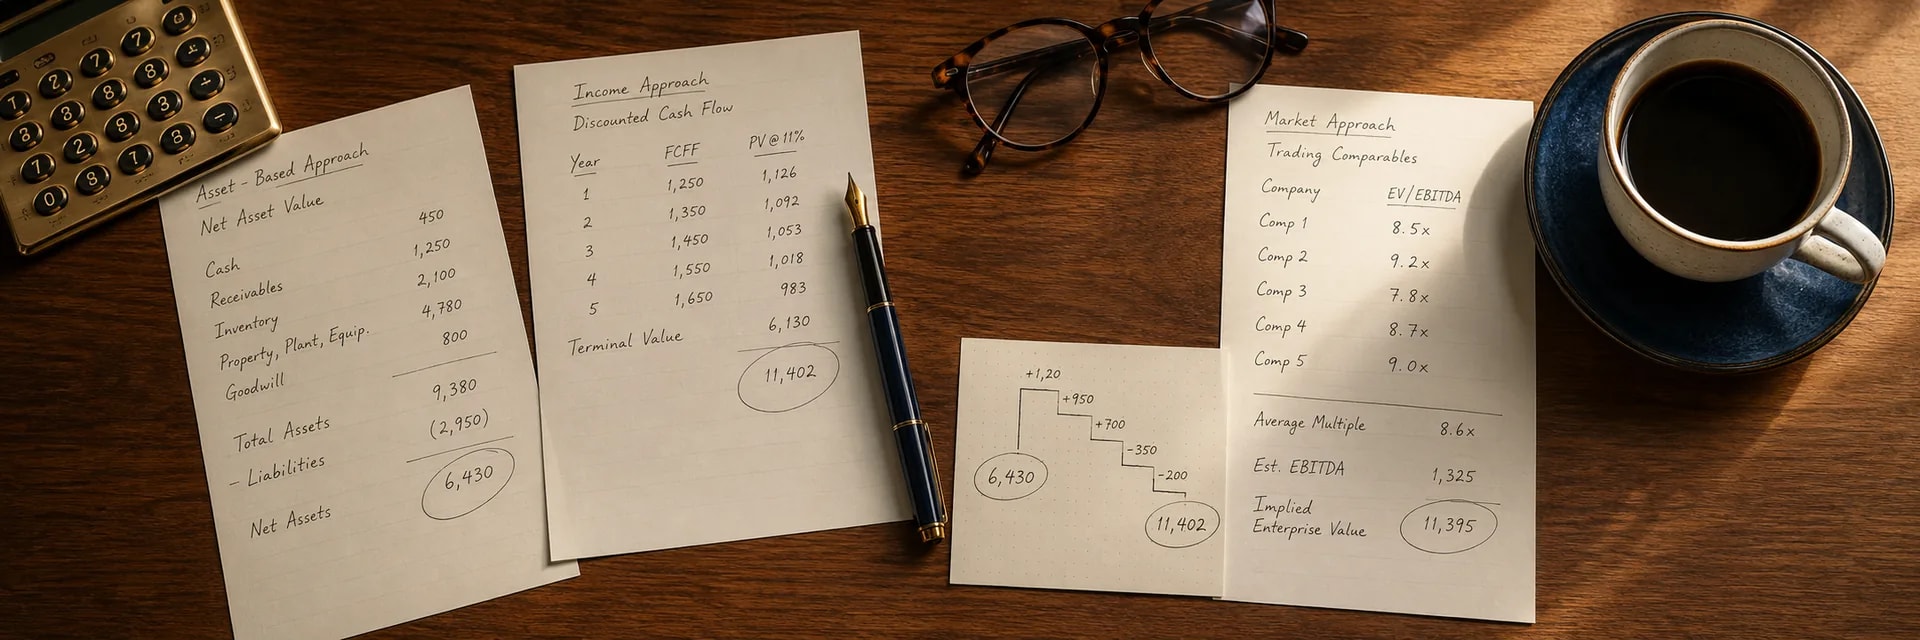
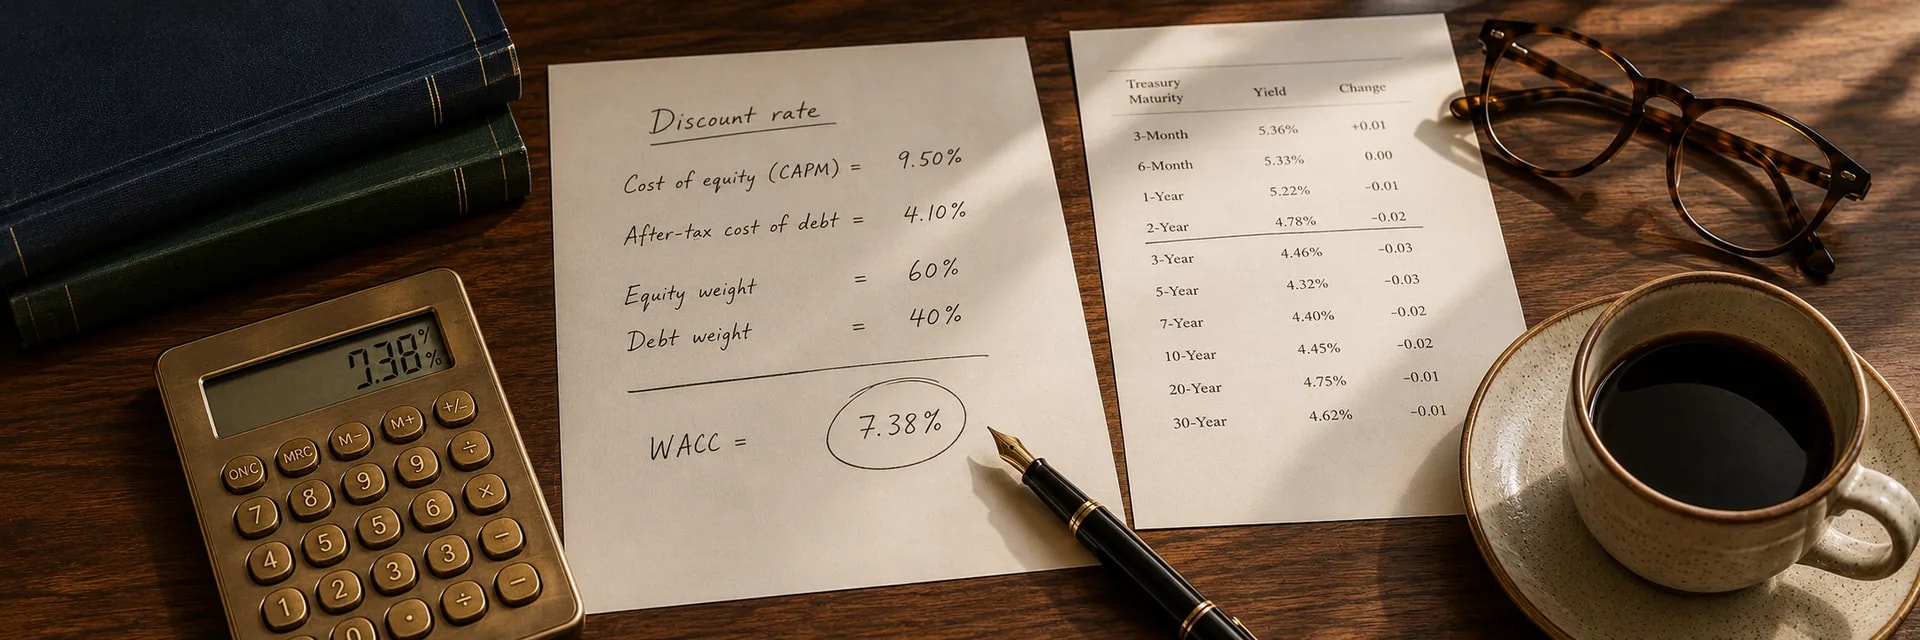
For more detail, visit our Education Valuations page, which explains in depth the mathematical models used by pros to calculate intrinsic value and margin of safety.
2. What Equity Market Quotes Actually Represent
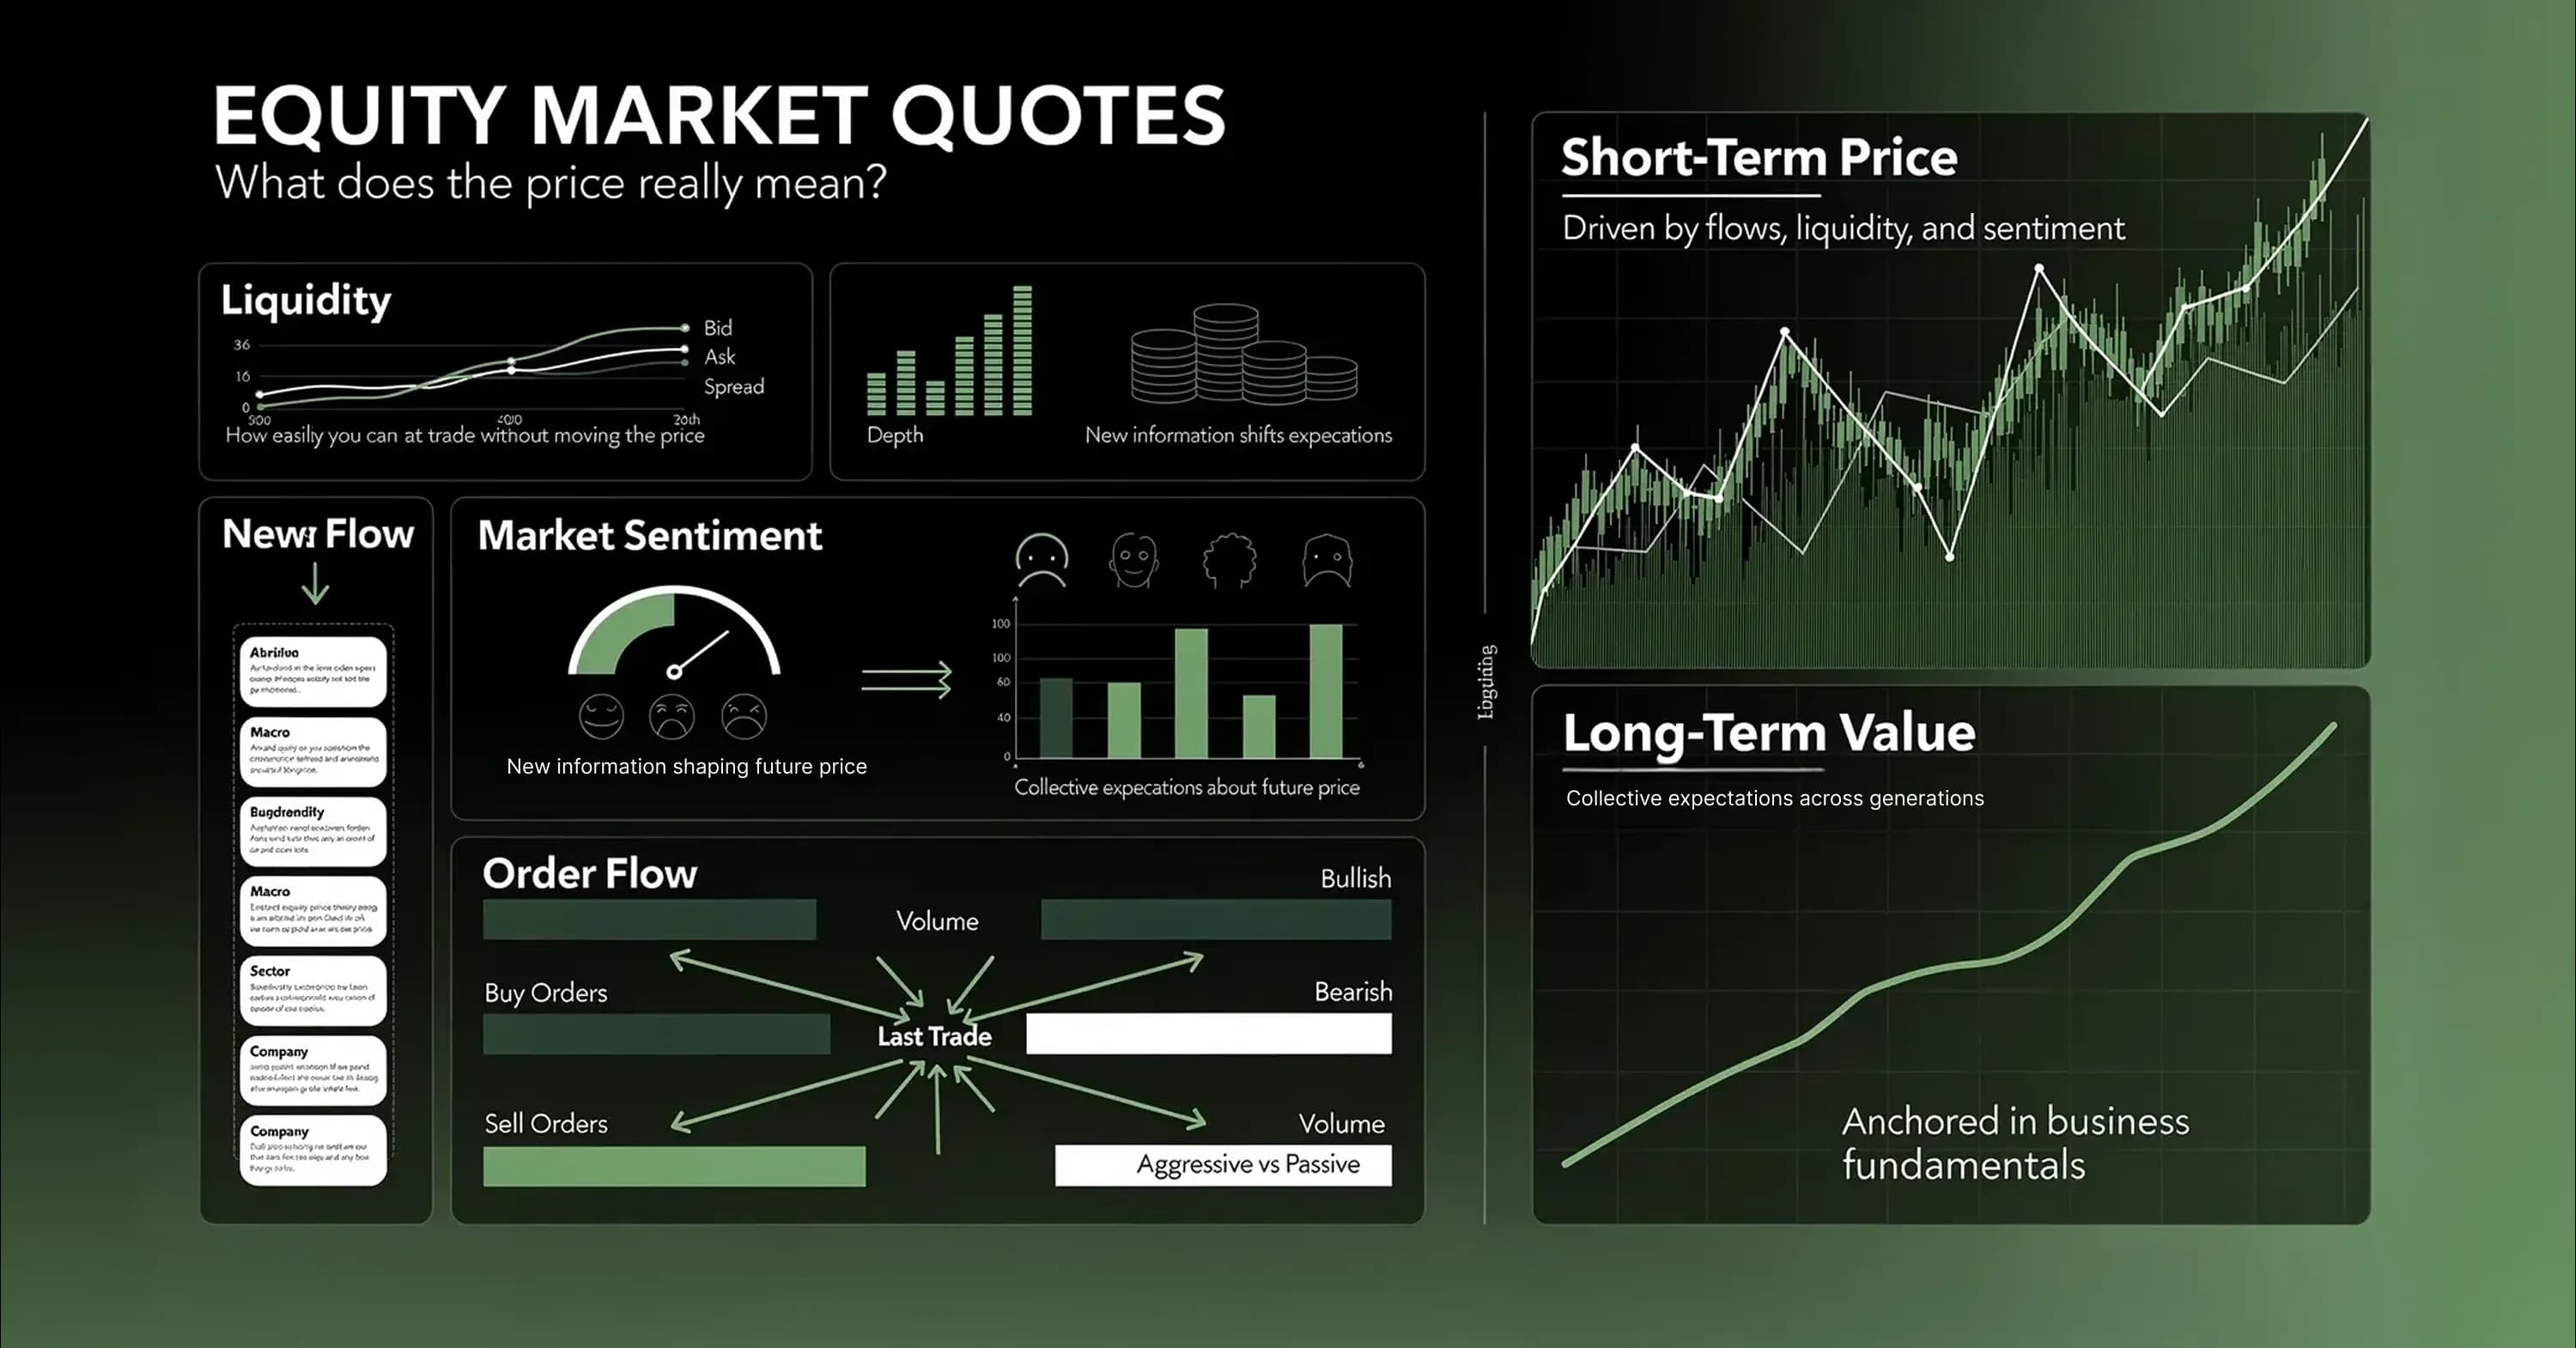
To ignore price, you must understand what builds it. When you look at equity market quotes, you are seeing a snapshot of liquidity and order flow. You are not seeing a business report card.
Prices move because of aggressive buyers or sellers. If a large institution needs to sell millions of shares to raise cash, the price will drop. This happens even if the company just reported record profits. The quote reflects the liquidity need of that seller, not the health of the business.
The industry surrounding these quotes is massive. The hunger for faster, more granular data drives billions in spending. In fact, global spending on financial market data and news grew 6.4% in 2024, reaching a staggering $44.3 billion. This money is not spent to find value. It is spent to react to price changes milliseconds faster than the competition.
Consider the factors that influence the quote on your screen:
-
Liquidity: How easily can shares be traded?
-
Sentiment: Are traders feeling greedy or fearful today?
-
News flow: Headlines often cause knee-jerk reactions that reverse days later.
-
Order flow: Large block trades can distort prices temporarily.
The obsession with price tracking is growing among professionals. Evidence shows that spending by equity trading groups on market data increased 6.8% in 2024. While they fight over micro-pennies, long-term investors can stand back. You do not need to pay for faster data. You just need to know what the business is worth.
For a breakdown of the key ratios that factor into these short-term price dynamics, check out our guide to Education Key Financial Ratios.
3. The Great Divergence: Why Price Does Not Equal Value
Benjamin Graham, the father of value investing, famously said the market is a voting machine in the short run but a weighing machine in the long run. This creates a divergence. The price line zigs and zags, while the value line usually trends gently upward.
In recent years, this divergence has been stark. The market has grown significantly in size and activity. The scale is immense, as global equity market capitalization was $126.7 trillion in 2024. Within that massive ocean of capital, prices can detach from reality for extended periods.
Sometimes prices race far ahead of value. For instance, in 2024 the S&P 500 index closed at 5,881.63, which was a 23.3% gain from the previous year. Does this mean the businesses in the index became 23% more profitable in twelve months? Not necessarily. Often, this reflects an expansion in the multiple investors are willing to pay.
Conversely, fundamentals do drive long-term results. Over nearly two decades, earnings for the S&P 500 are up nearly 47 times that of the broader global market. This earnings growth is the "weighing machine" at work.
Here is why divergence happens:
-
Short-term visibility: Investors overreact to quarterly reports.
-
Macro fear: Interest rate scares bring down good and bad stocks alike.
-
Sector rotation: Money moves from tech to energy or utilities based on trends, ignoring individual company quality.
Activity levels confirm this volatility. It is notable that global equity market trading volume in the first half of 2024 was 9.6% higher than the previous period. More volume often means more noise. Your job is to ignore the volume and focus on the earnings.
For a deeper understanding of equity analysis, fundamental workflows, and valuation strategy, see our Education section.
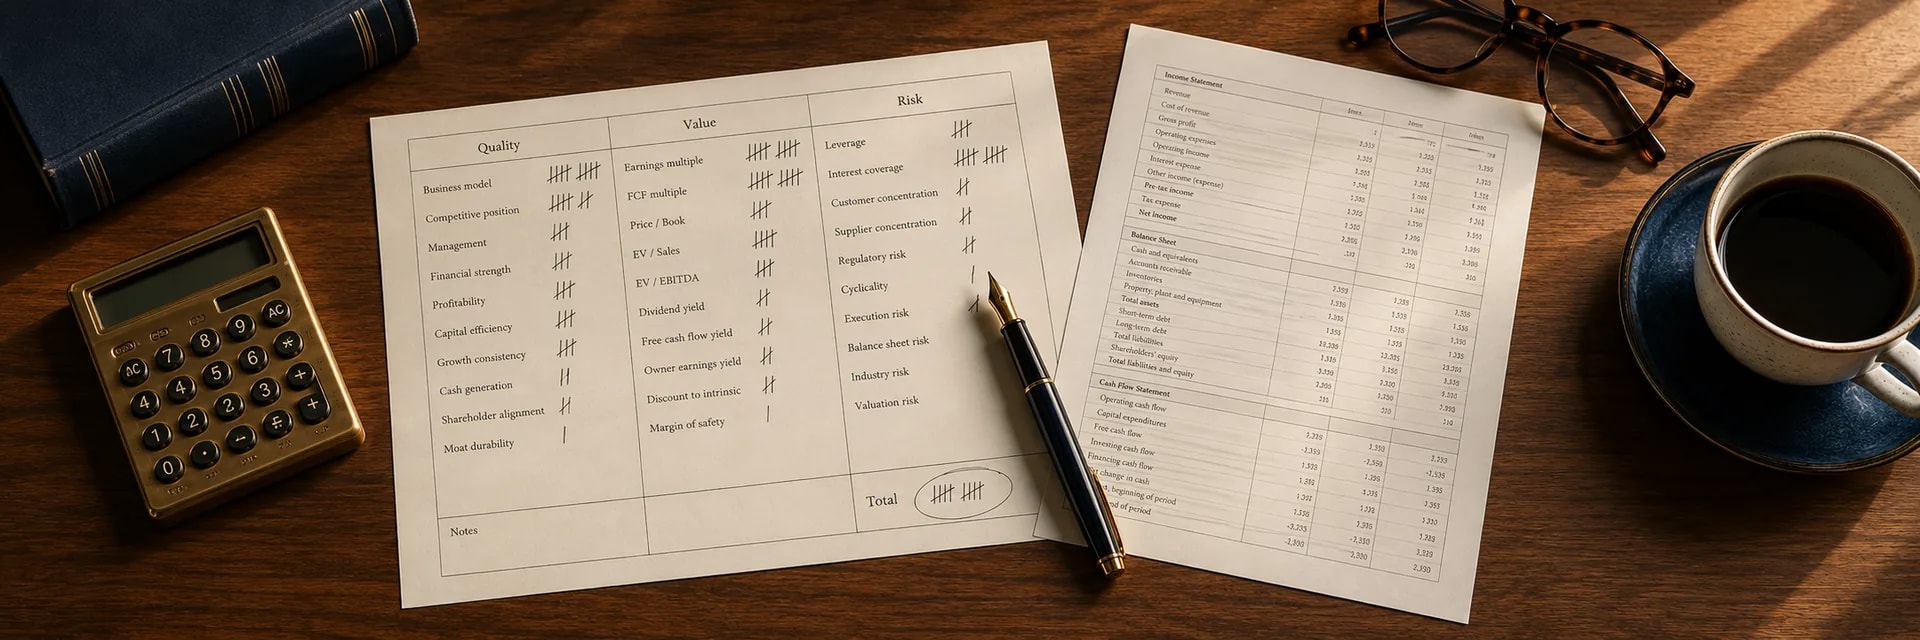
4. Practical Decision Checks Before You Buy
Knowing the theory is one thing. Acting on it is harder. When a stock drops 10% in a day, your brain screams "danger." To combat this, you need a checklist. You need rules that you agree on before the market opens.
This is about behavioral discipline. You must pre-commit to a strategy so you do not make decisions under emotional duress. Refer to our Education Due Diligence guide for a comprehensive framework on how to apply investment discipline and conduct objective analysis before reacting to market movements.
Use these checks when you see a sharp price movement:
-
The Thesis Check: Has the reason I bought this company changed? If the price is down but they are still selling the same amount of widgets at the same margin, the thesis is intact.
-
The Time Horizon: Are you holding for days or decades? Daily price action is irrelevant to a ten-year hold.
-
The Valuation Anchor: Re-calculate the fair value. If the stock falls, the gap between price and value gets wider. This should make the stock more attractive, not less.
Discipline also requires understanding market activity. High volume days can be deceptive. For example, the average daily trading volume of U.S. equities was 12.2 billion shares in 2024. That is billions of shares changing hands daily. Most of those trades are not based on deep fundamental research. Do not let the herd stampede you out of a good position.
5. Tool Workflow: Finding Divergence with a Stock Price Screener
You do not have to hunt for value with a calculator and a newspaper anymore. Modern tools can automate the search for price-value divergence. This is where a stock price screener becomes your best asset.
A screener allows you to filter the entire market based on specific criteria. Instead of looking for "stocks going up," you look for "stocks that are cheap relative to their earnings." This shifts your focus from price momentum to business quality.
Here is a simple workflow to find potential value candidates:
-
Set a Quality Floor: Filter for companies with a Return on Invested Capital (ROIC) above 10%. This ensures the business creates value.
-
Filter for Low Multiples: Look for a Price-to-Earnings (P/E) ratio below the historic average of the market (or the sector).
-
Check Free Cash Flow: Add a filter for Free Cash Flow Yield above 5%. This shows the company is generating actual cash relative to its price.
-
Exclude High Debt: Filter out companies with high Debt-to-Equity ratios to avoid value traps.
To see how these filters and valuation tools work in a real platform, explore the Stock Screener Overview, which details the screening process and offers practical examples.
Once you have a list, you can use our valuation tool to get a precise investment score. This score helps you objectively rank the opportunities without getting attached to the ticker symbol.
6. Common Pitfalls: Anchoring and Narrative Traps
Even with the best tools, your mind can play tricks on you. The most dangerous trap is "anchoring." This happens when you fixate on a specific past price.
If a stock was at $100 and drops to $80, you might think it is "cheap" because it is cheaper than before. But what if the intrinsic value is only $50? You just bought an overpriced stock thinking you got a deal. The anchor was the $100 price, which might have been a bubble.
Narratives are equally dangerous. Wall Street loves a good story. "AI will change everything" or "Oil is dead." These stories drive prices to extremes. The data shows that money chases these narratives aggressively. In fact, global equity market trading value in the first half of 2024 was 11.7% higher than late 2023. This surge often represents money chasing the latest hot narrative rather than fundamental value.
Watch out for these mental errors:
-
Recency Bias: Assuming the trend of the last three months will continue forever.
-
Confirmation Bias: Only reading news that agrees with your investment.
-
FOMO (Fear Of Missing Out): Buying a stock just because it went up 20% yesterday.
To avoid these, always go back to the numbers. Compare the stock market price to the calculated fair value. If the math does not work, the story does not matter.
For solutions and a streamlined process to separate story from substance, see how the Valuator tool can give you independent, formula-based company assessments.
Conclusion
The stock market is a powerful vehicle for wealth creation, but only if you respect the difference between price and value. The stock market price is a noisy, volatile signal. It tells you what people are feeling right now. Intrinsic value is the quiet reality of what a business produces.
By understanding how quotes work, using a stock price screener to find divergence, and maintaining strict discipline, you can turn volatility from an enemy into a friend. Do not let the flashing red and green lights dictate your financial future. Calculate the value, wait for the price to match your terms, and invest with confidence.
*Ready to see the difference? Compare price vs. value in our valuation tool today. 19