
In Q1 2026, EV/EBITDA multiples run from roughly 5x in energy to above 33x across all industrial firms, with technology near 24–32x, healthcare IT near 21–26x, and real estate near 20–24x, based on Damodaran's January 2026 NYU Stern data. The spread reflects differences in growth, risk, and capital intensity rather than mispricing. Benchmark a company against its specific sub-sector, normalize EBITDA before applying any multiple, and re-check the data quarterly; a blended market average is the fastest way to misvalue a business.
Market valuation introduction
Financial analysts define market valuation as the process that determines a company's worth, and they analyze specific metrics like EV/EBITDA, EV/Revenue, and P/E ratios. Investors often treat these multiples as static industry benchmarks rather than indicators that change with identifiable market forces.
In Q1 2026, strong forces push multiples in different directions. Artificial intelligence infrastructure investment inflates technology and industrial multiples, and geopolitical premiums distort energy valuations. At the same time, private equity funds compress bid-ask spreads in mergers and acquisitions, and sector rotation reprices mid-caps upward against mega-cap tech at one of the widest gaps in decades.
Investors who understand how these forces impact specific industries can evaluate whether assets offer a true margin of safety. J.P. Morgan's Guide to the Markets showed the top 10 S&P 500 companies trading at 28.4x average P/E multiples against a 21.0x market median in Q1 2026, and this extreme concentration requires a deeper look into the fundamentals. The sections below break down current multiples across five major industries, the macro forces behind them, and a practical framework for benchmarking against these sector norms.
Current Q1 2026 multiples
Figure 1. EV/EBITDA multiples by sector, Q1 2026
Profitable-firms multiple versus all-firms multiple for five major sectors; the gap between the two bars signals how many companies in the sector operate at a loss.
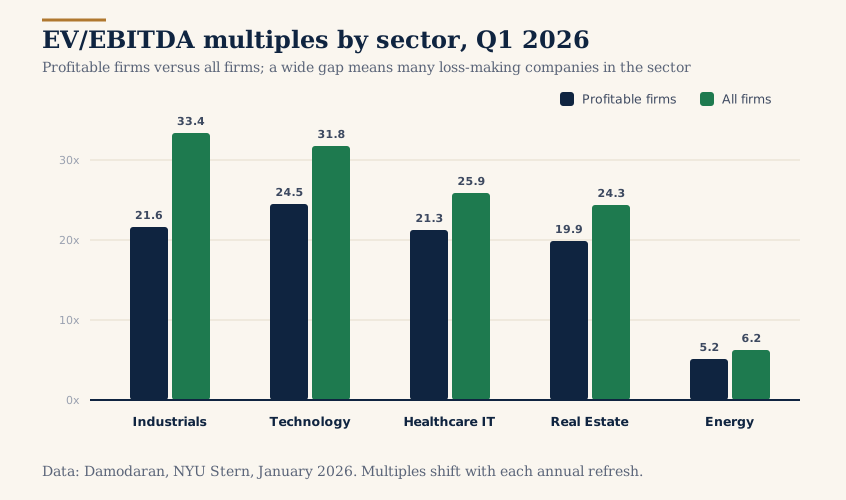
The chart above plots EV/EBITDA multiples across five major sectors in Q1 2026 and draws on Damodaran data:
-
Industrials show the widest spread of any sector. Profitable industrial firms trade at 21.58x, but the all-firms figure jumps to 33.42x. This 11.84x gap signals that a significant number of industrial companies operate at a loss, likely because of heavy capital investment in AI infrastructure and defense programs that have not yet translated into positive EBITDA.
-
Technology and SaaS follow a similar pattern. Profitable tech firms sit at 24.48x, while the all-firms multiple rises to 31.75x. The 7.27x difference reflects the large population of pre-profit software companies and AI startups that attract high enterprise valuations on the basis of future growth rather than current earnings.
-
Healthcare IT trades at 21.27x for profitable firms and 25.90x across all firms. The 4.63x spread is narrower than in technology or industrials, and this suggests that a higher proportion of healthcare IT companies already generate positive EBITDA. Private equity consolidation activity and demographic tailwinds support these elevated multiples.
-
Real Estate sits at 19.87x for profitable firms and 24.32x for all firms. The gap of 4.45x reflects refinancing pressure on overleveraged operators. Elevated borrowing costs from the Fed's 3.50–3.75% rate hold continue to weigh on property valuations and push some operators into negative earnings territory.
-
Energy stands apart from every other sector on the chart. Profitable energy firms trade at just 5.15x, and the all-firms number only reaches 6.21x. The 1.06x spread is the smallest of any sector, and the absolute multiples sit far below any peer group. Commodity dependence and earnings volatility drive this discount. Investors assign lower multiples because oil and gas cash flows can shift dramatically with a single geopolitical event or supply disruption.
A single metric like EV/EBITDA can range from about 5x in energy to above 33x in industrials, and each number reflects a distinct set of investor expectations about growth, risk, and capital intensity.
No single number offers certainty about a company's value. Multiples gain meaning only when investors understand what cyclically adjusted ratios show about long-term earning power beneath the current pricing, and specific macro forces constantly reshape these metrics.
Five macro forces that reshape multiples today
Five identifiable forces pull market valuation metrics in divergent directions across sectors, and each one connects directly to how investors price risk and growth today.
-
AI capital deployment inflates multiples across technology and industrial sectors simultaneously. Infrastructure spending of $4–5 trillion through 2030 means semiconductor manufacturers and data-center builders do not rely on current earnings alone but on anticipated demand curves that stretch years into the future.
-
Geopolitical energy premiums distort oil and gas valuations. Brent crude spiked toward $99 per barrel in March 2026 after a roughly 60% one-month run, while longer-term fundamental forecasts at the time sat closer to $60 per barrel. This gap between spot pricing and normalized expectations creates tension in how investors trust current energy multiples.
-
Federal Reserve rate policy keeps cost-of-capital-sensitive sectors under pressure. The Fed kept the federal funds rate at 3.50–3.75% in its March 2026 statement, and elevated uncertainty language in forward guidance compounds the strain on real estate and other debt-heavy business models.
-
Private equity dry powder that exceeds $2 trillion compresses bid-ask spreads in mergers and acquisitions, and this pushes deal EBITDA multiples from a 9.4x trough in early 2023 to 11.8x by mid-2025.
-
Sector rotation from mega-cap technology into industrials, materials, and healthcare mid-caps has produced one of the widest equal-weight versus cap-weight performance gaps in decades.
A probabilistic analysis framework puts these forces into context within a broader market valuation picture and prevents analysts from analyzing any single force in isolation.
Why market valuation multiples vary between business models
Business model characteristics explain why a top-tier software company can command 10x revenue multiples while a services firm trades at 3–5x. The structural differences are not arbitrary. They reflect how investors price quality of earnings, durability of cash flows, and sensitivity to external shocks.
Recurring revenue sits at the core of premium business valuation in technology. A SaaS company with 95% annual retention and 80% gross margins generates predictable cash flow that compounds over time. Investors pay more per dollar of that revenue because each dollar has a high probability of repeating next year. Manufacturing businesses depend on new orders each quarter, and that uncertainty compresses their revenue multiples even when absolute profitability looks comparable.
Healthcare occupies a unique position because approval barriers create moats that protect incumbent operators from rapid competitive entry. Demographic tailwinds strengthen the case further. The 85-and-older population is among the fastest-growing age groups in U.S. demographic projections, with growth that runs for decades rather than quarters. This demographic shift creates a demand floor that few other industries can match. Healthcare systems that embed AI as a foundational capability, rather than running isolated pilot programs, add an efficiency-driven growth layer to an already expanding sector.
Energy multiples tell the opposite story. Commodity dependence means earnings swing with global supply and demand cycles. A $40 move in oil prices can double or halve cash flows within a single quarter, and investors discount that volatility into lower long-term multiples regardless of current spot prices. Real estate faces a parallel challenge through interest-rate sensitivity because small changes in borrowing costs ripple directly into property values, refinancing feasibility, and investor confidence.
Each of these dynamics reinforces that valuation ranges from fundamental analysis depend on how well investors understand the business model beneath the numbers and not just the numbers themselves.
12-month multiple shifts analysis
Market valuation metrics across all five industries shifted materially between Q1 2025 and Q1 2026, and each shift traces back to a specific catalyst. Old benchmarks create a distorted picture of current asset values.
SaaS revenue multiples contracted from roughly 6.7x in early 2025 to 5.9x by early 2026 because AI-native competitors eroded the pricing power of incumbent software providers. Healthcare multiples moved in the opposite direction. Private equity sponsors executed the second-highest yearly buyout count on record in 2025, and 13 megadeals that exceeded $10 billion represented 30% of total deal value according to Bain & Company's Global Private Equity Report 2026. This concentration of capital into large transactions pushed healthcare EBITDA multiples higher as acquirers competed for limited targets.
Energy multiples surged after the Iran–U.S. escalation in March 2026 and stayed volatile against normalized earnings forecasts through the quarter. That volatility leaves investors with little conviction about whether current pricing reflects durable value or temporary fear premiums. Industrials re-rated upward because AI infrastructure spending translated into actual earnings growth rather than just projected demand. Real estate continued to face headwinds from refinancing stress and elevated borrowing costs, and these conditions offered no protection against further multiple compression.
Practical sector benchmarking framework
A structured framework turns raw multiples into actionable context. This framework connects sector data, company-specific adjustments, and macro awareness into a single analytical process. Even accurate data can produce misleading conclusions without this structure.
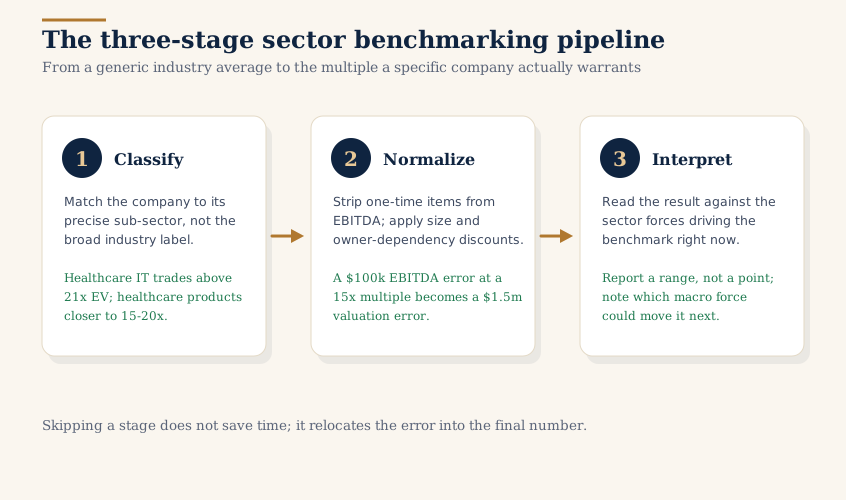
The process starts with classification, moves through calculation and normalization, and ends with interpretation against the benchmarks and forces outlined earlier in this article. Each stage narrows the gap between a generic industry number and a company's specific circumstances.
Figure 2. The three-stage sector benchmarking pipeline
Each stage narrows the gap between a generic industry average and the multiple a specific company actually warrants.
Cost of capital plays a central role here. NYU Stern data shows that the cost of equity for software companies ranges from 8.54% to 11.48%, and this range depends on beta and leverage structure. This variance means two companies in the same broad sector can warrant different multiples based solely on their financial architecture.
A discounted cash flow approach anchors the framework because it connects future earnings expectations to present value. An automated tool handles the arithmetic, which leaves the analyst free to focus on the judgment calls. Comfort with the underlying methodology matters more than comfort with any single output number because the framework prevents misapplied benchmarks. This methodology begins with accurate industry classifications.
Industry classifications
Analysts match a company to the correct industry sub-classification to determine whether the benchmark multiple reflects comparable businesses or a misleading average across unrelated models.
Broad labels like "healthcare" mask enormous dispersion. NYU Stern's January 2026 data illustrates this directly. Healthcare products trade at 4.36x revenue with Enterprise Value (EV) multiples of 15.13x to 19.78x, while healthcare IT trades at 4.70x revenue with EV multiples that stretch above 21x. The application of the wrong sub-sector multiple to a healthcare IT company produces a valuation gap of 10% to 30% before any other adjustment even enters the equation.
Precise data subsets provide a more accurate foundation than broad industry averages. That precision is the difference between a grounded estimate and a miscalculated one.
Business valuation metrics calculation
Accurate calculation of foundational business valuation metrics like EBITDA requires normalization adjustments. These adjustments remove one-time expenses, owner compensation above market rates, and non-recurring revenue items before the application of any multiple.
Precision matters here because the multiple amplifies small errors in the base metric. An EBITDA overstatement of $100,000 at a 15x multiple becomes a $1.5 million valuation error. Size and owner-dependency adjustments carry similar weight.
Research from the American Society of Appraisers shows that small business valuation multiples typically trade at 0.8x to 3x EBITDA in comparison to public company medians of 14x to 25x. Run the normalization before the numbers reach any model. The InvestViable Valuator takes the cash flow path you give it at face value, so adjusted inputs produce a defensible output and inflated inputs produce an inflated valuation. The size discount belongs in your inputs, not in your hopes for the tool.
How to apply this
Valuation multiples become useful only when investors read them against the broader market context: the business model behind the number, the sub-sector it belongs to, and the macro forces moving it. Q1 2026 conditions show unusually wide dispersion across all five sectors covered here.
Healthcare expands on consolidation momentum, geopolitical premiums inflate energy markets, and rate sensitivity compresses real estate. Investors take a significant risk when they evaluate an asset with a context-free multiple, because metrics from six months ago often describe conditions that no longer exist. The benchmark data changes every quarter; the framework for reading it does not.
InvestViable builds the analytical tools that put this context into practice. As a next step, carry the framework's normalized inputs into the InvestViable Valuator, and re-check the sector data against current conditions each quarter.
InvestViable does not publish buy or sell recommendations on individual securities. All analysis is based on public financial data and a transparent methodology. The Investment Score formula is proprietary; the inputs and what the score evaluates are documented.