Free cash flow is operating cash flow minus all capital expenditures. Owner earnings is net income plus non-cash charges, minus only the capital spending and working capital needed to maintain the business at its current volume. The gap between them comes from growth capital expenditure, working capital treatment, and stock-based compensation. A standard DCF forecasts free cash flow; owner earnings suits steady-state and no-growth valuations. Whichever measure feeds the model, its definition must match the growth assumptions built on top of it.
What owner earnings measures
Warren Buffett laid out the definition in the appendix to his 1986 letter to Berkshire Hathaway shareholders. Owner earnings equal reported earnings, plus depreciation, depletion, amortization, and certain other non-cash charges. From that subtotal, subtract the average annual capitalized spending on plant and equipment the business needs to maintain its competitive position and unit volume. If maintaining volume also requires additional working capital, that increment is subtracted on the same basis.
The definition exists because reported earnings drift away from economic reality in two directions. Depreciation is an accounting allocation of historical cost. In capital-light businesses it can overstate the true cost of staying in place, which makes reported earnings too pessimistic. In capital-heavy businesses replacing assets at inflated prices, historical-cost depreciation understates the real maintenance bill, and reported earnings flatter the business.
Buffett was explicit that the maintenance spending figure is a judgment. No accounting standard requires companies to report it, so the analyst estimates it. That makes owner earnings less precise than the figures on the cash flow statement and, at the same time, closer to the question an owner actually cares about. A business is worth what it can distribute while staying competitively intact, not what its accountants allocate to any single period.
One modern adjustment deserves emphasis. Stock-based compensation barely existed as a reporting issue in 1986. Today it is a large recurring cost at many issuers. Because owner earnings starts from net income and only adds back genuinely non-cash charges, a disciplined calculation leaves stock compensation expensed. It is a real transfer of value from owners to employees, and the dilution it causes is not hypothetical.
What free cash flow measures
Free cash flow is the workhorse measure of modern valuation, and its base form is simple: cash flow from operations minus capital expenditures. Both components come straight from the cash flow statement in the 10-K or 10-Q, which you can pull from SEC EDGAR. That reportability is its main advantage. Two analysts computing base free cash flow from the same filing should land on the same number.
The definition embeds three conventions worth making explicit. Operating cash flow adds back all non-cash charges, including stock-based compensation. It also absorbs the full year-over-year swing in working capital, whatever caused it. And the capital expenditure line subtracts everything the company invested in fixed assets, with no distinction between replacing worn-out equipment and building new capacity.
Practitioners layer variants on top of the base measure. Free cash flow to the firm (FCFF) measures cash available to all capital providers before financing flows and pairs with a WACC discount rate. Free cash flow to equity (FCFE) measures what is left for shareholders after debt service and net borrowing and pairs with a cost-of-equity rate. Matching the cash flow definition to the discount rate is its own discipline, covered in the discount rate and WACC guide.
Note that data providers do not all compute free cash flow identically, especially around leases, acquisitions, and capitalized software. When two platforms show different free cash flow for the same company, the definitions usually explain it; why valuations differ across platforms walks through that reconciliation.
Where the two measures diverge
Three definitional choices create the entire gap between the measures, and each one is worth checking separately before you trust either figure.
Capital expenditure scope. Free cash flow charges all capital spending. Owner earnings charges only the maintenance portion. For a business spending heavily to grow, free cash flow will sit well below owner earnings, and the gap is precisely the growth investment. Neither figure is wrong; they answer different questions.
Working capital treatment. Free cash flow inherits the full working capital swing from the cash flow statement, including inventory built for expansion or receivables that ballooned with a large new contract. Owner earnings subtracts only the working capital increment required to maintain current volume. Single-year working capital swings are noisy, so this difference matters most in any one year and washes out over longer averages.
Stock-based compensation. Operating cash flow adds stock compensation back, so free cash flow effectively treats it as free. Owner earnings, calculated with discipline, leaves it as an expense. For issuers granting equity worth several percent of revenue each year, this single line can flip which measure is larger.
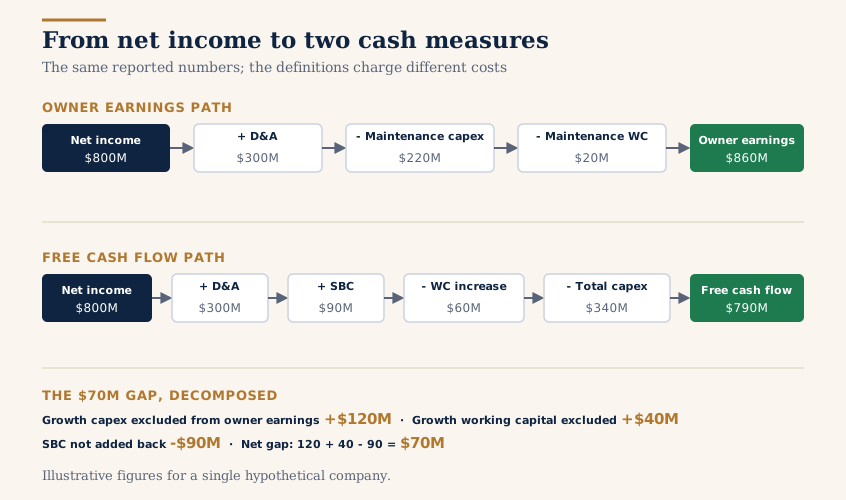
None of the three adjustments requires information from outside the filings. Every input is reported; only the maintenance split calls for judgment. The bridge below traces both definitions from the same net income line, so each divergence is visible as a separate step.
Figure 1. From net income to owner earnings and to free cash flow
The same reported numbers produce two different cash generation figures depending on which costs the definition charges.
A worked example of the gap
Take an illustrative mid-cap manufacturer. All figures are hypothetical and chosen to make the mechanics visible.
- Net income: $800 million
- Depreciation and amortization: $300 million
- Stock-based compensation: $90 million
- Increase in working capital: $60 million, of which $20 million is needed just to maintain current unit volume
- Total capital expenditure: $340 million, split $220 million maintenance and $120 million growth
Free cash flow first. Operating cash flow is net income plus depreciation and amortization plus the stock compensation add-back, minus the working capital increase: 800 + 300 + 90 - 60 = $1,130 million. Subtracting total capital expenditure of $340 million leaves free cash flow of $790 million.
Owner earnings next. Net income plus depreciation and amortization, minus maintenance capital expenditure, minus the maintenance working capital increment: 800 + 300 - 220 - 20 = $860 million.
The two measures differ by $70 million, and the decomposition is exact. Owner earnings excludes $120 million of growth capital expenditure and $40 million of growth-related working capital, which pushes it $160 million above free cash flow. It also declines to add back $90 million of stock compensation, which pulls it $90 million back down. The net is the $70 million gap: 120 + 40 - 90 = 70.
Run this decomposition on any company where the two measures disagree. It converts a vague sense that "the numbers differ" into three specific, checkable claims about growth spending, working capital, and stock compensation. Each claim is an input you can audit with the same rigor the DCF inputs checklist applies to growth and discount rate assumptions.
How do you estimate maintenance capex?
Maintenance capital expenditure is the judgment call inside owner earnings, and three estimation approaches dominate practice.
Management disclosure. Some companies split capital spending into maintenance and growth directly in the 10-K, in MD&A, or in investor materials. Where the split is disclosed, start there, but read the definition the company uses. Management teams have an incentive to classify spending as growth, which flatters the maintenance-adjusted numbers.
The depreciation anchor. For a business at steady state, depreciation and amortization over a full economic cycle approximates the cost of staying in place. The caveat is inflation: depreciation allocates historical cost, and replacing a machine bought eight years ago costs more than the depreciation charge implies. In inflationary periods, maintenance capital expenditure tends to run above depreciation for asset-heavy businesses.
The sales-ratio method. Average capital spending as a percentage of revenue over several years, attribute the portion that supported incremental revenue to growth, and treat the remainder as maintenance. Bruce Greenwald's valuation course at Columbia popularized this decomposition. It is mechanical enough to apply consistently across companies, which makes it useful for comparisons, and crude enough that it should be cross-checked rather than trusted alone.
Figure 2. Splitting total capital expenditure into maintenance and growth
The split is an estimate, not a reported line item; the three methods triangulate it from different directions.
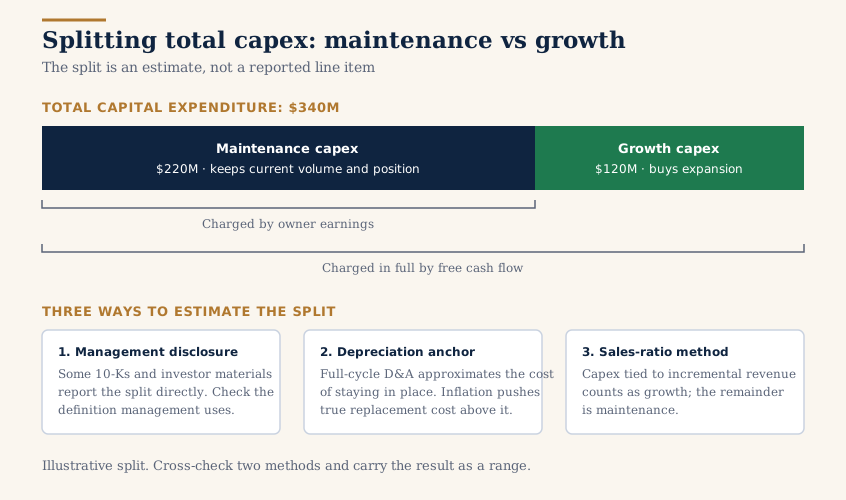
Whichever method you lead with, carry the result as a range. If the depreciation anchor says $280 million and the sales-ratio method says $220 million, owner earnings inherits that spread. A range that is honest about estimation error beats a precise figure that hides it, the same output discipline the pillar guide to valuation methods applies to final intrinsic value.
Which measure belongs in your valuation
The choice follows from what the model assumes about growth.
A standard multi-year DCF should forecast free cash flow. The model explicitly projects growth, so it must also charge the capital spending that buys the growth. Feeding owner earnings into a growth DCF breaks that consistency: the model credits expansion revenue while never paying for the expansion. Aswath Damodaran's notes on estimating DCF inputs formalize this consistency requirement between reinvestment and growth.
Owner earnings fits the steady-state question. For a mature business valued on a no-growth base case, owner earnings divided by a discount rate gives a defensible floor value: what the company is worth if it only maintains its position. It also suits businesses whose reported free cash flow is chronically distorted by expansion spending, where the maintenance-adjusted view reveals the underlying earning power. Screens built around durable cash generation, such as the Quality Stocks slice of the Stock Universe, surface exactly the companies where this steady-state lens is most informative.
The two measures also work together. Valuing a company both ways brackets the answer: owner earnings capitalized at the discount rate gives the no-growth floor, and the free cash flow DCF gives the growth case. If the market price sits below the no-growth floor, the growth assumptions barely matter. If the price only makes sense under the aggressive end of the growth case, the valuation is fragile. The gap between the two outputs tells you how much of the price is riding on expansion.
Whichever measure you choose, it becomes the anchor for the model's growth path. The InvestViable Valuator runs the DCF from explicit inputs the user controls: the cash flow growth path, the discount rate, and the terminal growth rate. The starting cash flow that growth path compounds from is exactly the choice this article covers, and it deserves the same scrutiny as any other input.
Where this fits in your workflow
Settle the cash flow definition before the model, not after. Pick the measure that matches the question: free cash flow for a growth DCF, owner earnings for the steady-state floor. Estimate maintenance capital expenditure by at least two methods and keep the spread visible. Then run the decomposition from the worked example whenever the two measures disagree, because the disagreement is information about where the business is spending. From there, the valuation methods pillar covers building the full model, and a margin of safety calibrated to your estimation error covers being wrong.
Document which definition the model used, along with the maintenance capex estimate and the method behind it, in the same place you record the growth and discount rate assumptions. A valuation you revisit a year later is only comparable to the original if the cash flow definition held still. The same rule applies across companies: hold the definition constant when comparing two businesses. A free cash flow figure set next to an owner earnings figure flatters whichever company fits its blind spots. The cash flow definition is the quiet input; it moves the output as much as the loud ones.
InvestViable does not publish buy or sell recommendations on individual securities. All analysis is based on public financial data and a transparent methodology. The Investment Score formula is proprietary; the inputs and what the score evaluates are documented.