A reverse DCF holds the current market price fixed and solves for the growth rate that price implies. You keep the discount rate and terminal growth explicit, then back out the growth that makes the model's present value equal the quote. The output is not a target price; it is the expectation the market is already paying for, which you then test against the company's history and industry structure.
What a reverse DCF actually does
A forward discounted cash flow model takes a growth forecast, a discount rate and a terminal value, and returns an intrinsic value. The analyst then compares that value to the market price. The weakest link in that chain is the growth forecast, because no one can know a company's cash flows a decade out, and small changes in the assumed growth rate swing the output dramatically.
A reverse DCF inverts the final comparison. It treats the market price as a known quantity and treats the growth rate as the unknown. You still supply a discount rate and a terminal growth assumption, but instead of producing a value to argue about, the model produces the growth rate the current price already embeds. That number is the market's consensus expectation, made explicit.
The reframing matters because it changes what you are arguing about. A forward DCF invites a debate over whether your $182 estimate or someone else's $210 estimate is correct, and both sides are defending forecasts no one can verify. A reverse DCF moves the debate onto firmer ground. If the price implies 12 percent annual cash flow growth for a decade, and the company has never sustained double-digit growth, the question is no longer whose model is right. The question is whether this specific business can clear a bar the market has already set. That is a question history and industry structure can help answer.
This approach has a lineage. It is the engine behind expectations investing, the framework Alfred Rappaport and Michael Mauboussin built around reading the assumptions priced into a stock before forming a view. It is also the idea behind what Aswath Damodaran documents as the growth rate implied by a price once the other valuation inputs are pinned down. The discipline is to start from the price, not from a spreadsheet of your own optimism.
The mechanics: solving for the implied growth rate
The cleanest way to see the inversion is the single-stage case. A perpetuity-growth model says price equals next year's free cash flow divided by the discount rate minus the growth rate, where next year's figure is current free cash flow grown one period. With price, current free cash flow and a discount rate in hand, that equation rearranges to solve for the implied growth rate directly. It equals the discount rate times price, minus current free cash flow, divided by the sum of price and current free cash flow.
Take a company generating five dollars per share of free cash flow, trading at 150 dollars, discounted at 9 percent. The arithmetic returns an implied growth rate of roughly 5.5 percent in perpetuity. That single number is the headline output of a reverse DCF: at this price and this discount rate, a buyer is paying for free cash flow that compounds at about 5.5 percent forever.
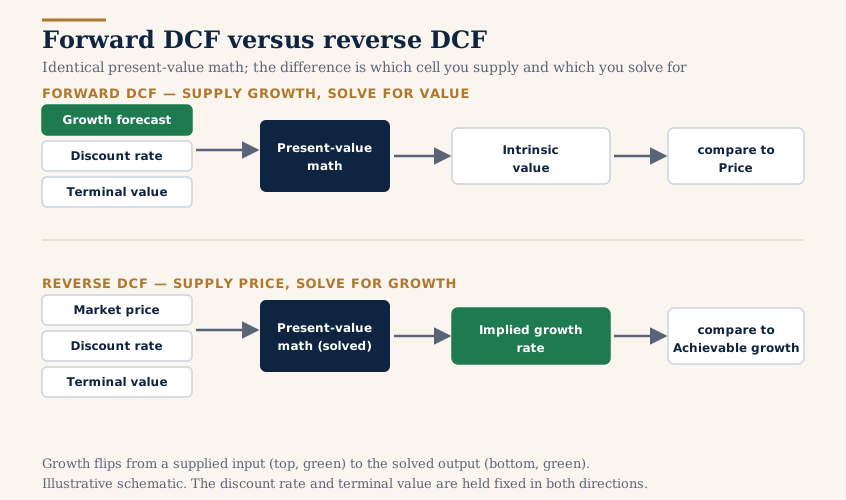
Figure 1. Forward DCF versus reverse DCF
The two models share the same machinery; they differ only in which quantity is the input and which is solved for.
Real businesses are not single-stage, so practitioners use a two-stage version. You hold the terminal growth rate fixed at a defensible long-run figure, typically 2 to 3 percent for a developed-market company, and adjust the explicit-period growth rate until the model's present value equals the market price. There is no closed-form answer here; you iterate, raising or lowering the explicit growth rate until the present value lands on the quoted price. The result is the explicit-period growth the market is paying for, conditional on a sensible terminal assumption. The full forward machinery, including how the explicit period, discounting and terminal value fit together, is laid out in the DCF guide; a reverse DCF reuses every piece of it and only changes which cell you solve for.
A worked example: backing out the implied expectations
Consider a mature consumer-staples compounder, the kind of business with steady volumes, modest pricing power and a long operating history. Suppose it earns ten dollars per share in free cash flow, carries little net debt, and trades at 250 dollars. You assemble the standard inputs: a discount rate of 8.5 percent built from the current 10-year Treasury yield plus an equity risk premium, and a terminal growth rate of 2.5 percent anchored to long-run nominal economic growth.
Running the model backward, you adjust the explicit-period growth rate until the ten-year present value plus the discounted terminal value equals 250 dollars. Suppose that happens at around 7.5 percent. The implied expectations are now concrete: the price requires this staples business to grow free cash flow at roughly 7.5 percent annually for a decade before fading to 2.5 percent.
The next step is the entire point of the exercise. You test 7.5 percent against evidence. Pull the last ten years of free cash flow from the company's filings on SEC EDGAR and compute the realized growth rate. If the business has compounded free cash flow at 3 to 4 percent through a favorable decade, then a price demanding 7.5 percent is pricing in an acceleration the company has not demonstrated. That is an expectations gap, and it is far more informative than a forward DCF that simply prints a number lower than the market price.
The same arithmetic cuts the other way. For a business whose implied growth rate sits below its demonstrated track record, the market may be underpricing a durable trajectory. Reverse DCF does not tell you to act in either case. It tells you precisely what assumption you would be buying, so the decision rests on whether that assumption is defensible rather than on whose spreadsheet is prettier.
Why the discount rate you fix changes the answer
A reverse DCF has two unknowns, the discount rate and the implied growth rate, joined by a single equation. Fix one and you determine the other. This is not a flaw, but it is the most misunderstood feature of the technique, and quoting an implied growth rate without the discount rate that produced it is meaningless.
The relationship is intuitive once stated. A higher discount rate means future cash flows are worth less today, so the same price can only be justified if those cash flows are larger, which means the model solves for a higher implied growth rate. A lower discount rate does the reverse. The implied growth figure is therefore a function of the rate you choose, and reasonable analysts choosing rates a couple of points apart will back out materially different expectations from the identical price.
Figure 2. The implied growth rate moves with the assumed discount rate
Single-stage reverse DCF for a stock at 150 dollars with five dollars of current free cash flow per share, solved across a range of discount rates.
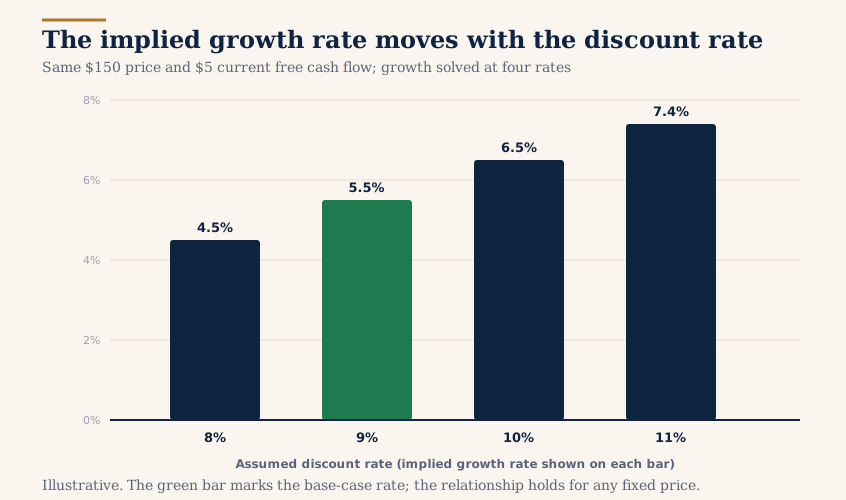
The practical discipline is to run the reverse DCF across a defensible band of discount rates rather than reporting a point estimate. If the implied growth rate is demanding across the whole range, say 6 to 8 percent for a business that grows at 3 percent, the conclusion is robust to the rate debate. If the implied growth crosses from achievable to demanding as the rate moves within a plausible band, then the discount rate is doing the heavy lifting and you have learned that the verdict depends on it. Choosing that rate well is its own discipline, covered in the discount rate and WACC guide; the reverse DCF inherits whatever rigor or sloppiness went into it.
Reading the expectations gap
The expectations gap is the distance between the growth rate the price implies and the growth rate the business can credibly deliver. Reading it well is where reverse DCF earns its place in a process, and it requires assembling evidence rather than asserting a view.
The achievable side of the gap comes from three sources. The first is the company's own history: the realized free cash flow growth over a full cycle, not a cherry-picked stretch. The second is industry structure: a business in a mature, competitive category faces a ceiling that a platform with widening network effects does not, and the implied growth has to be read against that ceiling. The third is the arithmetic of size: a company already generating tens of billions in cash flow cannot compound at the rate of a smaller challenger, because the absolute dollars required become a large share of its served market. An implied growth rate that looks ordinary in percentage terms may be extraordinary in dollar terms for a large incumbent.
When the implied growth sits well above the achievable estimate, the price is making an aggressive bet, and the appropriate response is to demand a specific, structural reason the company will exceed its history. When the two are close, the price is roughly fair on a cash flow basis and the decision shifts to other factors. When the implied growth sits below the achievable estimate, the market may be skeptical for reasons worth understanding before concluding it is wrong.
Reverse DCF is not the only tool that surfaces this kind of disagreement. When a forward DCF, a multiples view and the implied expectations all point in different directions, the reconciliation is itself a discipline, one this cluster treats separately in the piece on why valuation methods disagree. The implied growth rate is a clean way to quantify exactly how far apart the market and your own forward model stand.
Where reverse DCF breaks
The technique inherits every limitation of the forward DCF and adds a few of its own, and a disciplined analyst names them before relying on the output.
The first failure mode is the input quality the DCF inputs checklist was written to catch. A reverse DCF is only as trustworthy as the free cash flow base it starts from. If the current free cash flow is distorted by a one-time working capital swing, an unsustainable margin, or unadjusted stock-based compensation, the implied growth rate inherits the distortion. Garbage in still produces garbage out, even when you run the model backward.
The second is that reverse DCF compresses a rich set of assumptions into a single growth number, which can create false precision. The real world has growth fading at different rates, margins expanding or contracting, and reinvestment needs shifting over the forecast, and collapsing all of that into one implied growth figure hides those moving parts. The number is a summary statistic; it does not describe everything the market believes.
The third is that the technique says nothing about whether the market's expectation is correct. It tells you what is priced in, not what will happen. A high implied growth rate is not a signal that a stock will fall, and a low one is not a signal that it will rise. Markets can hold demanding expectations for a long time, and businesses do sometimes exceed their history. Reverse DCF measures the bet, not the outcome.
Finally, the method fits some businesses poorly. Companies with negative or erratic free cash flow, early-stage businesses without a stable base, and financials or other balance-sheet-driven models do not lend themselves to a clean reverse DCF. For those, the implied growth rate is too sensitive to the starting assumptions to carry weight, and other methods do the work better.
How to apply this
Use reverse DCF as a lens rather than a verdict. Early in research, run it to learn what the price assumes before you have formed a view, so your own forecast is anchored to the market's bet rather than to your enthusiasm. The implied growth rate tells you how high the bar is; the rest of the analysis decides whether the company can clear it.
In practice the workflow is short. Take the current price, a clean free cash flow base from the filings, a discount rate band rather than a single rate, and a terminal growth assumption. Solve for the implied growth rate across the band, then compare it to the company's demonstrated growth and the structural ceiling of its industry. You can approximate the whole exercise inside the InvestViable Valuator, whose cash flow growth, discount rate and terminal growth inputs are exactly the three levers a reverse DCF turns. Adjust the growth input until the model's output matches the current price. The growth figure you landed on is the implied expectation, read off the tool by hand rather than solved automatically.
The expectations gap you uncover then feeds the next decision. A price embedding growth the business cannot defend is precisely where a margin of safety discipline does its work, translating the gap into a maximum acceptable price set independently of the quote. Reverse DCF does not replace a forward valuation or a margin of safety. It sharpens both by making the market's assumption explicit, so the question you answer is the right one: not what you hope the company will do, but what you are being asked to pay for.
InvestViable does not publish buy or sell recommendations on individual securities. All analysis is based on public financial data and a transparent methodology. The Investment Score formula is proprietary; the inputs and what the score evaluates are documented.