
ROIC vs ROE vs ROA comes down to the capital base in the denominator. Return on assets divides profit by total assets; return on equity divides it by shareholders' equity; return on invested capital divides operating profit after tax by the debt and equity actually invested in operations. Because ROE's denominator shrinks with debt and buybacks, it can rise while the underlying business does not. ROIC strips that distortion out, which makes it the cleanest test of whether a company earns more than its cost of capital. Use ROIC to judge business quality and capital allocation, ROE to judge shareholder return in context, and ROA to gauge asset efficiency.
What ROIC vs ROE vs ROA actually measure
The three metrics share a shape: a profit figure divided by a capital figure. What separates them is which capital sits in the denominator and which profit sits on top, and that choice changes what the ratio can tell you. The key financial ratios reference defines the individual ratios, return on equity and return on assets among them. The job here is knowing which one to reach for.
Return on assets puts net income over total assets. It asks how much profit the entire asset base generates, regardless of how those assets were financed. Return on equity puts net income over shareholders' equity. It asks what the owners earned on their stake, which means it carries the effect of every financing choice management made. Return on invested capital puts operating profit after tax over invested capital, the debt and equity actually funding operations. It asks whether the core business earns a return on the money committed to it, before financing structure enters the picture.
Return on invested capital (ROIC)
Operating profit after tax divided by invested capital (interest-bearing debt plus equity, less non-operating cash). It isolates the return the operating business earns on the money committed to it, independent of how that money was raised.
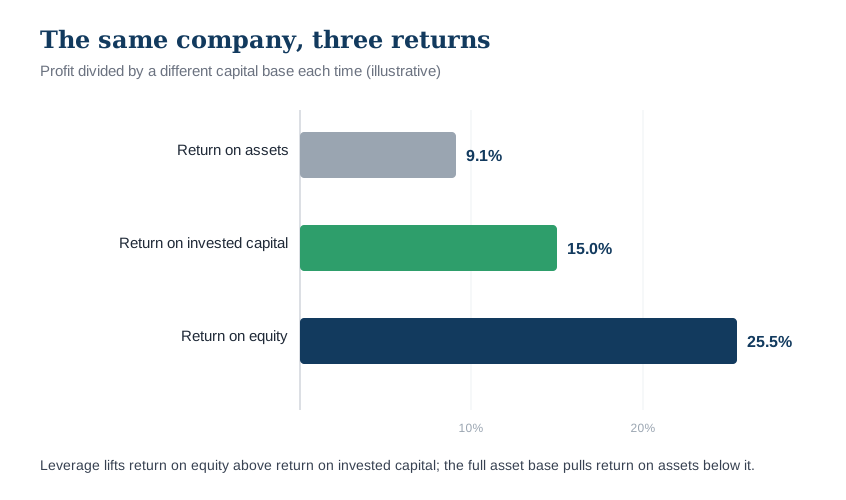
The distinction is not academic. The same company can post a modest return on assets, a healthy return on invested capital, and a striking return on equity in one year. Each measures a different base. Reading them as one number hides exactly the information that the spread between them contains.
How the three connect through the DuPont identity
The three metrics are not independent. The DuPont identity ties them together and shows why they diverge. Return on equity decomposes into three drivers: net profit margin, asset turnover, and an equity multiplier that captures leverage. Written out, return on equity equals net margin times asset turnover times assets divided by equity.
The first two terms multiplied together are return on assets. So return on equity equals return on assets times the equity multiplier. That single relationship explains most of the gap between the two ratios. Take an illustrative company with a return on assets near 9 percent and an asset base worth 2.8 times its equity. It posts a return on equity of about 25 percent. The extra sixteen points did not come from the business operating better. They came from financing the asset base with debt rather than equity.
Figure 1. The same company, three returns, one story
For one illustrative company, return on assets, return on invested capital, and return on equity read very differently because each divides profit by a different capital base.
The identity is a diagnostic, not just an equation. When return on equity rises year over year, the decomposition tells you whether margins improved, assets were used more intensively, or leverage simply increased. The first two are operating gains. The third is a financing choice that also raises risk. Aswath Damodaran's data on returns and cost of capital decomposes industry return on equity into a pure return on capital and a leverage effect. That separation is the starting point for judging whether a return is earned or engineered.
Why ROE flatters leveraged and buyback-heavy companies
Return on equity is the metric most likely to mislead, because two things that shrink its denominator both push it up without any improvement in the business. The first is debt. Every dollar of operations funded by borrowing rather than equity raises the equity multiplier, and a higher multiplier lifts return on equity mechanically. A leveraged industrial can show a high return on equity that reflects its balance sheet more than its operating skill.
The second is share buybacks. Repurchasing stock reduces shareholders' equity directly. A company can hold profit flat, buy back stock, and report a rising return on equity that no operating improvement backs. Sustained buybacks funded by debt can even drive book equity toward zero, at which point return on equity becomes meaningless or misleadingly enormous.
None of this makes return on equity useless. It makes it conditional. A high return on equity is informative only once you know how much is leverage and how much is operating return. That is exactly the check the DuPont decomposition provides. It is also why a high return on equity paired with a much lower return on invested capital is a signal rather than a contradiction. The same discipline runs through the value-trap safety checklist: a headline ratio that depends on its denominator is where traps hide.
ROIC: the cleanest test of value creation
Return on invested capital comes closest to answering the question that matters for a long-term owner: does this business create value, or consume capital to stand still? Because it uses operating profit after tax over the capital actually invested, it is neutral to how the company is financed. Two companies with identical operations and different debt loads post the same return on invested capital, even though their returns on equity differ sharply.
The number only means something next to a benchmark: the cost of capital. That is a weighted blend of the returns equity and debt holders require. Both build up from the risk-free rate, the 10-year Treasury yield published by the Federal Reserve, plus a premium for risk. Debt costs less, so the blended figure sits below the cost of equity. A business earning a return on invested capital of 15 percent against a weighted average cost of capital of 8 percent creates value on every dollar it reinvests. One earning 6 percent against the same 8 percent destroys value, however fast it grows. Growth multiplies whatever spread exists, positive or negative, which is why the spread matters more than the growth rate.
Return on invested capital has its own trap: acquired goodwill. A company that has grown by acquisition carries goodwill in its invested-capital base. Including goodwill measures the return on the full price paid for the businesses; excluding it measures the return on the operating assets alone. Both are legitimate, but they answer different questions, and comparing one company's goodwill-inclusive figure to another's goodwill-excluded figure produces nonsense. The analyst has to know which basis a reported figure uses, which means tracing it back to the company filings on SEC EDGAR rather than trusting a summary number.
ROA and asset intensity: where it fits
Return on assets is the least glamorous of the three and the most honest about one thing: how asset-hungry a business is. Because its denominator is the whole asset base, it falls for companies that need heavy plant, inventory, or equipment. It rises for asset-light businesses that generate profit from relatively little on the balance sheet. A software company and a railroad can earn similar returns on equity and wildly different returns on assets.
That makes return on assets most useful for two jobs. The first is comparing companies within an asset-heavy industry. There the ratio strips out financing and shows which operator squeezes the most profit from a given asset base. The second is tracking one company over time. A declining return on assets can flag an asset base growing faster than the profit it produces.
Return on assets carries a caveat for financial companies. For a bank or an insurer, assets are the business. A return on assets near 1 percent can be entirely healthy there, and is not comparable to an industrial's. The ratio also inherits any distortion in the asset base itself. That is why verifying the underlying figures on the fundamental analysis checklist matters before it is trusted. A large cash pile, for instance, drags reported return on assets down without saying anything about operating quality.
Which metric for which decision
The practical answer to ROIC vs ROE vs ROA is that you do not choose one. You match the metric to the question in front of you.
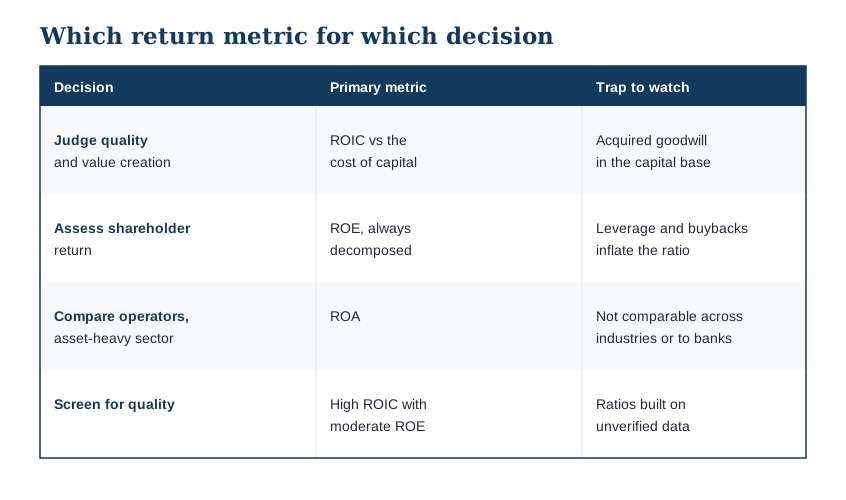
To judge business quality and capital allocation, lead with return on invested capital against the cost of capital. It tells you whether reinvested profit compounds value or leaks it, which is what you most need to know about a company you intend to hold. To assess what shareholders actually earn, use return on equity, but always decomposed, so leverage and buybacks do not masquerade as operating skill. To gauge asset efficiency or compare operators inside an asset-heavy sector, use return on assets. To screen a universe, combine them. A high return on invested capital with a moderate return on equity points to a quality business that is not leaning on leverage. You can screen toward that profile with the stock screener, then confirm each name yourself.
Figure 2. Which return metric answers which question
Each decision has a primary metric and a trap to watch. The metrics are complements, not substitutes.
These return metrics inform a judgment; they do not deliver one. On the InvestViable platform, this kind of return signal belongs to the performance dimension the Investment Score covers. The score weighs that dimension alongside valuation and financial strength, not as a standalone rating. A return metric tells you how well a business converts capital into profit. It does not tell you what that business is worth. That is why the number belongs inside a valuation workflow, recorded in the report next to price, fair value, and the margin of safety. Taken alone, any single return can point the wrong way; the three read together separate a genuinely high-quality business from a financially engineered one.
InvestViable does not publish buy or sell recommendations on individual securities. All analysis is based on public financial data and a transparent methodology. The Investment Score formula is proprietary; the inputs and what the score evaluates are documented.