
To value an ADR stock, value the underlying foreign business in the currency of its cash flows. Use its primary filings as the base: the 20-F for SEC-reporting foreign private issuers, or the home-market annual report. Convert the result to a per-ADR figure in two mechanical steps. Multiply the per-ordinary-share value by the number of shares each ADS represents, then translate at the current spot exchange rate. Keep the discount rate in the same currency as the forecast. Before trusting any per-ADR number, verify three inputs: the ADR ratio, the currency basis of every figure, and the filing each fundamental traces back to.
What an ADR actually is, and what you are valuing
An ADR program works through a depositary bank. The bank holds a block of the company's ordinary shares with a custodian in the home market and issues US-traded securities against them. Each of those securities, formally an American Depositary Share (ADS), represents a set number of ordinary shares. The certificate evidencing ADSs is the ADR; in practice the terms are used interchangeably, and this article follows that convention. The instrument trades in dollars and settles like any domestic stock; dividends arrive in dollars as well. The SEC's investor bulletin on American Depositary Receipts documents the structure.
Sponsorship determines how much of that structure the company stands behind, and how much data reaches US investors. A sponsored program is established with the issuer's participation and comes in three levels. Level I establishes a trading presence over the counter and cannot be used to raise capital. The depositary files a Form F-6, and the issuer files nothing: no 20-F, and no issuer information on EDGAR at all. Level II lists on a US exchange and the issuer files an annual report on Form 20-F. Level III adds the ability to raise capital in the US market. Level I is also the only level that can run unsponsored, meaning a depositary bank creates it without the issuer's involvement. Sponsored Level I and unsponsored programs rest on the same Exchange Act exemption. It has been self-executing since 2008 for an issuer that keeps its primary listing outside the US and publishes English-language home-market disclosures electronically. That is what lets an unsponsored program exist without the issuer ever agreeing to it. For a data platform, the difference is stark: a filed, audited record for Level II and III, versus whatever the vendor could collect for Level I.
None of this wrapping changes the economic claim. The cash flows backing an ADR are earned in the company's operating currencies and reported in its home filings; the wrapper changes the claim's denomination and nothing else. This article covers ADRs traded in US markets, both exchange-listed programs and the over-the-counter programs that sit alongside them. The same checks apply to any foreign listing an analyst models from US-dollar data.
Verify the ADR ratio before any per-share figure
The ADR ratio states how many ordinary shares one ADS represents. Depositary banks set the ratio so the ADR lands in a conventional US trading range. One ADS may therefore represent several ordinary shares, exactly one, or a fraction of one. The ratio appears on the 20-F cover page where one exists, on the depositary's program page, and in the Form F-6 registration statement. The F-6 is on EDGAR for every ADR, including the Level I and unsponsored programs that have no 20-F.
Take an illustrative Japanese issuer. Its ordinary shares close at ¥2,400 in Tokyo, each ADS represents two ordinary shares, and the exchange rate is ¥150 per dollar. The no-arbitrage ADS value is 2,400 × 2 ÷ 150, or $32.00. Every reported per-share figure follows the same conversion. If ordinary earnings per share are ¥90, per-ADS earnings are 90 × 2 ÷ 150, or $1.20.
Figure 1. From ordinary share to ADS: where the ratio and the exchange rate enter
Illustrative Japanese issuer: ordinary share price ¥2,400, ratio of two ordinary shares per ADS, exchange rate ¥150 per dollar.
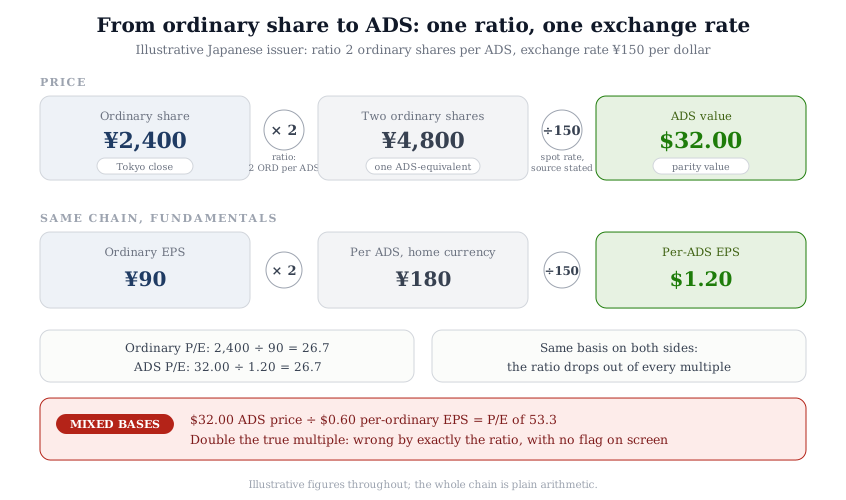
Valuation multiples survive the conversion when both sides use the same basis. The ordinary-share P/E is 2,400 ÷ 90, roughly 26.7. The ADS P/E is 32.00 ÷ 1.20, the same 26.7. The ratio drops out. It stops dropping out the moment a platform mixes bases. Per-ordinary earnings translated to dollars are 90 ÷ 150, or $0.60; divide the $32.00 ADS price by that figure and the P/E reads 53.3, double the true multiple. Nothing on the output flags the error, because every input looked like a clean dollar number.
Market capitalization carries the same trap. With 1,000 million ordinary shares outstanding, capitalization is ¥2.4 trillion, or $16.0 billion at ¥150. Multiplying the $32.00 ADS price by the full ordinary count would show $32 billion, overstating by exactly the ratio. The correct ADS-equivalent count is 500 million. That figure translates the full ordinary count for market-cap arithmetic; the number of ADSs actually outstanding is smaller, because only deposited shares back them. Depositaries also change ratios from time to time, and a ratio change behaves like a split: every historical per-ADS series needs adjustment while the ordinary series stands still. That is a corporate-action adjustment problem, the same class of error that database design exists to prevent.
Which filings feed the model: the 20-F, the 6-K, and the home report
A foreign private issuer with an exchange-listed ADR files an annual report on Form 20-F, available on SEC EDGAR, due four months after its fiscal year end. Domestic 10-K deadlines run 60 to 90 days, so the outside deadline for an ADR's audited annual data sits one to two months later. Large issuers routinely file inside it; check the filing date, not the deadline. Since 2008 the SEC has accepted statements prepared under IFRS as issued by the IASB without reconciliation to US GAAP. A 20-F filer may instead use US GAAP, or home-country principles with a US GAAP reconciliation. The framework has to be read off the filing rather than assumed from the form type. A peer table that blends an IFRS filer into a US GAAP set is comparing accounting frameworks as much as companies. Lease accounting is the clearest example. IFRS 16 removes the lessee operating-versus-finance distinction and splits every material lease into depreciation and interest. ASC 842 keeps the distinction, and a lease classified as operating produces a single straight-line cost inside operating expense. Both frameworks put the lease liability on the balance sheet, so the debt side is comparable while EBITDA is not.
Interim reporting is the bigger gap. Foreign private issuers face no quarterly filing requirement, and home-market interim disclosures reach the SEC as furnished Form 6-K reports. Exchange-listed programs carry a US floor. Nasdaq Rule 5250(c)(2) and the matching NYSE rule require a listed foreign private issuer to furnish a half-year balance sheet and income statement on Form 6-K. Above that floor the cadence is whatever the home market sets, and many issuers, particularly in Europe, stop at the semi-annual minimum. The quarterly baseline on the domestic side is itself under review. A May 2026 SEC proposal, Release 33-11414, would let US filers choose semiannual reporting; it had not been adopted as of this writing. For those companies a quarterly-refreshed trailing-twelve-month base cannot be assembled; the window can only be rebuilt twice a year, from half-year statements, and sits stale in between. Platforms handle the gap differently: some hold the latest full-year figure, some interpolate the half-year reports, and the label rarely discloses which. The mechanics of how a trailing window is built assume a quarterly cadence that does not exist for these issuers.
The filing-trace discipline from the fundamental analysis checklist applies here against a different document set. The audited anchor is the 20-F or the home-market annual report, and every platform figure should reconcile to one of them in a stated currency, for a stated period. For the illustrative issuer above, that means tracing the ¥90 of earnings per share to the yen income statement before it ever becomes $1.20.
Which currency should the DCF use?
The rule is consistency: the discount rate must be in the same currency as the cash flows it discounts. A currency carries an expected inflation rate along with its unit, and that inflation sits inside both nominal growth forecasts and nominal discount rates. Risk-free rates differ across currencies partly because expected inflation differs and partly because the sovereign issuing in that currency carries default risk; Aswath Damodaran's country-risk data tracks the default-spread side. A local government bond yield becomes a risk-free rate only after that sovereign default spread comes out. Country risk itself is a separate adjustment layered onto the cost of equity, and it stays in the model whichever currency the analyst picks.
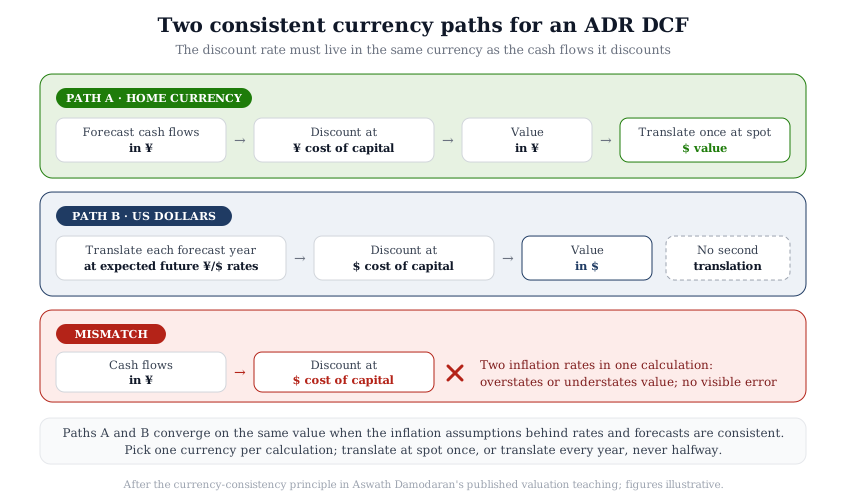
Two consistent paths exist. Path one values in the home currency. Forecast the cash flows in the currency the business earns, and discount at a cost of capital built from that currency's risk-free rate. Translate the resulting value into dollars once, at the current spot rate. Path two values in dollars. Translate each forecast year into dollars at expected future exchange rates consistent with the inflation differential, then discount at a dollar cost of capital. Applied with consistent inflation assumptions, the two paths converge on the same value. One illustrative period shows the convergence. Take a ¥1,575 million cash flow due next year, with spot at ¥150 per dollar. Expected inflation runs 1 percent in yen and 3 percent in dollars, over a 4 percent real bundle of rate and premium. Path one discounts at 5.04 percent (1.04 × 1.01) to ¥1,499 million and translates at spot: $10.0 million. Path two translates first, at a parity-consistent forward of ¥147.09 (150 × 1.01 ÷ 1.03), giving $10.71 million, then discounts at 7.12 percent (1.04 × 1.03): the same $10.0 million.
The broken third path mixes them: home-currency cash flows discounted at a dollar rate. When the home currency carries higher expected inflation, the mix overstates value, because inflation inflates the forecast numerator while the dollar rate never charges for it in the denominator. The reverse mix understates value. Run the same period wrong and discount the ¥1,575 million at the 7.12 percent dollar rate: ¥1,470 million, or $9.80 million at spot. That 2 percent haircut compounds every additional forecast year. For the single spot translation in path one, use a documented source. The Federal Reserve's H.10 release is a defensible reference for the two dozen currencies it covers, with the caveat that it publishes weekly noon buying rates rather than live spot. For currencies outside that set, record the venue and time of the rate used, and reuse that rate for every figure in the calculation. Platform exchange-rate timestamps vary, and that variance flows straight into per-ADS comparisons.
Figure 2. Two consistent currency paths for an ADR DCF, and the mismatch to avoid
Path A values in the home currency and translates once at spot. Path B translates each forecast year and discounts in dollars. The crossed path mixes currencies between numerator and denominator.
Dividends: withholding tax and depositary fees
ADR dividends leave the home country before they reach the holder, and the home country applies its statutory withholding first. Statutory rates run from zero in some markets to 35 percent in others. Tax treaties often reduce the rate for US holders, but relief is frequently not applied at source. Recovering the difference means reclaim paperwork through the depositary or the foreign tax authority. Part of the withheld amount may return through the US foreign tax credit, whose mechanics IRS Topic 856 sets out, including a minimum holding period. The credit only offsets US tax, so withholding inside an IRA or 401(k) has nothing to offset and is permanent.
Depositary charges sit on top. The SEC bulletin puts periodic service fees at roughly two to five cents per ADS, commonly deducted from dividend distributions. It lists the depositary's currency-conversion spread among the charges as well, and on many programs the spread exceeds the stated fee. Take an illustrative declared dividend of $1.00 per ADS with treaty withholding at 15 percent. At the low-end two-cent fee the holder nets $0.83; at the high-end five cents, $0.80. A yield screen built on the gross figure therefore overstates holder-level cash flow by a fifth to a quarter.
Withholding and fees never touch enterprise value. They land entirely on the holder's cash receipt, so any dividend-carried input needs a stated basis. The workflow fix is one line of documentation: name the dividend basis (gross, post-withholding, or post-treaty), the assumed withholding rate, and the conversion spread if the depositary discloses it.
Why platforms disagree on the same ADR
The conversion chain gives platform errors more places to enter than a domestic stock offers. Five failure modes account for most of the disagreement analysts see between sources:
- Mixed per-share bases. A per-ADS price divided by per-ordinary-share fundamentals, or the reverse. The output is wrong by exactly the ratio, as in the worked example above.
- Exchange-rate timestamp mismatch. Price translated at the New York close, fundamentals translated at a fiscal-period average rate, and a ratio built from both. Each choice is defensible; the blend is not documented.
- Stale interim base. A semi-annual reporter carrying figures labeled current or trailing that are up to a year old, interpolated, or held from the last annual report.
- Framework blending. IFRS-based line items compared against US GAAP definitions in one peer table, with EBITDA the most exposed line.
- Coverage gaps on unsponsored programs. With no SEC filing obligation behind the program, vendor fundamentals thin out or disappear, and some platforms silently substitute stale or estimated data.
The ADR price itself can also drift from the home listing. Arbitrage normally holds the gap within transaction and conversion costs, but the two lines trade in different sessions. When Tokyo is closed and New York is open, the ADS price embeds hours of information the home close does not carry. A same-moment comparison of the two prices therefore partly compares trading sessions. Before reading anything into a displayed premium or discount to the home listing, find the timestamp convention behind it.
The cross-platform reconciliation in why valuations differ across platforms treats currency as one of six divergence categories and works at the platform level. This article works at the instrument level inside that category: the ratio, filing, and withholding mechanics specific to ADRs. How a filed number physically travels onto a screen, for any issuer, is mapped in the equity market data infrastructure audit.
Running the ADR checks in a valuation workflow
Seven steps, run in order, before any modeling starts:
- Identify the program type. Search the ticker on EDGAR. A 20-F on file means an exchange-listed Level II or III program. A Form F-6 with no issuer filings means Level I or unsponsored; steps 3 and 7 then run against home-market documents.
- Confirm the ratio. Read it from the Form F-6 on EDGAR, which exists for every ADR, or from the 20-F cover page where one exists. Cross-check arithmetically: the ADS price converted into the home currency, divided by the ordinary price, should land near the stated ratio.
- Trace the fundamentals. Reconcile revenue and earnings to the 20-F or home-market annual report, noting the accounting framework.
- State the currency basis. One currency basis and one translation date per calculation, no mixing.
- Match the discount rate to the cash flows. Home-currency forecast with a home-currency rate, or dollar forecast with a dollar rate. Never across.
- Check the interim cadence. If the issuer reports semi-annually, treat any trailing-twelve-month label as unverified until the construction is documented.
- State the dividend basis. Name the basis and the assumed withholding rate before any yield enters the model.
The InvestViable stock screener screens a universe of 3,000+ US stocks on fundamentals and the Investment Score. ADRs are deliberately kept separate from that universe. Each failure mode in this article is a way a per-ADR figure can be wrong while looking clean. The platform's key figures, the Investment Score, and its valuation tools are built for US domestic issuers reporting in dollars, where none of these conversions apply. Foreign issuers remain findable on the platform, but they are not pushed through checks whose assumptions their filings do not meet. The separation is a data-quality decision made to protect the user: better to show no number than a number with a ratio or currency error hiding inside it. Wherever a screen, on any platform, returns a per-share figure for a foreign issuer, the steps above are the layer to run before trusting it. The InvestViable Valuator runs a DCF from three explicit inputs: the cash flow growth path, the discount rate, and the terminal growth rate, in dollars for the same US universe. For a foreign issuer, whatever tool an analyst uses, currency consistency between the growth path and the discount rate stays the analyst's own check. No tool can infer which currency a forecast was written in.
A per-ADS figure earns its place in a model once its ratio, currency, and filing base have been verified. The habit is the one database design rewards everywhere else in the stack: trace the number to its source before the model runs.
InvestViable does not publish buy or sell recommendations on individual securities. All analysis is based on public financial data and a transparent methodology. The Investment Score formula is proprietary; the inputs and what the score evaluates are documented.