
A trailing twelve months (TTM) figure sums the most recent four reported quarters and recalculates each time a new 10-Q lands; a fiscal-year figure covers the fixed window ending on the company's chosen year-end and updates once a year with the 10-K. Both describe twelve months of the same business, and they disagree because they rarely contain the same twelve. Compute TTM as latest fiscal year plus current year-to-date minus prior-year year-to-date, apply it to flows only, never balance-sheet snapshots, and draw every ratio's numerator and denominator from one base.
What TTM means in stock fundamentals
A TTM figure is built, not filed: no single document on EDGAR reports it. It is the latest four quarters on file, summed into one rolling annual figure that recalculates every time a new 10-Q lands. LTM (last twelve months) names the same window; the terms are interchangeable. A fiscal-year figure covers a fixed window instead. It ends on the company's chosen year-end, updates once a year with the 10-K, and then holds still until the next one.
A third base, forward estimates (FY+1, FY+2), comes from aggregated analyst forecasts rather than filings; their rolling analog is NTM, the next twelve months. Which base a platform chose to display is an audit question, and this article stays upstream of it, covering the two filing-derived bases and how each is built. For the illustrative issuer used throughout, the same revenue line reads $10,000M on a latest-fiscal-year basis and $10,800M on a trailing basis. Neither is wrong. Each answers a different question about when.
The label on the output does not always disclose the base. One surface shows a P/E computed on trailing earnings, another shows the same label computed on forward earnings, and a third mixes a current price with a fiscal-year denominator. How a figure travels from the filing to the display surface is a supply-chain question, mapped in the equity market data infrastructure audit. The practical rule here is narrower: before comparing any two numbers, confirm they share a time-period base.
Platforms default to TTM for a reason. It is the most current annual read available from the filings, and it puts companies with different fiscal calendars on a comparable recency footing. The default is sensible; the mismatches start when the reader assumes every figure follows it.
How to compute TTM from the filings
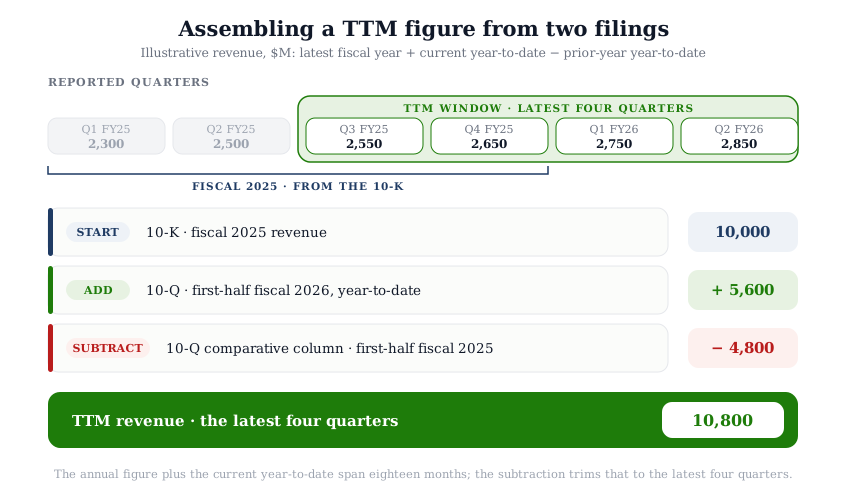
The TTM arithmetic takes three numbers from two filings. Take the latest full fiscal year from the 10-K. Add the year-to-date figure from the most recent 10-Q. Subtract the year-to-date figure for the same period of the prior year, which appears in the comparative column of the same 10-Q.
TTM = latest fiscal year + current year-to-date - prior-year year-to-date
The worked arithmetic, using the illustrative issuer: fiscal 2025 revenue of $10,000M, first-half fiscal 2026 revenue of $5,600M, and first-half fiscal 2025 revenue of $4,800M. TTM revenue = 10,000 + 5,600 - 4,800 = $10,800M. The annual figure and the current year-to-date together span eighteen months, six quarters. The subtraction trims the oldest two quarters off that span, leaving exactly the latest four.
Figure 1. Assembling a TTM figure from two filings
Illustrative revenue: the latest fiscal year, plus the current year-to-date, minus the prior-year year-to-date, equals the latest four quarters.
All three inputs come straight from the primary filings on SEC EDGAR. The annual figure sits on the audited income statement of the 10-K. The year-to-date figures sit in the condensed statements of the 10-Q. The income statement shows the current quarter and the year-to-date period side by side; the cash-flow statement shows year-to-date periods only. Both carry prior-year comparatives, which is all the formula needs. The SEC's investor bulletin on how to read a 10-K and 10-Q maps where each statement lives inside the filing. For the investor-side walkthrough of the same documents, see how to read a 10-K like a value investor.
Two mechanical notes. First, fourth-quarter figures do not exist as a standalone filing, because companies file three 10-Qs and one 10-K per year. A Q4 figure falls out of the same subtraction: full fiscal year minus the nine-month year-to-date. Second, the arithmetic applies to flow items only: revenue, operating income, net income, and the cash-flow lines. Anything that is a snapshot at a date, such as cash, debt, or equity, is never summed across quarters. That distinction gets its own section below.
This computation is often all the verification a mismatched number needs. When a platform's revenue figure does not match the 10-K, running the TTM arithmetic against the latest 10-Q usually reproduces the platform's number to the dollar. The mismatch was never an error; it was a fresher window.
Why TTM and fiscal-year numbers diverge
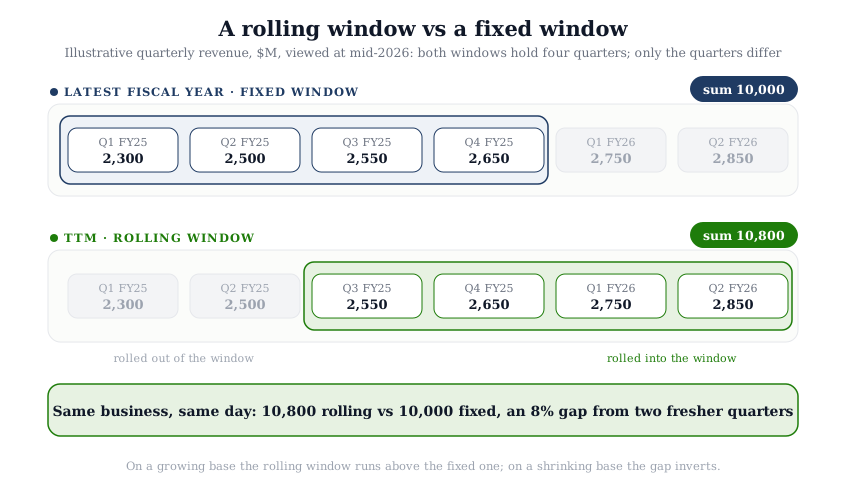
The two bases diverge because a rolling window and a fixed window contain different quarters for most of the year. On the day the 10-K is filed, TTM and fiscal year briefly agree. Each subsequent 10-Q swaps one old quarter out of the trailing window and swaps one new quarter in, while the fiscal-year figure stands still. Two filings later, half the TTM window is quarters the fiscal-year figure has never seen.
The direction of the gap tracks the trajectory of the business. For a growing company, TTM runs above the latest fiscal year, because the newest quarters are the largest. For a shrinking one, it runs below. In the illustrative example above, TTM revenue of $10,800M sits 8 percent above the $10,000M fiscal-2025 figure purely because the window rolled two quarters forward on a growing base. The faster the growth, the wider the gap.
Figure 2. A rolling window vs a fixed window
The same illustrative issuer at mid-2026: the fiscal-year figure holds still while the trailing window rolls forward.
Fiscal calendars widen the confusion. Apple's fiscal year ends in late September; many large retailers end theirs in late January to capture the full holiday season. A "fiscal 2026" figure for one company and a "fiscal 2026" figure for another can describe windows that overlap by only a few months, depending on each issuer's labeling convention. Cross-company comparison on fiscal-year data therefore requires calendar alignment, a comparability discipline the CFA Institute Research Foundation covers in its valuation literature. TTM softens the problem without solving it: every company's trailing window ends at its own latest reported quarter, which stays within a quarter of its peers for most filers.
Staleness widens the gap. A calendar-year reporter viewed in November carries fiscal-year data that is roughly ten months old, plus three newer 10-Qs the annual figure ignores. Seasonality, on the other hand, is neutral in the sum: both windows always contain exactly four quarters, one of each season. That neutrality is also why the four-quarter sum beats the run-rate shortcut of multiplying the latest quarter by four, which projects one season across the year.
Flows and snapshots: which metrics can carry a TTM window
The trailing-twelve-month treatment applies to flows, not to snapshots. A flow accumulates over a period: revenue, operating income, net income, depreciation, capital expenditure, buyback spend. Flows sum cleanly across four quarters. A snapshot is a balance at a date: cash, total debt, inventory, shareholders' equity, share count. Summing four quarter-end debt balances produces a meaningless number four times too large. Balance-sheet items enter any TTM calculation as either the latest snapshot or an average of snapshots, never a sum.
Ratios that mix the two need an explicit convention. Return on equity divides a flow (trailing net income) by a snapshot (equity). One convention uses the latest quarter-end equity; a cleaner one averages the opening and closing equity of the same four-quarter window. Both are defensible, and they produce different numbers whenever equity moved during the year. The same applies to ROIC, asset turnover, and inventory ratios.
Per-share metrics carry a second layer of convention. Trailing EPS built to GAAP convention uses the weighted-average diluted share count across the four quarters. Some display surfaces instead divide trailing net income by the latest period-end share count. For an issuer that bought back or issued meaningful stock during the window, the two conventions visibly disagree. Which share-count definition a platform applies is its own audit category, covered in why valuations differ across platforms.
Margins are the safe case. A TTM operating margin divides a trailing flow by another trailing flow over the identical window, so the window choice cancels. The general rule that falls out of all of this: every ratio needs its numerator and denominator drawn from the same window and the same convention. A trailing numerator over a fiscal-year denominator describes no twelve-month period that ever existed.
Where the trailing window misleads
TTM is the freshest full-year view the filings support, and that freshness carries five failure modes worth checking before the figure feeds a model.
The window cliff. A one-time item enters the trailing figure the quarter it lands and stays for exactly four quarters. A litigation settlement, an asset-sale gain, or a discrete tax benefit tilts every TTM reading for a full year, then drops out all at once. The result is a step change in the trailing series that has nothing to do with that quarter's operations. Anyone comparing TTM figures across that boundary sees growth or decline that never happened.
Mid-window acquisitions. When an acquirer consolidates a target mid-window, the trailing figure contains a partial year of acquired revenue. Each of the next few quarters adds more acquired weeks, so the trailing series shows steady growth that is really consolidation arithmetic. Year-over-year TTM comparisons stay distorted until the window laps the acquisition date. Organic-growth disclosures in the 10-K's MD&A separate the two effects; the TTM arithmetic alone cannot.
Recasts and discontinued operations. When a company reclassifies a divested segment as discontinued operations, it recasts the prior quarters in later filings' comparative columns; the original 10-Qs are not amended. A trailing figure stitched from filings issued before and after the reclassification mixes two inconsistent bases. The filing-trace discipline in the fundamental analysis checklist catches this. Pull each of the four quarters from the most recent filing that presents it, not from the one that originally reported it.
Cyclical inflections. A trailing window is a rear-view mirror. At a cyclical peak, trailing earnings are the strongest they will look for years, and any multiple computed on them looks deceptively cheap. At a trough the distortion inverts. For cyclical issuers the fix is not a fresher window but a normalized one, covered in normalizing earnings before you value a cyclical.
The 53rd week. Companies on a 52/53-week calendar report a fourteen-week quarter every five to six years. The extra week adds about 2 percent more selling time to any trailing window that contains it, before the business changed at all. The fiscal-calendar note in the 10-K discloses which years carry it.
Choosing the base for the analysis at hand
The base is a fit-for-purpose choice, not a correctness contest. Four common purposes, four defaults.
For a valuation starting point, use TTM. A forecast starts from the most recent operating reality, and no filing-derived base sits closer to the present. Check it against the five failure modes above before anchoring a model on it.
For cross-company comparison, use one base for every company in the set, and align calendars where fiscal year-ends differ materially. A peer table that quietly mixes trailing multiples with fiscal-year multiples ranks recency, not valuation. The same discipline applies inside a screen: any filter built on per-share or ratio data inherits the time-period base of the underlying figures, whichever stock screener produces the list.
For growth rates, match the windows: fiscal year over fiscal year, or TTM over the TTM ending four quarters earlier. Trailing-over-fiscal-year growth compares two windows that share two of their four quarters, presenting roughly half a year of change as a full year of growth. It is the most common arithmetic error behind growth figures that disagree across sources.
For backtests and historical studies, use as-reported, point-in-time data: the figures as the market knew them on each date, before restatements overwrote them. The reasons sit at the database layer and are covered in how stock market database design determines reliability.
A well-behaved data source states its conventions; Aswath Damodaran's published valuation datasets document their trailing-versus-fiscal choices explicitly. The time-period base deserves the same scrutiny as any model assumption, because it is decided before growth or discount assumptions enter. The InvestViable Valuator surfaces its core inputs: the cash flow growth path, the discount rate, and the terminal growth rate. Whichever tool runs the discounting, the time-period base of the fundamentals feeding it is the analyst's first decision. And when two sources still disagree after the bases match, the remaining gap has other owners: share count, GAAP treatment, currency, and restatement layer, reconciled in the cross-platform data-source audit.
InvestViable does not publish buy or sell recommendations on individual securities. All analysis is based on public financial data and a transparent methodology. The Investment Score formula is proprietary; the inputs and what the score evaluates are documented.