
Introduction
Investors often feel confused when a company with a "Strong Buy" rating sees its share price collapse. They also feel confused when professional targets lag behind bad news. The pressure to find safe numbers grows immense during 2026's market volatility, but relying on these figures endangers your capital. While analyst stock targets look like answers, they actually function as questions that should prompt further investigation into underlying business assumptions.
Research indicates stock prices reach these 12-month projections only 35% of the time during the target period. This low accuracy rate suggests these metrics aren't crystal balls but hypothetical scenarios based on specific, often optimistic, models. Stop viewing these numbers as mathematical certainties. Treat them as psychological benchmarks instead.
Disclaimer: This content is for educational purposes only and does not constitute investment advice. We are exploring how targets are produced and interpreted, not recommending specific actions.
Metric Definition Beyond Price Prediction
Investors often mistake a price target for a promise of future value, but this number represents a hypothetical scenario. The true analyst stock targets meaning projects where a stock price might go over the next 12 months if specific business conditions occur. These targets serve as a useful part of your valuation diagnostic process, but they differ significantly from current market pricing. While the market price reflects the amount investors pay today, the target reflects what one analyst thinks the stock is worth in a perfect future. You need a mental framework to separate these two concepts.
Data supports viewing these targets with skepticism. CXO Advisory research indicates that markets do not react to stock price targets as accurately as they react to other analyst information. Furthermore, the same research suggests analyst targets don't predict actual stock price potentials well due to optimism bias. Treating these numbers as guarantees risks poor investment decisions based on flawed predictions. Use them as reference points while conducting your own research.
Input and Model Breakdown
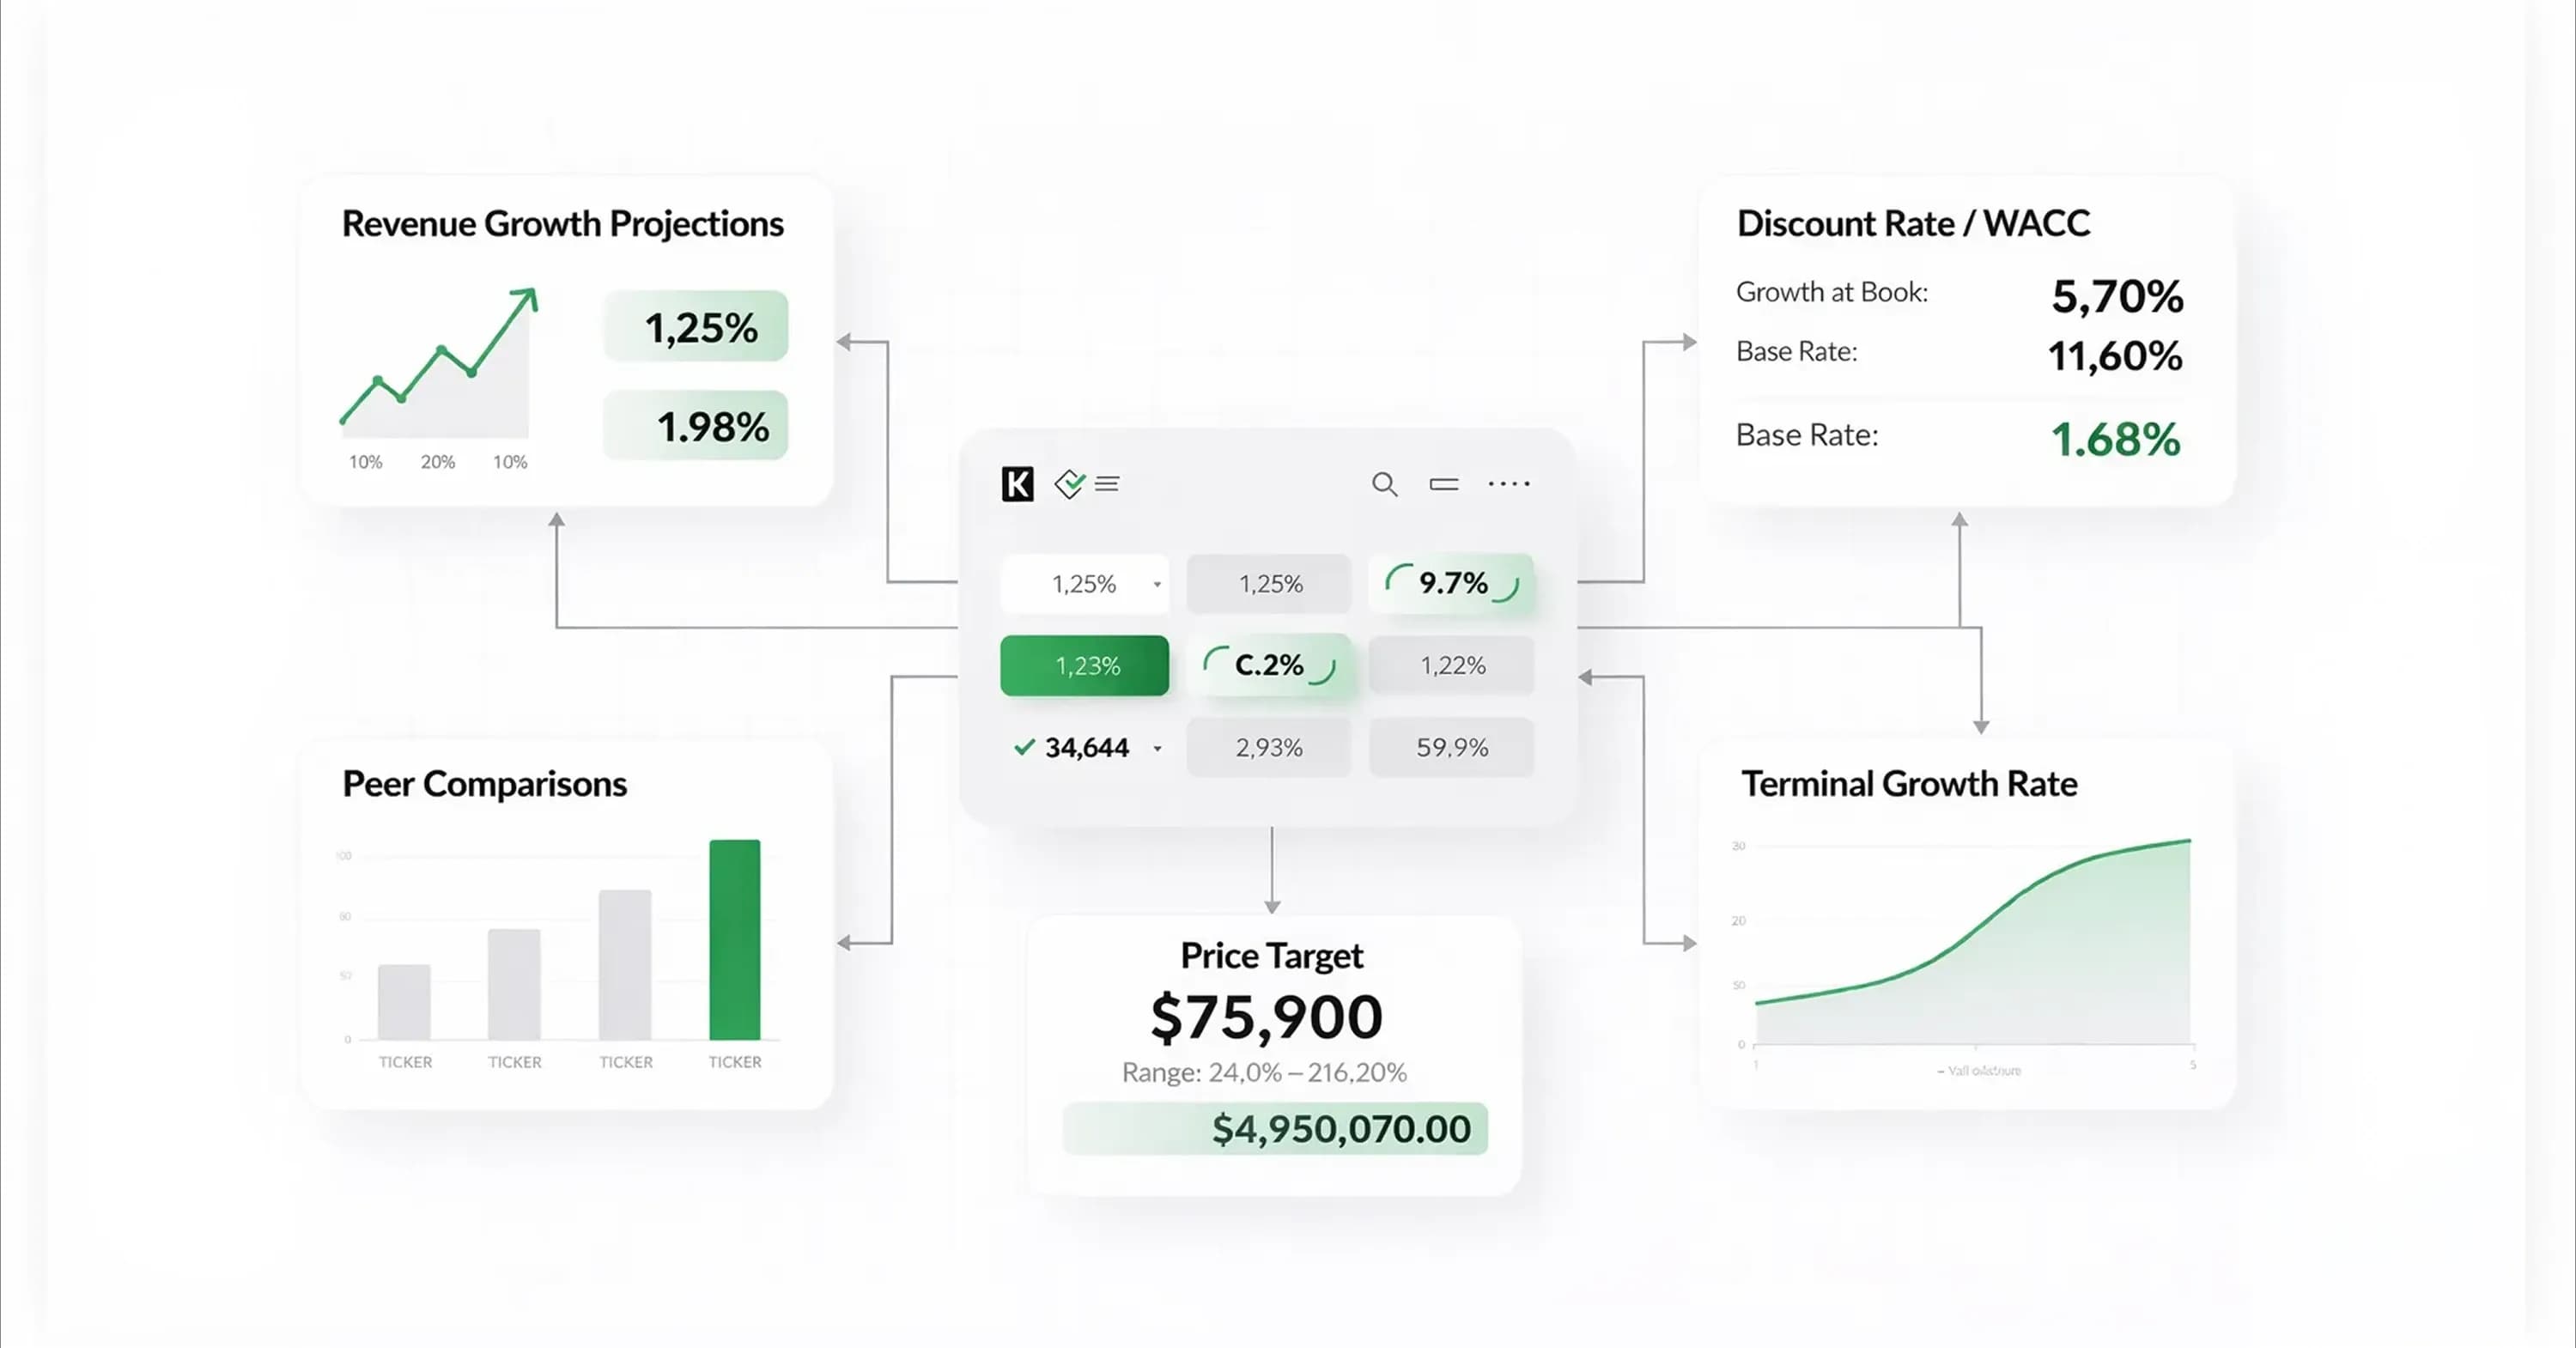
Analysts manufacture stock targets using complex financial models rather than intuition alone. These models rely on several inputs acting as a variable in the calculation, and even minor adjustments to these inputs can change the final number. Standard valuation models typically include the following assumptions:
-
Revenue growth projections estimate future sales.
-
Discount rates determine the present value of future cash flow.
-
Peer comparisons measure the stock against similar companies in the sector.
-
Terminal growth rates guess how the company will grow indefinitely.
Because these models rely on assumptions, they lack the precision suggested by specific dollar-and-cent targets. This lack of precision appears in how target price accuracy relates negatively to analyst optimism and stock-specific volatility.
Adjusting the terminal growth rate slightly changes the output drastically. This sensitivity to small changes creates an illusion of exactness. Recognize that these targets reflect the inputs used to create them, not necessarily the reality of the business. Beyond these model limitations, professional pressures also skew the numbers.
Herd Limitation and Career Risk
Wall Street analysts often cluster their targets together because they face significant professional pressure to stay near the consensus. This behavior stems from a powerful incentive structure known as career risk. Analysts risk their reputations if they predict prices far from the pack and fail. They remain safe if they err with everyone else.
Consequently, analysts often wait to update their targets until after the stock price moves. For instance, analysts delay updating stock price targets after bad news to maintain investment banking relationships. This lag means the target reacts to the price rather than predicting it.
Observe this pattern when performing a probabilistic analysis of a stock's history. Data shows that optimistic forecasts relative to the group increase analysts' chances of favorable career outcomes. Furthermore, the strategic timing of analyst recommendation revisions often occurs to enhance perceived stock picking ability. View clustered targets as a sign of safety-seeking behavior rather than independent agreement. This herd mentality limits the utility of these targets for individual investors seeking unique opportunities.
Cross-Check Workflow
Protect your portfolio from optimistic modeling errors by comparing professional consensus figures against your own valuation work. This process of triangulation requires treating the consensus as just one data point among many rather than the final verdict. When you understand the true analyst stock targets meaning, you realize these numbers essentially function as a second opinion to test your own logic. Maintain discipline by calculating an intrinsic value first, perhaps using a discounted cash flow (DCF) model. Only then look at what Wall Street predicts.
Evidence suggests skepticism is warranted during this comparison. Recent data shows that even six of 20 S&P 500 price targets were within 3% of actual returns, implying that the vast majority miss the mark significantly. Furthermore, while independent analysts perform slightly better than those at investment banks, their target prices are met 55.2% of time, which is barely better than a coin flip. Because stock targets are unreliable, use the comparison to categorize your investment thesis into one of two scenarios:
-
The Optimism Trap: The analyst target sits significantly higher than your calculated value. This suggests the market prices in a perfect execution scenario that your conservative model doesn't support. Wait for a pullback.
-
The Hidden Opportunity: The analyst target sits lower than your calculated value. This divergence implies the market missed a growth driver you identified, or you missed a significant risk factor professional analysts see. Once you understand these divergences, you can apply them to your filtering process.
Methodological Screener Usage
Most investors use a stock target screener incorrectly by filtering for the highest upside potential. This approach often leads to low-quality traps. Don't chase the biggest promised gains. Use these tools to find stocks where analysts disagree with each other. A wide dispersion in targets usually signals high uncertainty or a complex business model that the market struggles to value accurately. Research from the Yale School of Management indicates that consensus target prices forecast poorly actual returns, especially when that dispersion is high.
Identify these situations by looking for a high standard deviation among the targets for a single stock. This disagreement often creates divergence between the current price and the average target. Interpret this signal carefully. A UCLA study suggests that analyst forecast dispersion reflects genuine disagreement and strategic incentives rather than simple fundamental analysis. Consequently, stocks with high dispersion tend to result in very poor stock returns. View high disagreement not as a buy signal, but as a prompt to perform deep investigative work to understand why the professionals can't agree.
Psychological Pitfalls in Valuation
Even seasoned investors struggle to remain objective when they see a specific price target attached to a stock they own. The human brain suffers from anchoring bias, which causes you to fixate on the first number you see and measure all subsequent movements against it. For example, seeing a target of $150 makes a drop to $100 feel like a discount, even if the fundamentals have deteriorated. This bias persists. Research shows that first impression bias can influence analyst forecasts for up to six years, meaning the analysts themselves often struggle to update their views as facts change.
You also face the danger of false precision when relying on these figures. An analyst might publish a target of $47.23. That specific decimal point implies a level of accuracy that the underlying model can't provide. In reality, these targets often lag behind market reality. Microsoft's Stifel analyst cut the price target 27% from $540 to $392 only after the stock had already declined. If you use a stock target screener and blindly trust these precise-looking numbers, you risk holding onto a losing position while waiting for a recovery that the analyst has already abandoned.
Conclusion
Shift your mindset from being a passive consumer of Wall Street numbers to an active auditor of them. The true value of stock targets lies not in their predictive power, but in the gap between the analyst's number, the current market price, and your own calculated fair value. Treating these targets as diagnostic tools rather than answers protects your portfolio from false precision and herd mentality.
Stop guessing and start calculating. Use the InvestViable valuation tool to generate your own price targets in minutes and see how they stack up against analyst consensus.