
Three methods produce an equity risk premium and they do not agree. The historical approach averages the realized gap between stock and bond returns. Over 1928 to 2025 that gives 5.48 percent compounded or 7.03 percent as a simple average. The implied approach solves for the discount rate that reconciles index prices to expected cash flows, and stood at 4.23 percent entering 2026. Surveys ask investors what they use. Absent a reason to prefer otherwise, default to the most recent implied estimate. It is forward-looking, it forces no choice of historical window, and it avoids the survivorship problem in any realized series. Apply that premium to every company in the exercise and record the vintage.
What the equity risk premium is
The equity risk premium is the extra annual return an investor requires for holding equities rather than government bonds. It is the price of equity risk, expressed as a rate.
The additional expected return, above the yield on a government bond, that investors require as compensation for bearing equity risk.
The premium enters a valuation through the capital asset pricing model, where the cost of equity equals the risk-free rate plus beta times the premium. The discount rate and WACC walkthrough sets out that construction and the after-tax cost of debt beside it. Take the mechanics as given here. This article is about where the premium itself comes from.
Two things about that placement matter. The premium is market-wide, so it is the same quantity for every company in a market. Beta scales that market-wide risk to a particular business, and it measures nothing else. Company-specific risk sits outside both the premium and beta. It belongs in the cash flow scenarios, which is where the closing section puts it. Everything below is the mature-market premium, estimated on US equities against US Treasuries. A company exposed to a riskier market needs a country risk premium layered on top. That is a separate estimate with its own sources, set out in the walkthrough on valuing ADRs and foreign-listed stocks.
One property separates it from the other CAPM inputs. A Treasury yield is quoted, and the Federal Reserve publishes the 10-year constant maturity series daily. A beta is computed from observable returns. The premium is neither quoted nor computed from a single observable. It has to be estimated, and the estimate depends entirely on which question you decide to ask.
Why the number you pick decides the answer
Take three premiums that a careful analyst could defend, all sourced below. The implied estimate entering 2026 was 4.23 percent. The compounded historical premium over 1928 to 2025 was 5.48 percent. The simple average over the same window was 7.03 percent.
Run each through the same CAPM build-up, with an illustrative 4.3 percent risk-free rate and a beta of 1.1. That rate sits close to the 4.18 percent 10-year Treasury rate the January 2026 implied premium was solved against. The costs of equity come out at 8.95, 10.33 and 12.03 percent. Now discount the same cash flow stream with each. The stream is 100 next year, growing at 2.5 percent in perpetuity. Value it as 100 divided by the cost of equity less the growth rate.
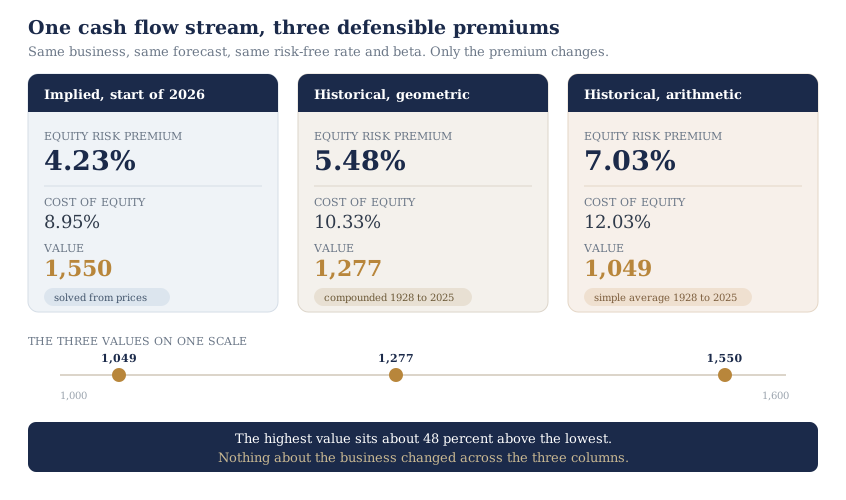
The values are about 1,550, 1,277 and 1,049. The highest sits about 48 percent above the lowest. The business did not change between those three columns, and neither did the forecast. Only the premium moved.
The spread also widens with the duration of the cash flows. Hold everything else and move terminal growth from 2.5 percent to 4 percent, and the same two ends produce a gap of 62 percent rather than 48. Drop growth to 1.5 percent and the gap narrows to 41 percent. A business whose value sits further out is more exposed to the premium you picked. It is the same reason a longer-dated bond moves more when its yield changes.
That spread is the reason this input deserves a section of its own rather than a default. It also sets the standard the rest of the article works to. The goal is not a correct premium, which does not exist, but a choice that can be audited.
The historical premium and what 98 years cannot settle
The historical approach is the most common and the easiest to describe. Take a long window and measure what stocks and government bonds actually returned. Treat the average gap as the premium investors have required.
Damodaran's historical returns dataset publishes annual returns for the S&P 500 and 10-year Treasury bonds back to 1928. Computed across the 98 years through 2025, the simple average of the annual gaps is 7.03 percent. The compounded gap, taken as the difference between the two compound annual growth rates, is 5.48 percent.
Two problems sit inside that pair of numbers.
The first is the convention. An arithmetic average is the mean of one-year premiums and answers a one-period question. A geometric average is the rate that compounds to the realized outcome, which is the question a multi-year discounted cash flow asks. The gap between them is 1.55 percentage points. Switching from the arithmetic premium to the geometric one raises the value by about 22 percent on the inputs above. State which one you used, because the two are not interchangeable.
The second problem is larger and less often mentioned. Annual equity premiums are extremely volatile, with a standard deviation of 20.82 percentage points across this window. That volatility does not average away as fast as the long window suggests. The standard error of the 7.03 percent estimate is about 2.10 percentage points. At 1.96 standard errors that puts a 95 percent interval at roughly 3 to 11 percent.
Read that interval carefully. Ninety-eight years of data is one of the longest reliable equity series available anywhere. It still cannot separate a 3 percent premium from an 11 percent one at conventional confidence. Any argument that turns on whether the premium is 5.0 or 5.5 percent is arguing inside the noise.
A third problem sits outside the statistics. The 98-year US series is the record of the market that, with hindsight, turned out to be among the most successful in the world. Markets that suffered expropriation, closure or hyperinflation are not in it. Damodaran's paper treats this survivorship problem as a standing objection to any historical estimate. A premium measured on the market that happened to survive and prosper plausibly overstates what an investor should expect next.
The window itself is also a choice, and a consequential one. Shorten it and the estimate moves sharply, because recent decades carry their own realized returns. A shorter window has a wider standard error, not a narrower one, so the apparent responsiveness is bought with less reliability, not more.
The implied equity risk premium
The implied approach inverts the problem. It does not ask what premium investors received. It asks what premium prices are paying.
The method takes the index level as given and forecasts the cash flows investors can expect from it. It then solves for the discount rate that equates the two. Whatever rate does that, less the risk-free rate, is the implied equity risk premium. Damodaran maintains this calculation annually and publishes the historical implied premium series.
Three properties follow from the construction. It is forward-looking, because it uses expected cash flows instead of realized returns. It needs no historical window, which makes it usable in markets with short or unreliable return histories. And it updates as often as you recompute it, because prices update. The series quoted below is the annual January vintage.
That last property is often mistaken for instability. In the published series the low is 2.05 percent, at the start of 2000. The high is 6.45 percent, at the start of 1980. It stood at 6.43 percent entering 2009, 4.24 percent entering 2022, and 4.23 percent entering 2026.
This premium moves in both directions against bond yields. It expanded from 4.24 to 5.94 percent across 2022 while the 10-year Treasury rate rose from 1.51 to 3.88 percent. It also compressed across 2024, falling from 4.60 to 4.33 percent while the 10-year rate rose from 3.88 to 4.58 percent. The 10-year closed both 2022 and 2023 at 3.88 percent, so that figure appears twice above for different years. A premium cannot be inferred from the rate environment. A model that holds it fixed while flexing the rate is making an assumption rather than avoiding one. That limitation is the open edge of the article on how interest rates flow into stock valuation. It computes its sensitivity with the premium deliberately frozen.
The implied approach has its own cost, and it is a real one. Solving for the rate that reconciles price to expected cash flows assumes the index is correctly priced in aggregate at the moment you solve. If the market is collectively mispricing equities, the implied premium inherits that error instead of revealing it. The estimate is internally consistent with prices by construction, so it cannot be used to argue that prices are wrong.
Survey premiums and what they measure
The third approach asks people. Surveys put the question to portfolio managers, chief financial officers or academics, and report the premiums respondents say they use.
The appeal is directness, and there is a legitimate use for the output. If most of the capital allocating against a market works from a premium near one level, that matters for how that capital will behave.
The limitations are well documented in Damodaran's equity risk premiums paper, 2026 edition, which is the standard reference for all three approaches. Survey responses track recent realized returns, rising after strong years and falling after weak ones. That is the opposite of how a forward-looking premium should behave. Dispersion across respondents is wide. And the framing of the question changes the answer, since respondents rarely distinguish arithmetic from geometric or name the risk-free rate they are working against.
There is also a definitional problem underneath the dispersion. Different respondents are answering about different things. Some report the premium their firm mandates. Others report a personal belief, or a figure carried over from an earlier model. The average of those is not an estimate of anything in particular.
Treat a survey premium as evidence about what other analysts assume. Do not treat it as an estimate of the premium itself.
Why the three disagree
The three methods are not competing measurements of one quantity. They answer three different questions, so agreement would be the surprise.
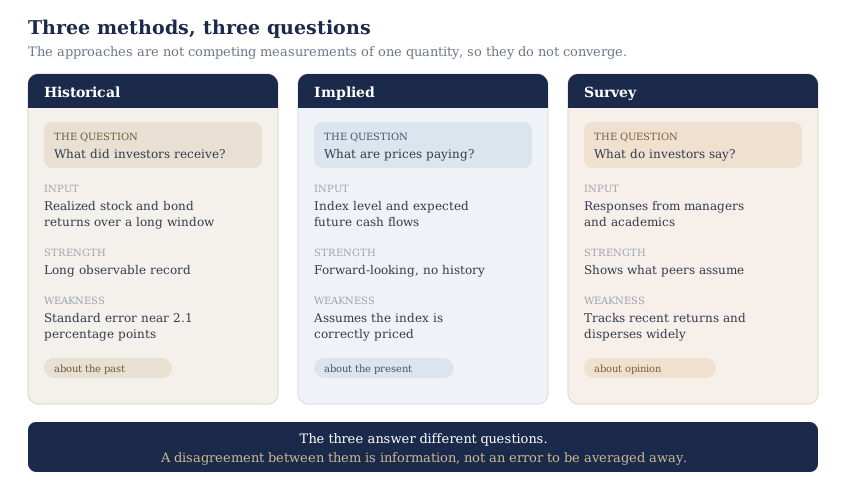
The historical and implied premiums describe different objects: one the past, one the price at the moment of estimation. A survey describes neither, only what practitioners report. No amount of better data will make three different objects converge.
That makes the gap between them diagnostic, not annoying. When the implied premium sits well below the historical average, prices are paying less for equity risk than they have on average. That is a statement about the market at that moment, not an error in either estimate. When it sits well above, the reverse holds. Either way the size of the gap measures how much of the valuation rests on the choice.
A wide gap is also a prompt to check your own horizon. A premium solved from prices is the right input when you are valuing against the opportunity set in front of you. A through-cycle premium is the better input when you are deliberately valuing a business as though the current pricing environment will not persist. The gap will not tell you which of those you are doing. It tells you the cost of getting it wrong.
Averaging the three destroys exactly that signal and replaces it with a figure nobody can source. Report the one you used.
Choosing a number and writing it down
No method returns a premium precise enough to defend to a decimal place. The discipline therefore sits in the selection, not in the estimate.
Four rules make the choice auditable.
Default to the implied estimate, and name the vintage. It looks forward instead of back. It forces no arbitrary choice of window, and it does not inherit the survival record of one unusually successful market. Those last two are structural weaknesses of the historical estimate, and the implied approach is free of both. Neither method escapes estimation error. It carries a cost of its own, the assumption that the index is priced correctly at the moment you solve it. That cost belongs to this method alone. A premium taken from history does not inherit the index's pricing error, which is why the gap between the two is readable at all. Treat it as a reason to keep a through-cycle premium in view, not as a reason to discount the implied estimate. The exception is a deliberate through-cycle valuation, where a geometric historical premium is the more honest input. A valuation that says the cost of equity is 9.5 percent tells a reader nothing. One that names the implied estimate published in a stated month and year, against a stated risk-free rate, can be checked and rerun.
Match the premium to its risk-free rate. A premium estimated against 10-year Treasury bonds belongs with a 10-year Treasury yield. Pair that premium with a bill rate and the term spread drops out, which understates the cost of equity. Pair a bill-based premium with a bond yield and the term spread gets counted twice.
Apply the same premium across the exercise. Using 4.5 percent for one company and 6 percent for another makes the two valuations incomparable. The difference between them reports your premium choice, not the businesses.
Record the figure, the source and the date. A premium without a source is not auditable six months later, including by the analyst who chose it.
How to apply this
Choose the method before you choose the number, then leave it fixed for the whole exercise. If the valuation turns on whether the premium is 5.0 or 5.5 percent, the estimate does not separate the cases. Report the answer as a range rather than a point.
Run the valuation at both ends of a defensible premium band and read the two values together. Make the band wide enough to span your two candidate methods, which excludes the arithmetic premium because it answers a one-period question. On the figures above, the implied and geometric historical estimates sit 1.25 points apart, so that is the width this article's own two candidates produce. It spans the two methods, not the estimation error, which on the historical series alone is wider than the band. Set the width from your own candidates instead of from a round one-point default. The sensitivity analysis method covers how to present the output. That band is easiest to run in a tool that exposes the rate directly. The InvestViable Valuator runs a discounted cash flow from user-set inputs. It takes the cash flow growth path, the expected return you demand as the discount rate, and the terminal growth rate. The premium you settle on here is one component of that required return, and the tool takes the rate you set instead of deriving it.
The premium is a market-wide input. Every holder of every stock works from the same underlying quantity, however differently they estimate it. It cannot on its own identify which company is mispriced. That work happens per company. The InvestViable stock screener screens 3,000+ US stocks on fundamentals and the Investment Score, and compares price against fair value alongside the Score. Two siblings cover the index-level version of this trap: the pillar article on what CAPE measures and where it fails, and earnings yield versus bond yield.
A last discipline, because this input invites the opposite. The premium is the standard compensation for equity risk in general. It is not the place to put a worry about one company's competitive position or accounting quality. Company-specific risk belongs in the cash flow scenarios, and residual estimation error belongs in the margin of safety applied afterwards. Loading all three into the discount rate charges for the same risk three times, and produces a value too low to act on.
InvestViable does not publish buy or sell recommendations on individual securities. All analysis is based on public financial data and a transparent methodology. The Investment Score formula is proprietary; the inputs and what the score evaluates are documented.