
Introduction
Investment research often presents a frustrating scenario during analysis. A discounted cash flow model values a stock at $75 per share, and a comparable company analysis yields $110, while the book value sits at $40. Three methodologies provide three contradictory answers for the exact same company. Most platforms sidestep this problem and present a single fair value estimate as though a definitive answer exists.
This divergence represents an inherent structural feature rather than a methodology flaw. For example, uncertain terminal assumptions drive 80% of the value in a discounted cash flow model. The massive spreads occur because different approaches measure different dimensions of value. These dimensions include forward-looking cash generation potential and current market consensus.
Below, we provide a framework to diagnose why these methodologies disagree and determine which approach deserves the most weight. Understanding this conflict improves the overall financial analysis.
Disclaimer: This article serves educational purposes only and does not act as investment advice. The text explains a research process and does not recommend buying or selling any securities.
Structural causes behind valuation output divergence
Each valuation approach asks a fundamentally different question about the same company, and different questions produce different answers.
A Discounted Cash Flow model asks what future cash flows a business will generate and discounts those projections back to today's value. Comparable company analysis asks what the market currently pays for businesses with similar characteristics. An asset-based approach asks what the underlying assets would fetch if separated from the operating business.
These three questions measure forward-looking cash generation potential, current market consensus, and tangible asset floors, respectively. Stock valuation methods that rest on different philosophical foundations land on different numbers even when analysts apply them with perfect mathematical precision to identical financial data. The divergence is not accidental. It is structural.
The gap widens further inside a single methodology. Within DCF alone, terminal value accounts for over 70% of enterprise value in most models. A small shift in the terminal growth rate or the discount rate reshapes the entire output. Professionals can agree on near-term revenue forecasts, apply the same multiples-based cross-check, and still land tens of percentage points apart because their long-run assumptions diverge. No amount of spreadsheet certainty eliminates this sensitivity.
Diagnosis of investment research disagreements
Sensitivity analysis acts as a diagnostic tool and reveals exactly which assumption is responsible for the gap between competing valuations. When a DCF suggests $50 per share and comparable company analysis suggests $100, the first task is not picking a winner. The first task is isolating the source of disagreement.
A structured diagnostic process systematically adjusts key inputs in each model to measure how much each assumption contributes to the total spread. A dedicated valuation tool processes this kind of investment research to help organize the exercise and keep assumptions transparent.
The following checklist helps pinpoint where valuation frameworks diverge:
-
For the terminal growth rate, analysts compare the assumed perpetual growth rate against long-term nominal GDP growth for the relevant economy. A terminal rate above 3-4% in a mature economy demands strong justification.
-
For the discount rate, investors test whether the Weighted Average Cost of Capital reflects the company's actual risk profile or borrows generic sector averages.
-
To check peer group composition, the process verifies that comparable companies share similar growth rates, margin profiles, and competitive positioning rather than just the same industry label.
-
To evaluate revenue trajectory, the diagnostic process checks whether near-term growth assumptions in the DCF align with the implied growth embedded in the trading multiples of selected peers.
This matters because assumption inputs drive the widest divergences more than methodology choice. Research that appeared in Management Science found that target prices correlate negatively with future returns when consensus dispersion is high. This dynamic means that wide disagreement among analysts signals uncertain assumptions rather than a reliable spread of independent estimates.
Framework weights based on business characteristics
Model weighting depends on matching the framework to the type of business, the quality of available data, and the intended holding period.
The equity research process focuses on selecting the model whose assumptions best align with the specific situation instead of finding the theoretically superior model. The following framework ranks how these three factors guide model selection:
-
Business characteristics shape model soundness. Stable businesses with predictable cash flow like utilities and consumer staples favor DCF because their forward projections rest on defensible historical patterns. Companies with clear publicly traded peers favor comparable multiples because market pricing aggregates informed consensus. Asset-heavy or distressed businesses favor asset-based approaches because tangible assets establish a valuation floor when future earnings are uncertain.
-
Data quality determines reliability. DCF requires dependable historical financials and defensible forward projections. When these do not exist in pre-revenue startups or companies that undergo restructuring, multiples that rely on actual market transactions become more trustworthy inputs across valuation models. The educational valuation materials help build judgment around when data supports a given approach.
-
The investment time horizon shifts the weighting. Long-term holders weight DCF more heavily because fundamentals and stock price tend to converge over years. Shorter-horizon investors weight market multiples because near-term exit values depend on market consensus. This distinction sharpens during bear markets, and discounted cash flow reliability increases because multiples compress rapidly during downturns and distort peer-based comparisons.
Construct triangulated view in investment research
Analysts miss the point when they select a single correct model. A more defensible approach builds a valuation range. Analysts run multiple methodologies in parallel, and then they weight the outputs based on the strength of the underlying assumptions.
This investment research process works in three stages:
-
Each model produces its own independent range and does not borrow inputs from the others.
-
Those ranges map against one another to reveal where they overlap and diverge.
-
Financial professionals review available evidence and assign probability weights to scenarios within each range based on how defensible the underlying assumptions are.
The overlap zone offers the most protection against analytical error because two or three models agree. The zones where models diverge sharply highlight the assumptions that carry the most uncertainty. Market participants find greater comfort in their conclusions because the triangulated range acknowledges uncertainty.
Implement equity research process independently
The equity research process breaks down when model inputs bleed into one another, so each methodology must run in isolation before any combination occurs.
A discounted cash flow model should derive its growth rates from the company's own financial history and forward-looking drivers instead of using the implied growth rate that peer trading multiples embed. Comparable company multiples should reflect actual observed market pricing instead of adjusted figures that analysts reverse-engineer to match a discounted cash flow output.
Professional acquirers combine models in a triangulated framework precisely because each method captures a different dimension of value. Professionals collapse those dimensions into a single muddled signal when they mix inputs before this stage. Pure models preserve the independent conviction that each method contributes to the final range, and this allows analysts to assign probabilities to valuation models.
Assign probabilities to valuation models
After each model produces its own range, financial analysts assign probability weights to the scenarios those ranges represent.
A base case reflects the most defensible set of assumptions and projections that recent operating trends and management guidance support. A bull case extends those assumptions optimistically but within plausible bounds. A bear case stress-tests them against adverse conditions, such as margin compression or revenue deceleration. The quality of each scenario determines its probability weight.
If near-term cash flows are predictable but terminal assumptions are speculative, the base case model carries more weight in the near term while the comparable multiples anchor the longer-term range. Probability weights are not permanent. They shift as new data confirms or undermines specific assumptions, and analysts use these weights to apply safety margins to valuation techniques.
Apply safety margins to valuation techniques
As a final step in this procedure, analysts apply a margin of safety to the probability-weighted range, and the size of that margin scales with the degree of model disagreement.
When a discounted cash flow, comparable multiples, and asset-based approach converge within a narrow band, the assumptions behind each model reinforce one another. A 15% margin of safety assumes roughly ±15% valuation estimate error and provides adequate refuge for stable businesses where models agree.
When models diverge by 50% or more, that spread signals deep assumption uncertainty, and the required buffer expands to 30% or higher. The margin of safety is not arbitrary conservatism. It functions directly as a result of how much disagreement the triangulation process surfaced. Wider divergence means less certainty about which assumptions will prove correct, and less certainty demands a larger discount before professionals commit capital.
Real-world valuation divergence examples
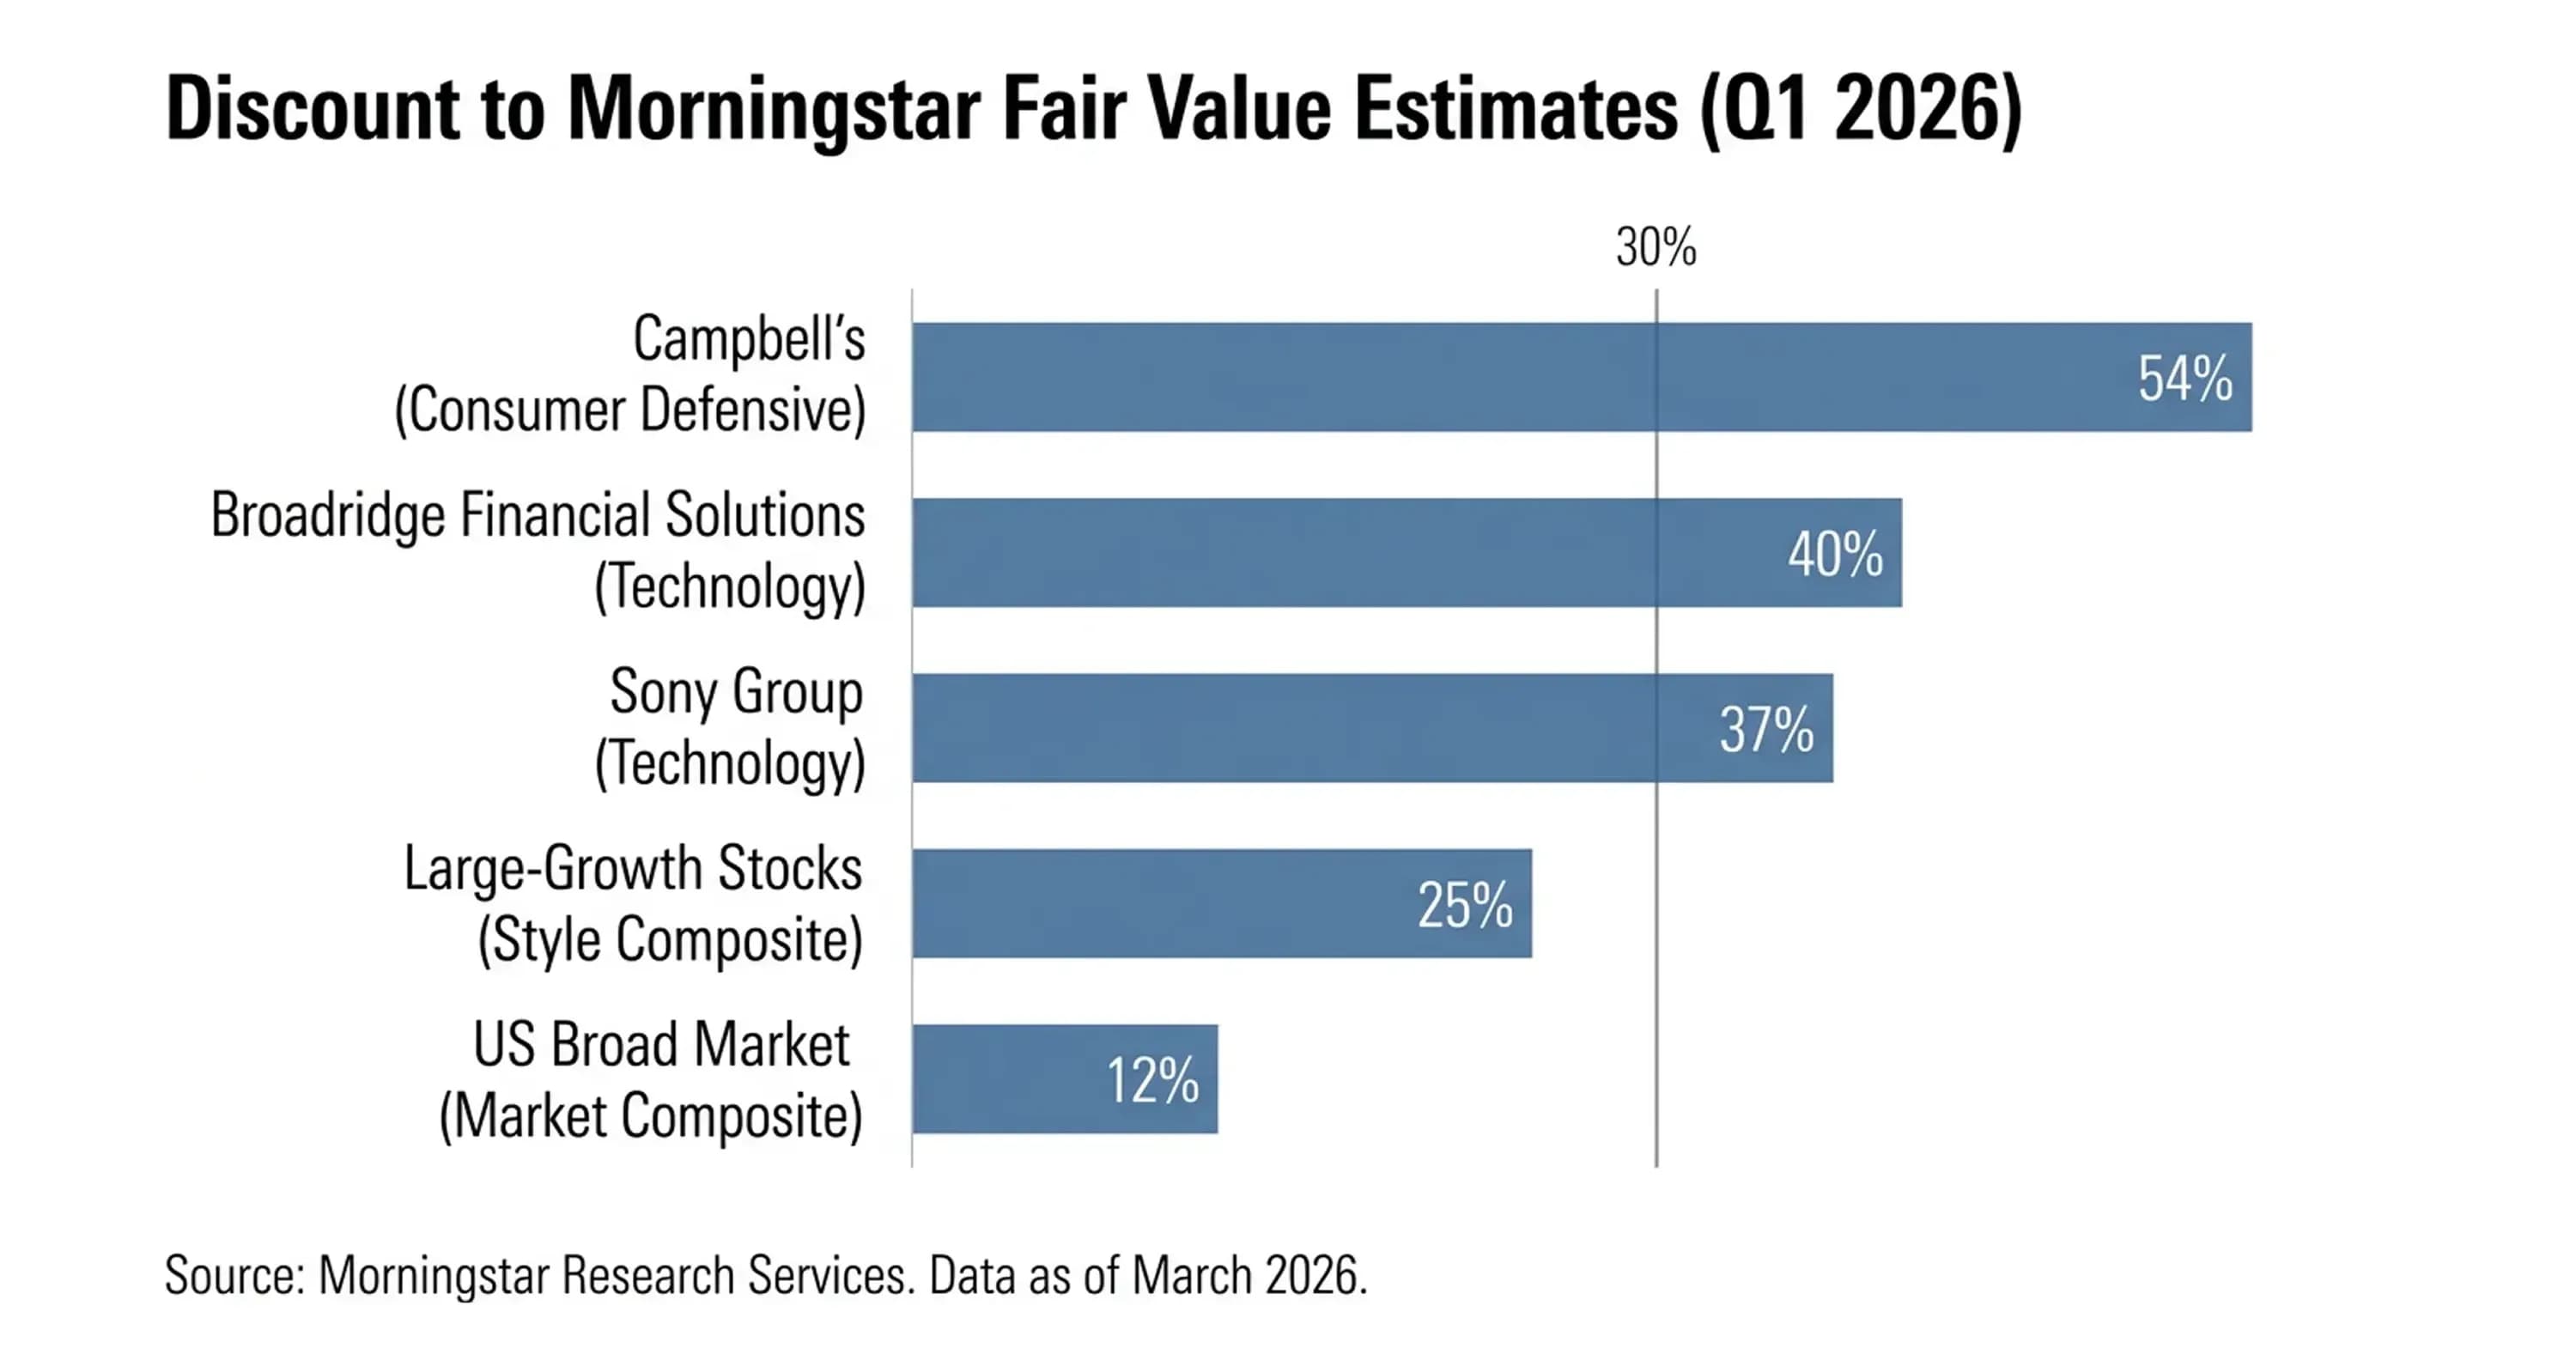
Current market conditions illustrate exactly how competing methodologies produce the kind of investment research divergence this framework interprets. The following examples show how DCF fair value estimates and market-implied multiples diverge across sectors as of Q1 2026.
-
US broad market: Morningstar calculated that the US equity market traded at a 12% discount to its composite fair value estimates as of March 23, 2026. However, this discount was heavily skewed by mega-cap stocks. The Q2 2026 outlook noted that if Nvidia, Alphabet, and Broadcom were excluded, the rest of the market traded close to fair value at a price/fair value ratio of 1.0.
-
Technology sector: The same Morningstar Q2 outlook identified technology as one of the most undervalued sectors, with large-growth stocks at a 25% discount to fair value estimates. Software names dropped sharply from recent highs. DCF models that relied on recurring revenue streams and high gross margins produced fair values well above current prices, while comparable multiples compressed because AI disruption fears pressured the entire peer group downward.
-
Broadridge Financial Solutions: This stock traded at a 40% discount to Morningstar's fair value estimate of $290 per share as of March 18, 2026. A DCF model that projected stable fee-based revenue justified that $290 figure. Market multiples reflected broader financial-sector selling pressure rather than company-specific deterioration.
-
Sony Group: Sony traded 37% below Morningstar's fair value estimate of $32.50 per share. A DCF model valued Sony's diversified revenue streams across gaming, music, film, and electronics. Comparable multiples compressed because consumer electronics peers faced commoditization pressure that did not apply equally to Sony's content businesses.
-
Campbell's: The stock traded at a 54% discount to Morningstar's fair value estimate of $60 per share as of February 2026. A DCF model valued the company's portfolio shift toward snacks (now over 40% of sales) and projected stable cash flows. Market multiples priced the stock as a declining legacy brand. The gap reflected competing narratives about whether the portfolio transformation would hold.
Conclusion
To summarize, conflicting valuation outputs represent a diagnostic signal rather than a calculation error, and the strongest investment research process treats them as exactly that. The discipline lies in the identification of why models disagree, the assignment of probability weights based on business characteristics, and the calibration of safety margins that scale with assumption uncertainty. Investors who treat divergence as information rather than noise build conclusions that single-model reliance cannot match.
InvestViable supports this process with transparent valuation models that expose the reasoning behind each output. To apply this framework to your own research, explore InvestViable's valuation tools and build decisions on a foundation you can verify. 19: