
InvestViable does not publish buy or sell recommendations on individual securities. All analysis is based on public financial data and a transparent methodology. The Investment Score formula is proprietary; the inputs and what the score evaluates are documented.
Why feature-grid comparisons fail the analyst
The market for stock analysis websites is crowded. Platforms differentiate themselves on attributes that fit into a comparison table: stock universe coverage, real-time pricing freshness, watchlist capacity, mobile applications, news-feed integrations, social sentiment dashboards, and increasingly on the inclusion of large-language-model commentary. Marketing pages emphasize these attributes because they are easy to count, easy to display, and easy to differentiate without exposing the analytical layer underneath.
The analytical layer is the layer the investor is actually paying for. A platform that displays a fair-value estimate, an investment score, or a forward-return projection is making an analytical claim about a security, and the claim is only as good as the methodology, the data inputs, and the disclosure regime behind it. Two platforms can display the same ticker with different intrinsic values because of choices made at the analytical layer that the comparison grid never surfaces. The same dynamic is documented in detail in why valuations differ across platforms for the same ticker: share-count definition, time-period normalization, GAAP versus adjusted treatment, and restatement layering all shift the displayed output without changing the interface.
A useful evaluation framework asks a different set of questions. It asks how the analytical claim is constructed, where its inputs came from, what accounting interpretations sit between the filing and the output, whether the chain from output back to input is visible, what forward assumptions the model depends on, and whether the platform's economic position is independent of the outputs it produces. Those six questions are the rubric this article documents. They do not produce a ranking. They produce a documented assessment of which stock analysis websites the investor can trust as analytical inputs and which need to be demoted to lead-generation or screening signals.
The framework deliberately overlaps with the AI-versus-traditional analysis debate without resolving along that axis. The rubric is methodology-agnostic; an algorithmic platform can pass it, a fundamental-analysis platform can pass it, and a hybrid platform can pass it, as long as the equity research methodology behind the displayed output is disclosed at the level required for the investor to verify it.
The six-check evaluation rubric for stock analysis websites, by category
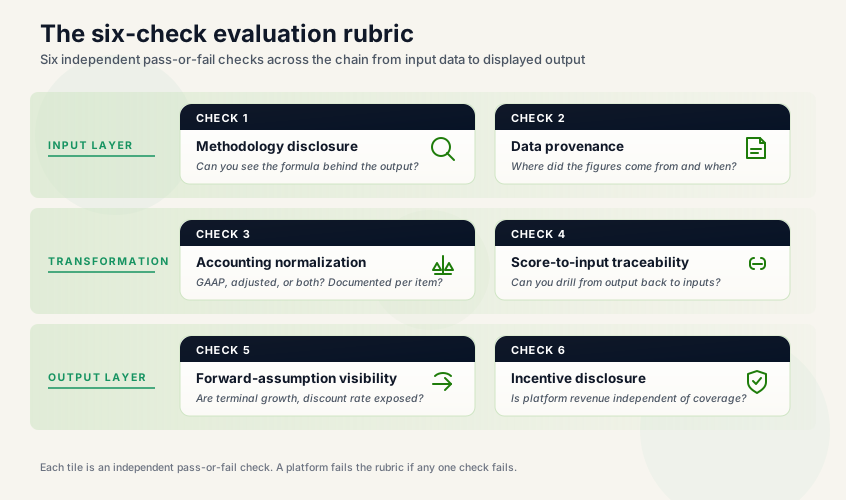
The rubric covers six verification checks. Each check answers a specific question about the analytical layer of a stock analysis website, and each check produces a binary pass-or-fail signal once the question is run against the platform's documentation, the platform's per-ticker output, and the platform's regulatory filings.
The checks are ordered by where they sit in the chain from input to output, not by how difficult they are to run. Methodology disclosure and data provenance sit at the input end of the chain. Accounting normalization and score-to-input traceability sit at the transformation layer. Forward-assumption visibility and incentive disclosure sit at the output end. A platform can pass the input-end checks and fail the output-end checks; the rubric does not collapse the chain into a single composite score because each link in the chain is independently necessary.
Figure 1. The six-check evaluation rubric for stock analysis websites
The six checks the investor runs on any analysis platform before its outputs are allowed to influence a position. Checks are grouped by where they sit in the chain from input to output.
Use the rubric as a verification overlay, not as a substitute for understanding the business under analysis. A platform can pass all six checks and still display an intrinsic value the investor disagrees with after running the underlying inputs through an independent model. The rubric's purpose is to identify which platform outputs are inputs and which platform outputs are conclusions; it does not tell the investor what the right conclusion is.
Methodology disclosure and data provenance: where the analysis comes from
The two input-end checks ask whether the platform's analytical claims are anchored in documented logic and traceable data sources, or whether the displayed outputs are presented as conclusions without the supporting chain.
Check 1 covers methodology disclosure, which is the question of whether the equity research methodology behind the platform's headline outputs is documented at a level the investor can verify. For a platform that displays fair-value estimates, the methodology disclosure should specify the valuation framework (discounted cash flow, multiples, asset-based, residual income, or a composite), the model structure (single-stage growth, two-stage, three-stage), the input categories (revenue growth path, margin trajectory, discount rate, terminal value structure, share count), and the company-categorization rules that determine which framework applies to which issuer. The CFA Institute Research Foundation's equity asset valuation literature sets the substantive standard for what constitutes adequate disclosure at this level. A platform that documents its methodology only as "proprietary multi-factor model" without specifying the input categories or the model structure has failed Check 1; the analytical output cannot be verified against an undocumented model.
Check 2 covers data provenance, which is the question of where each fundamentals figure on the platform came from and when. The primary filing for U.S.-listed equity issuers is the 10-K or 10-Q on SEC EDGAR; for foreign private issuers, the 20-F; for non-U.S.-listed companies, the equivalent regulator. Every fundamentals figure on every analysis website should trace back to a specific line item on a specific filing. The provenance check asks whether the platform discloses the source filing for each headline figure, the as-of date for each figure, the basis (audited or pre-filing estimate), and the freshness window (how stale the figure is allowed to become before the platform updates it). The discipline parallels the equity market data infrastructure audit that documents how data quality issues compound when provenance is not surfaced.
For algorithmic platforms, the same two checks apply with vocabulary adjustments. Methodology disclosure becomes the disclosure of the feature set the model trains on, the training-period window, the backtest methodology, and the live-deployment regime. Data provenance becomes the disclosure of the feature-source files, the data-vendor chain, and the point-in-time integrity of the training inputs. The standard does not soften because the model is algorithmic; if anything, the standard tightens because the model's outputs are harder to audit against intuition alone. Algorithmic platforms that disclose neither the feature set nor the training window have failed Check 1 and Check 2 simultaneously.
Accounting normalization and score-to-input traceability: how the analytical chain holds together
The two transformation-layer checks ask what happens to the data between the filing and the displayed output, and whether the chain from any displayed output back to its constituent inputs is visible to the investor.
Check 3 covers accounting normalization, which is the question of how the platform handles the gap between audited GAAP figures and management-defined "adjusted" or non-GAAP figures. SEC Regulation G requires non-GAAP measures to be reconciled to their nearest GAAP equivalent in regulatory filings, but the regulation does not constrain which items management chooses to exclude. Common exclusions include stock-based compensation, restructuring charges, amortization of acquired intangibles, and impairments; for issuers with significant exclusions, the GAAP operating margin and the adjusted operating margin can differ by several percentage points. The normalization check asks whether the platform discloses which version of the operating figures feeds its analytical models, whether the platform offers the investor the option to switch between the GAAP and adjusted views, and whether the normalization rules are documented for each adjustment category. A platform that displays a single "operating margin" figure without disclosing whether it is the GAAP or adjusted version has failed Check 3.
Check 4 covers score-to-input traceability, which is the most frequently failed check in practice. A platform can disclose its methodology in plain language and still hide the specific inputs that produced any given displayed score. The investor sees an investment score, a fair-value estimate, or a buy-sell-hold signal; the platform offers no way to drill from that output back to the revenue growth rate, discount rate, terminal value assumption, or share count that produced it. The investor cannot disagree with the conclusion because there is no chain to disagree with. The substance of the check is whether the platform exposes its valuation model templates, the input field labels, the input values, and the sensitivity of the output to each input. Aswath Damodaran's published valuation work treats input transparency as a precondition for any defensible intrinsic-value estimate; the score-to-input traceability check is the operational test of that principle on a retail-facing platform.
Figure 2. Score-to-input traceability: opaque platform versus transparent platform
Two chains from displayed output back to inputs. The opaque chain hides the inputs behind a black-box score. The transparent chain exposes the input field labels, the input values, and the primary-source filing each input ties back to.
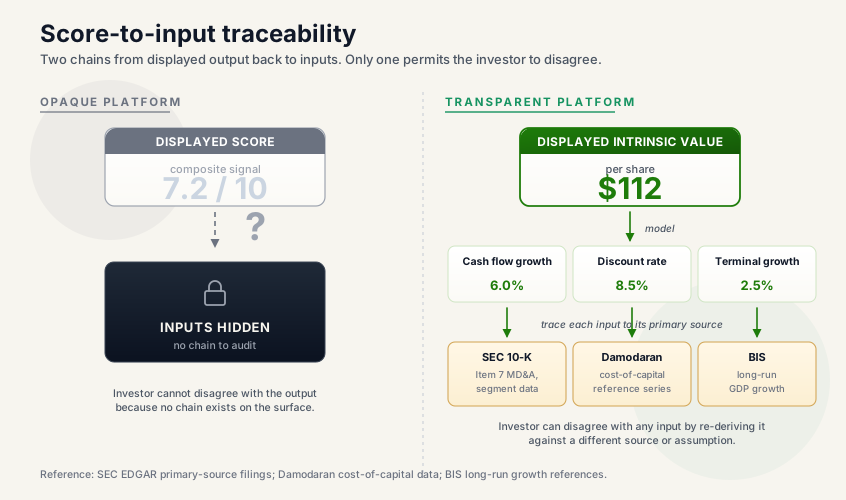
One approach to exposing the chain is what the Valuator on Invest Viable does today: it surfaces three forward-looking inputs (cash flow growth path, discount rate, and terminal growth rate) the user can override directly on the displayed intrinsic value. Override is a partial form of traceability; the full drill-down the rubric describes adds per-input sensitivity disclosure and source justification on top. The same principle applies to any platform that publishes valuation outputs; the rubric does not require the platform to be Invest Viable's, only to expose the chain.
Forward-assumption visibility and incentive disclosure: what determines whether the conclusion is independent
The two output-end checks ask whether the platform exposes the forward-looking choices that drive its conclusions, and whether the platform's economic position is independent of the analytical outputs it publishes.
Check 5 covers forward-assumption visibility, which is the question of whether the platform discloses the forward-looking assumptions that drive its valuation outputs. For any discounted cash flow model, the terminal value typically accounts for over seventy percent of enterprise value, and a small shift in the terminal growth rate or the discount rate reshapes the entire output. The visibility check asks whether the platform exposes the terminal growth rate it applied, the discount rate it applied, the explicit-forecast-period length, the fade assumption (if any), and the source justification for each. For algorithmic platforms, the equivalent check asks whether the platform exposes the forward-projection horizon, the regime-stability assumptions, and the conditions under which the model's outputs are expected to break down. A platform that displays a forward fair-value estimate without disclosing the assumed terminal growth rate has failed Check 5; the investor cannot evaluate whether the forward conclusion is defensible without seeing the dominant assumption.
Check 6 covers incentive disclosure, which is the question of whether the platform's economic position is independent of the analytical outputs it produces. Three structural incentives commonly distort retail-facing analytical platforms. First, the platform may earn revenue from the issuers it covers (sponsored research, paid listings, advertising tied to specific tickers); the SEC Form ADV and the CFA Institute Code of Ethics and Standards of Professional Conduct set the framework for what constitutes adequate disclosure of these arrangements. Second, the platform may earn revenue from order flow generated by users acting on its signals, in which case the platform has a structural interest in signal turnover that may not align with the investor's holding-period horizon. Third, the platform's parent company may hold positions in the issuers covered, creating a research-independence question governed by the conflict-management rules in the relevant jurisdiction. The check asks whether each of the three structural incentives is disclosed at the per-ticker output level, not buried in a terms-of-service document. A platform that runs paid sponsorship on specific tickers without per-ticker disclosure has failed Check 6, regardless of whether the underlying analysis is otherwise sound.
The two output-end checks pair: Check 5 asks whether the forward assumptions are visible, Check 6 asks whether the conclusions built on those assumptions are independent. A platform that exposes its forward assumptions but earns sponsorship revenue on the same tickers has passed Check 5 and failed Check 6. A platform with documented research independence but hidden forward assumptions has passed Check 6 and failed Check 5. The rubric treats them as separate links in the chain because they fail independently in practice.
How to apply this rubric on any stock analysis website
The six-check rubric works as a platform-selection gate the investor runs before letting any stock analysis website's outputs influence a position. The application is the same whether the platform is a retail-facing aggregator, an institutional-style terminal accessible through a retail tier, an algorithmic signal service, or a hybrid combining fundamental and algorithmic outputs.
The platform-selection workflow runs in five steps:
- Pull the platform's methodology and disclosure documents. Read the methodology page, the terms of service, the privacy policy, and the most recent SEC filings (Form ADV if the platform is a registered investment adviser, the relevant prospectus or terms if the platform is a publisher). Compile the disclosures into a single working document.
- Run the input-end checks. For Check 1, document whether the methodology disclosure specifies the model structure and input categories at a level the investor can verify. For Check 2, pick three test tickers (a large-cap U.S. issuer, a mid-cap, and a foreign private issuer) and trace the platform's headline figures back to the primary filing on EDGAR for each.
- Run the transformation-layer checks. For Check 3, identify how the platform handles GAAP versus adjusted operating figures and whether the choice is documented. For Check 4, attempt to drill from a displayed output back to its constituent inputs for each of the three test tickers; document where the chain breaks.
- Run the output-end checks. For Check 5, document the forward-looking assumptions the platform discloses on its per-ticker outputs. For Check 6, document the platform's revenue model and any per-ticker sponsorship or order-flow arrangements.
- Score the platform. Pass-fail on each of the six checks. A platform that passes all six produces outputs the investor can treat as inputs to a valuation decision. A platform that fails one or more checks produces outputs that need to be re-derived against primary filings before they can carry weight; those outputs are still useful as lead-generation or screening signals, but they are not analytical inputs.
The output of running the rubric is rarely a verdict that one platform is universally better than another. It is a documented assessment of which platform outputs survive the chain from input to conclusion intact. Platforms that pass earn the right to feed into the downstream valuation workflow described in how to decide which valuation model to trust when investment research produces conflicting results; platforms that fail still have a role, but upstream of the valuation conclusion, as lead-generation or screening signals.
Once the platform-selection gate is passed, the analyst applies the safety checklist to the business itself to disqualify structurally flawed issuers, then runs the shares screener filtering workflow against a defined strategy. A point-estimate intrinsic value sourced from a platform that has not been run through the rubric is the artifact of inherited trust. A range of intrinsic values sourced from platforms that pass the rubric is the artifact of a discipline.