
InvestViable does not publish buy or sell recommendations on individual securities. All analysis is based on public financial data and a transparent methodology. The Investment Score formula is proprietary; the inputs and what the score evaluates are documented.
Why a tool stack beats a single best-of-breed platform
The pull toward a single platform is structural. Marketing pages for retail-facing analytical platforms emphasize feature breadth: a screener, a valuation tool, a watchlist, a news feed, and increasingly a language-model assistant, all bundled behind one subscription. The bundling resembles consolidation, but consolidation only helps the workflow if the bundled tools each meet the analytical bar required for their layer in the workflow. They typically do not, because the optimization criteria for each layer pull in different directions.
A universe filter wants breadth, filter expressiveness, and clean handling of edge cases like dual-class shares, special-purpose acquisition companies, and recent restructurings. A fundamentals verifier wants traceability to the primary filing and point-in-time data integrity. A valuation engine wants input transparency and sensitivity exposure, not opinionated output presentation. A margin-of-safety calibrator wants calibration discipline tied to forecast reliability rather than a fixed percentage. A monitoring layer wants programmable triggers tied to the original thesis, not a generic price-alert mechanism. The bundled platforms that win on marketing-page feature counts often produce weak performance on three or four of the five layers because their internal design optimizes for the bundle, not the workflow.
A valuation-first tool stack accepts that no single instrument optimizes for all five tasks. The discipline is to specify each layer's analytical purpose, define the minimum capability the tool occupying the layer must offer, and accept the integration overhead that comes with using the right instrument at each step. The stack is methodology architecture, not a marketing pitch. The discussion that follows defines each layer and the failure mode that emerges when the layer is missing or weak, and is intentionally agnostic about which retail-facing analytical platform a reader chooses to fill each slot.
The five-layer stocks tools stack at a glance
The stack runs from the broad universe at Layer 1 down to an open position at Layer 5, with each layer narrowing the candidate set and tightening the verification standard. The layers are sequential rather than parallel; an issuer that fails at Layer 2 does not reach Layer 3, and an output at Layer 3 that fails Layer 4 does not produce an action. The flow is what makes the stack a workflow rather than a collection.
Figure 1. The five-layer valuation-first stocks tools stack
Each layer narrows the candidate set or tightens the verification standard before the next layer runs. An issuer that fails one layer does not reach the layers below it.
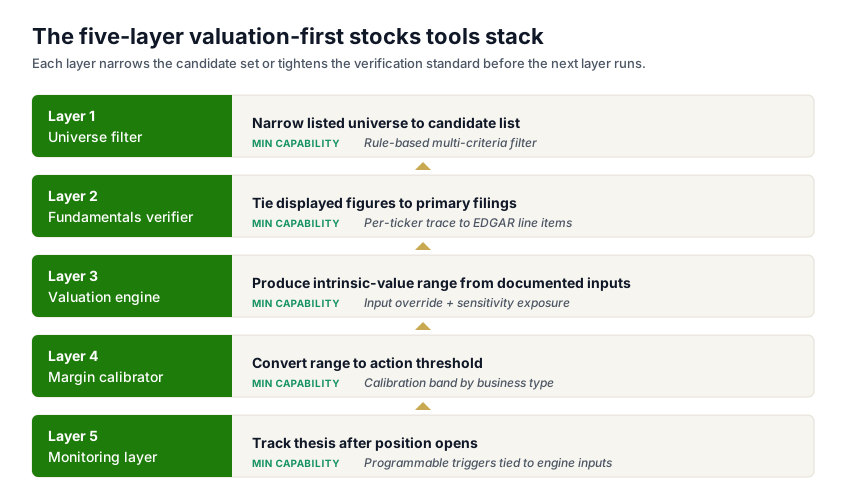
The reason the stack is portable across methodologies is that the five layers describe analytical functions, not specific tool implementations. Layer 1 is whatever filter narrows the listed universe; Layer 2 is whatever check ties displayed figures back to a primary source; Layer 3 is whatever engine produces a quantitative output from documented inputs; Layer 4 is whatever rule converts a range or distribution into an action threshold; Layer 5 is whatever mechanism tracks the analytical thesis after capital is deployed. The functions persist; the tools change. The CFA Institute literature treats this layered separation as foundational to a defensible investment process; the CFA Institute Research Foundation publications on equity asset valuation develop the same separation in academic form. The stack below is the practitioner-facing instance of the same logic.
Layers 1 and 2: the input layers
The two input-end layers determine which candidates enter the analytical pipeline and whether the figures that describe them are verifiable. They run together because a candidate cannot be properly evaluated by the downstream layers if its displayed fundamentals are not anchored in the filing record.
Layer 1 is the universe filter. The listed universe contains thousands of issuers; the analyst's working candidate list contains tens to low hundreds. The filter that closes the gap must support multi-criteria queries on financial structure, valuation level, sector, capitalization, and style, and must handle the edge cases that break naive screens: dual-class shares with different voting rights, recently spun-off entities with limited history, foreign private issuers reporting under non-GAAP frameworks, and special-purpose acquisition companies that report against trust assets rather than operating fundamentals. The InvestViable stock screener is one instance of the layer; a value-investing analyst running the filter against value-style screens gets a candidate list narrowed by the style rule, and a sector-rotation analyst running the same screener with sector parameters gets a different list narrowed by the sector rule. The same workflow logic applies to any screener the analyst uses; the layer requires that the filter is rule-based and the output candidate list is reproducible from the filter parameters.
Layer 2 is the fundamentals verifier. Every fundamentals figure displayed on every downstream tool should trace back to a specific line item on a specific filing, with a documented as-of date and a documented basis (audited or pre-filing estimate). The verifier layer is the discipline of running that trace on a documented sample of candidate tickers before the figures are allowed to feed the valuation engine. For U.S.-listed issuers the primary source is the 10-K or 10-Q on SEC EDGAR; for foreign private issuers, the 20-F. The verifier check covers the items most prone to platform-to-platform divergence: the share count definition, the treatment of stock-based compensation in operating expense, the GAAP versus adjusted operating margin, and the restatement history. The shares screener filtering valuation workflow documents the screening-side handoff to this verifier layer; the verifier itself is the next link in the chain. A missing verifier layer is the most dangerous gap in the stack because the absence is invisible: the valuation engine produces precise outputs on inputs that were never audited.
Layer 3: the valuation engine, the analytical core of the equity analysis toolkit
The valuation engine is where the candidate's verified inputs are converted into an intrinsic-value range. The engine sits at the center of the equity analysis toolkit because the layers above it deliver verified inputs and the layers below it act on the engine's output; a stack with a weak engine reduces every other layer to noise.
The engine's analytical bar is input transparency. The investor must be able to see the cash flow growth path the engine applied, the discount rate it applied, the terminal growth rate it applied, and the share count it divided by, and must be able to override each input and watch the displayed intrinsic value change in response. An engine that displays a fair-value point estimate without exposing its inputs is the artifact of inherited trust; an engine that exposes its inputs and lets the analyst override them is an instrument. Aswath Damodaran's published valuation work treats input transparency as a precondition for any defensible intrinsic-value estimate; the engine layer is the operational expression of that principle inside the workflow. The DCF inputs checklist covers the six categories of inputs that the engine must surface and the verification questions the analyst runs against each category before the engine output enters the next layer.
Figure 2. Where the engine inputs come from in a valuation-first workflow
The valuation engine sits between verified fundamental inputs (Layer 2) and the margin-of-safety calibration (Layer 4). Each engine input ties back to a primary or reference source.
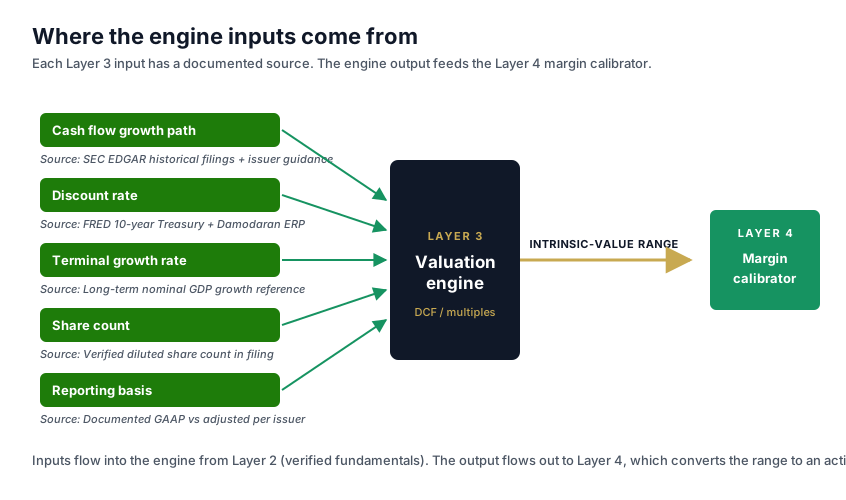
The engine layer is also where the workflow exposes its sensitivity profile. A small change in the discount rate or the terminal growth rate reshapes the engine's output; the current 10-year Treasury yield on FRED is the canonical anchor for the risk-free-rate component, but the equity risk premium, the beta estimate, and the after-tax cost of debt all flow into the discount-rate input separately, and each of them shifts the engine's output. A valuation engine that hides the sensitivity profile leaves the analyst unable to evaluate which input is driving the conclusion. The InvestViable Valuator surfaces three model inputs the user can override directly on the displayed intrinsic value: the cash flow growth path, the discount rate, and the terminal growth rate. The override surface is the engine's testable promise; the wider methodology principle is that any engine, on any platform, must expose its assumption set to the analyst running it. The valuation methods DCF guide develops the methodology underneath this layer at the level of detail the engine implementation needs to honor.
Layers 4 and 5: the output layers
The two output-end layers convert the engine's range into an action threshold and then track the action's analytical assumptions through time. They run together because a margin threshold without a monitoring layer is a one-time decision; a monitoring layer without a margin threshold is a watchlist without an entry rule.
Layer 4 is the margin-of-safety calibrator. The engine produces an intrinsic-value range, not a single number; the calibrator converts the range into a maximum-acceptable price by applying a discount calibrated to the forecast reliability of the underlying business. A stable utility business gets a smaller margin than a high-growth software issuer because the forecast inputs at Layer 3 are more reliable for the utility than for the software issuer. The discipline is documented in the margin of safety operational definition, which translates the principle into a percentage calibrated to business type rather than a fixed thirty-percent rule. The calibrator tool at this layer can be as simple as a spreadsheet that takes the engine's central estimate and the analyst's calibration band and produces the threshold; the tool's analytical role is to make the calibration explicit and reproducible, not to automate the judgment.
Layer 5 is the monitoring layer. Once the position is opened against the documented thesis at Layers 1 through 4, the monitoring layer tracks whether the inputs the thesis depended on are still holding. A monitoring layer is not a watchlist with price alerts; a watchlist alerts the analyst when a number moves, and the analyst has to decide whether the move matters. A monitoring layer alerts the analyst when one of the original thesis inputs has shifted enough that the engine's range, the calibrator's threshold, or the safety-checklist verdict needs to be re-run. The trigger conditions are written at thesis time and stored alongside the position; the monitoring layer fires the trigger when the condition is met. The downstream workflow when a trigger fires is to run the resolution discipline for conflicting investment research results against the new information and decide whether the thesis still holds, whether it needs revision, or whether the position should be closed.
How to assemble your fundamental analysis toolkit
The assembly of the fundamental analysis toolkit is a five-step exercise that the analyst runs once and revisits when any layer's tool changes. The exercise is documented as a personal record so the analyst can audit the workflow when an open position misbehaves and identify which layer let the misjudgment through.
The five assembly steps are sequential. Define the universe filter at Layer 1 by specifying the filter parameters, the rebalance frequency, and the edge-case treatment for dual-class shares, foreign private issuers, and recent spin-offs. Define the fundamentals verifier at Layer 2 by specifying the sample of tickers that get the full trace to the primary filing and the cadence of the verification. Define the valuation engine at Layer 3 by specifying which engine the toolkit uses, which inputs the engine exposes, and which inputs the analyst overrides versus accepts as defaults. Define the margin-of-safety calibrator at Layer 4 by specifying the calibration bands by business type and the trigger threshold for an actionable price. Define the monitoring layer at Layer 5 by specifying the thesis-trigger format and the cadence of the monitoring review. The result is a written architecture the analyst can hand to a colleague and have the colleague reproduce the workflow against the same candidate.
The same architecture supports both the deep-dive workflow of a safety-first business analysis and the systematic-screen workflow of a value-investing strategy recipe. The deep-dive workflow runs all five layers slowly against a small number of tickers per month; the systematic workflow runs Layers 1 and 2 in volume and reserves Layers 3, 4, and 5 for the candidates that survive the input layers. Both workflows depend on the same five-layer toolkit; the difference is the throughput at each layer. A toolkit that is built once and audited periodically produces the analytical leverage that distinguishes a documented practice from a guess.
The closing test of the toolkit is not whether each tool inside it scores well in marketing comparisons, but whether the workflow it supports can be traced from the listed universe through to an open position with a documented chain of inputs and decisions. A toolkit that produces a defensible chain is the artifact of a discipline. A toolkit that produces a position without a defensible chain is the artifact of inherited trust in whichever tool happened to be open in the browser.