
Fundamentals differ by source because a filed number gets re-created twice before anyone sees it. The filer chooses which taxonomy element to tag each line to. The vendor then chooses which of its own standardized buckets that element belongs in. Both choices are defensible, and neither appears on the output. Six mechanisms produce most of the gap. Element selection inside the filing comes first. Dimensional context can turn a segment figure into an apparent total. Caption mapping forces the filer's own lines into a fixed vendor schema. Derived metrics such as net debt and free cash flow carry definitions no source publishes. The consolidation perimeter decides whose earnings the number describes. Propagation decides whether a correction ever reached the field. Resolving a disagreement means tracing the field back to the filed fact, then naming which mechanism moved it.
What stock data accuracy measures
Stock data accuracy is faithfulness to a stated definition. A revenue field is accurate when it reports the element the filer tagged, for the period claimed, under a mapping the source can describe. By that standard two sources can both be accurate and still disagree by several percent on the same line.
Accuracy and comparability are separate properties, and conflating them causes most of the confusion here. A revenue figure can be faithful to its filing and still be the wrong number to place in a peer table. Comparability requires the same selection and the same mapping on each side. Nothing on a screen tells the reader whether they were.
This is a narrower question than the one the cross-platform data-source audit answers. That audit works at the output level, reconciling two intrinsic-value figures across six input choices including share count, period base, currency, and restatement layer. Each of those is a choice between documented alternatives. This article sits one layer below it, on why two sources still disagree when every one of those matches. Whether the archive holding the figures is trustworthy as a system is a third question, covered in stock market database design. That piece deals with survivorship bias, corporate-action adjustment, and point-in-time integrity.
Every field on a screen is one of three things: an as-reported figure, a standardized one, or a derived one. An as-reported figure is the amount the issuer tagged, under the issuer's own caption, in the filing. A standardized figure is that amount after a vendor has mapped it into a fixed template so that thousands of issuers can be ranked on one screen. A derived figure is arithmetic the vendor performs over several standardized amounts. Net debt, enterprise value, EBITDA and free cash flow are all of that third kind. Standardization is necessary, because screening across a universe requires common fields. The cost is that both the mapping and the arithmetic are editorial acts, performed once per issuer per line, and almost never disclosed.
How a filed number reaches a screen
US issuers do not file spreadsheets. They file documents in which the cover page, the financial statements, and their footnotes and schedules all carry tags from a machine-readable taxonomy. The SEC sets out that requirement on its Inline XBRL page. One document therefore reads two ways. Inline XBRL embeds the tags in the statement a human reads, so the rendered figure and the machine-readable fact are the same object viewed differently. Vendors read the tags.
The SEC publishes those facts through the EDGAR application programming interfaces. Its company-facts endpoint returns an issuer's standard-taxonomy facts that apply to the entire filing entity. Dimensional facts and custom extensions fall outside it. Those have to be read from the inline XBRL view of the filing, or from the quarterly financial statement data sets, whose numeric file carries a segments field. That file covers only what the Commission renders on the face of the statements. A dimensional fact tagged inside a footnote needs the inline XBRL view instead. Between them, any analyst can pull the exact fact a vendor claims to be reporting. The trace below costs a few minutes because the authoritative fact is one request away.
The first divergence enters at element selection. A taxonomy contains many revenue elements, and issuers routinely tag more than one. Take an illustrative issuer that tags $9,600 million to a contract-revenue element and $9,780 million to the broader total-revenues element. The difference is $180 million of rental income, which sits outside revenue from customer contracts and inside the broader total. Both facts sit in the same filing. A vendor keyed to either one is reading the filing correctly.
Filers may also create custom extension elements when no standard element fits their presentation. Extensions are legitimate and common, and they are invisible to any parser built only for standard elements. A vendor that cannot map an extension either drops the line or folds it into a residual bucket. An extension is a special case of element selection: the element exists, it is simply not in the standard taxonomy.
A fact can be tagged correctly and still not be the company total. Facts carry dimensions that qualify them, such as an axis identifying a product line or a reportable segment. The consolidated total is the fact with no dimensional qualifier attached. Our issuer's $9,600 million splits into $8,200 million of product revenue and $1,400 million of service revenue, each tagged against a product-or-service axis. A parser that ignores dimensions and takes the first matching fact can return the $8,200 million product line as the company total. That understates contract revenue by 14.6 percent and total revenues by 16.2 percent, and every margin computed from it inherits the error.
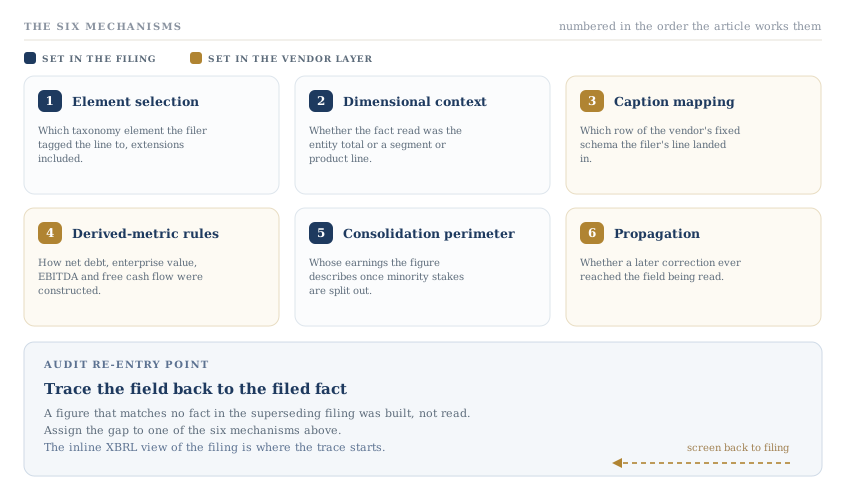
Figure 1. The six mechanisms, and which layer sets each one
Every disputed field resolves to one of these six, numbered in the order the article works them. The first, second and fifth are set in the filing; the third, fourth and sixth are set in the vendor layer.
Where vendor standardization rewrites the statement
Regulation S-X sets out the captions a commercial or industrial registrant's income statement should present, at 17 CFR 210.5-03. The rule prescribes a floor, not a template. It names income from rentals as its own revenue subcaption and lists cost of goods and cost of services as separate cost subcaptions. Any class that is not more than 10 percent of the total may be combined with another, with its related costs combined the same way. Within it issuers combine, split, and rename lines, and many omit subtotals analysts treat as standard. A software company may split cost of revenue across subscription and services lines with no gross profit line.
Standardization resolves that variety by force: each issuer's captions get mapped into one fixed schema. Where the filing offers no line for a schema row, the vendor computes one; where it offers a line the schema cannot hold, the vendor buckets it somewhere. A footnote in the vendor's methodology might record the choice. The field does not.
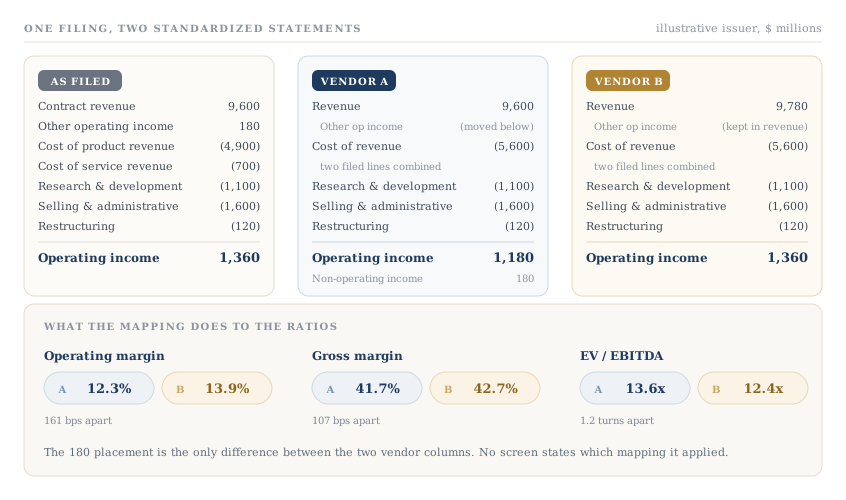
Return to that issuer, whose figures are illustrative throughout. Its filed statement shows revenue from customer contracts of $9,600 million and other operating income of $180 million from rentals. Cost of product revenue is $4,900 million and cost of service revenue is $700 million. Research and development runs $1,100 million, selling and administrative expense $1,600 million, and restructuring $120 million. Depreciation and amortization of $620 million sits inside those cost lines. The filer's own operating income is $1,360 million.
The mapping choice here is placement: where the $180 million lands relative to the operating line. One vendor maps other operating income below that line, treating it as non-operating. Its revenue reads $9,600 million and its operating income reads $1,180 million. A second vendor follows the filer's presentation and keeps the rental income inside the operating block. Its revenue reads $9,780 million and its operating income reads $1,360 million, matching the filing.
This is the same $180 million, and the same $9,600 million against $9,780 million, as the element-selection example above. Two vendors reach identical revenue by different routes. The number alone will not say which mechanism produced it; the list of elements tagged for the line will.
The revenue gap is 1.9 percent of the lower figure, small enough to look like a rounding difference. The margin gap is wider. Operating margin reads 12.3 percent on the first mapping and 13.9 percent on the second, a spread of 161 basis points on identical filed inputs. That is a 13 percent relative shift in the margin itself. Neither vendor has misread the filing. Vendor A's placement departs from the filer's presentation, and from the Regulation S-X treatment of rental income as a revenue subcaption. That is a stated policy about what counts as core revenue, not a mistake about what was filed. Either way the placement is printed nowhere on either screen.
Figure 2. One filing, two standardized statements
The same filed lines mapped into two vendor schemas that place other operating income differently. Figures in millions of dollars. The gross-margin and EV/EBITDA pairs are computed rather than filed; the two sections that follow take both constructions apart.
Net debt and the enterprise value bridge
Filed line items diverge by a few percent. Derived metrics diverge by far more, because no filing contains them. Net debt, enterprise value, EBITDA, and free cash flow are all constructed from filed inputs by rules each source writes for itself. The inputs are auditable. The construction rule usually stays private.
Net debt is $4,500 million or $6,300 million on the same balance sheet. The issuer carries $6,000 million of debt against $1,500 million of cash, which gives the lower figure on the conventional definition. It also carries $1,800 million of operating lease liabilities. A source that treats leases as debt reports net debt of $6,300 million, 40 percent higher, from identical filed inputs.
Aswath Damodaran's work on operating leases set out the case for treating lease commitments as debt while they still sat off the balance sheet. Current lease accounting has since put that liability on it. The live dispute moved with it, from whether to capitalize the commitment to whether the recognized liability belongs in the net-debt bridge. Sources answer differently, and a screen does not say which answer it used.
Enterprise value inherits that gap. Market capitalization of $20,000 million plus $4,500 million of net debt gives $24,500 million. On the lease-inclusive net debt the bridge runs to $26,300 million instead. Both figures exclude the $600 million carrying value of the noncontrolling interests this issuer also reports, while consolidated EBITDA includes all of the partly owned subsidiaries' earnings. A source that adds them reaches $25,100 million on the narrower bridge. Noncontrolling interests, preferred stock, unfunded pension obligations, and equity-method holdings each add or omit a further line.
Where the vendor computes instead of reading
The filer reports no gross profit line, so both vendors compute one by subtracting the two cost-of-revenue lines. On the first mapping gross margin is 41.7 percent; on the second it is 42.7 percent. In relative terms that is the mildest of the three ratio gaps in Figure 2: gross margin moves 2.6 percent, EV/EBITDA 10.0 percent, and operating margin 13.1 percent. Some of it is construction rather than economics, since the rental income enters the second numerator with no matching cost line.
Add the $620 million of depreciation and amortization to each operating line. EBITDA reads $1,800 million on the first mapping against $1,980 million on the second. Against the $24,500 million bridge, EV/EBITDA reads 13.6 times and 12.4 times; on the $26,300 million bridge and the higher EBITDA it reads 13.3 times. A source that builds EBITDA upward from consolidated net income reaches $1,980 million either way. The $180 million sits above the tax line under both mappings. That base is the $1,020 million total, not the $930 million attributable to the parent. Starting from the parent's share gives $1,890 million, a third answer.
The 13.3 times is itself a mismatch worth naming. Current lease accounting leaves operating lease cost inside operating expenses, so $1,980 million of EBITDA is already net of the issuer's $240 million of lease cost. A bridge that capitalizes the liability should add that cost back, which gives $2,220 million and 11.8 times. Two choices move the EBITDA figure itself: where the rental income sat, and which direction the measure was assembled from.
Free cash flow can be $1,300 million or $920 million from one cash flow statement. Operating cash flow of $2,100 million less capital expenditure of $800 million gives the higher figure. Deduct stock compensation of $380 million and the figure falls to $920 million. Some sources also deduct the $240 million of operating lease cost and report $680 million. That is a double count. Current lease accounting classifies the whole operating lease payment within operating activities, so the $240 million already sits inside the $2,100 million. All three figures get called free cash flow.
Derived metrics therefore sit at the bottom of a hierarchy of trust. Cash, debt, and revenue sit closest to as-reported and diverge least. Margins diverge more, because they depend on mapping. Derived metrics diverge most, because they depend on a definition the source keeps to itself. Any screen threshold set on a derived metric is set partly on that private rule.
Which earnings the consolidation perimeter describes
A consolidated income statement reports the results of everything the parent controls, including subsidiaries it does not wholly own. The outside shareholders' share of those results is the noncontrolling interest. US GAAP requires it to be separated. The Regulation S-X income statement captions at 17 CFR 210.5-03(b), items 19 and 20, split it from income attributable to the controlling interest. That leaves two defensible net income figures in every filing of this kind.
Our illustrative issuer reports total net income of $1,020 million, after $150 million of net interest and $190 million of tax. Of that, $90 million belongs to noncontrolling interests and $930 million to the parent's shareholders. On an unchanged count of 500 million shares, earnings per share is $2.04 on the total and $1.86 on the parent's share. The total figure is 9.7 percent above the parent figure, and the share count is identical in both cases. This is a numerator question, not a denominator question.
The convention is settled in principle. Per-share figures for common shareholders should use income attributable to the parent, because that is the income those shareholders have a claim on. In practice the total figure still appears in standardized fields, particularly in profitability ratios assembled from separate feeds. Return on equity is the common casualty. Parent-only income over total equity including noncontrolling interests understates the ratio; total income over parent-only equity overstates it. Both combinations appear in commercial data, and each reconciles to a filed statement.
Equity-method holdings run the error the other way. A stake carrying significant influence, presumed in practice at roughly 20 to 50 percent of the voting interest, brings a single line of income into the parent's statement. None of the associate's revenue or debt reaches the consolidated line items a screen reads. Where the investee is significant, Regulation S-X still puts summarized assets, liabilities and results of operations in the footnotes at 17 CFR 210.4-08(g). Separate investee statements follow at 17 CFR 210.3-09. The data exists; it never reaches a standardized field. Revenue-based multiples then understate the economic scale of the group, and debt-based ratios understate its leverage. The 10-K reading discipline that locates the consolidation note is the check, because the perimeter is disclosed there and nowhere on a screen.
Amendments and the propagation gap
Filings get corrected. An issuer that identifies a material error usually files an amended annual or quarterly report, and the corrected facts are tagged in the amendment rather than in the original document. Not every correction arrives that way. An immaterial revision often surfaces only in the comparative column of the next periodic report, with no amendment to key on. A pipeline watching for amended filings will never see it.
Policy and propagation are separate failures. Choosing between original-as-reported and restated data is a documented policy choice. The cross-platform audit treats it as one of its six categories, and database design sets restatement handling and backfill management as things to demand of an archive. Propagation is a separate matter: whether the corrected fact actually arrived. A vendor may intend to serve restated figures and still be serving an uncorrected number, because its pipeline keyed on the original accession and never revisited it. The intent and the outcome are different things, and only the outcome is visible in the data.
Timing produces a second version of the same problem. Quarterly results usually reach the market in a press release days or weeks before the corresponding report is filed. Some sources ingest the release and some wait for the filing. The two can disagree, because a release precedes the auditor's or reviewer's sign-off and its figures are sometimes revised on the way into the filing. The difference is not only timing. An earnings release carries no tagged financial statement facts, so a figure taken from one has no filed fact behind it to trace. For the interval between release and filing, two sources can hold different numbers for the same quarter and both be current. How that pipeline is built determines how long the interval lasts, a question covered in the equity market data infrastructure audit.
A single figure can carry three of these problems at once. One corrected in an amendment, ingested from a release, and assembled from a rolling window raises a separate question on each count. The window itself is the subject of trailing twelve months versus fiscal year. The check here is one line: confirm the fact came from the filing that supersedes all others.
Reconciling a disputed field to the filed fact
Auditing every field on a screen is not a use of anyone's time. Auditing the three or four inputs a conclusion is most sensitive to is. When two sources disagree on one of those inputs, the trace runs in this order:
- Name the field and the period. Write down the exact metric, the fiscal period, and the figure each source reports. Most apparent disagreements dissolve here, because the two sources were describing different periods.
- Pull the filed facts. Read the inline XBRL view of the filing, which carries the dimensional and extension facts the company-facts endpoint leaves out. List every element tagged for that line, with amounts, periods, and dimensional context.
- Look for an exact match. One source's figure will often match a filed fact to the dollar. Confirm the matching fact carries no dimensional qualifier before accepting it, since a segment or product-line fact can match to the dollar and still not be the company total. A clean match identifies which element the source selected.
- Classify any residual gap. If no fact in the superseding filing matches, the figure came from somewhere else: a superseded filing, an earnings release, or a construction the source performed. Assign the gap to one of the six mechanisms: element selection, dimensional context, caption mapping, a derived-metric definition, the consolidation perimeter, or propagation.
- Record the choice you are adopting. One line naming the element, the filing, and the mapping assumed. That line is what makes the model auditable six months later.
The fundamental analysis checklist runs this trace across a full set of fundamentals for one company; this procedure applies it to a single contested field. Both end in the same place: a figure with a documented provenance.
The same reasoning sets the limit on what a screen can decide. The InvestViable stock screener screens a universe of 3,000+ US stocks on fundamentals and the Investment Score. Sliced views such as the quality-focused slice of the Stock Universe apply thresholds to those same standardized fields. Thresholds on any platform inherit the mapping beneath them, so a screen belongs upstream of a decision rather than at the end of one. The InvestViable Valuator runs a DCF from three explicit inputs: the cash flow growth path, the discount rate, and the terminal growth rate. Every assumption is user-controlled.
A fundamental traced to its element and its filing, with the mapping written down, is a number an analyst can defend under questioning. One pulled from a field with no provenance cannot be defended at all. The difference costs a few minutes per contested field, and only on the fields that move the answer.
InvestViable does not publish buy or sell recommendations on individual securities. All analysis is based on public financial data and a transparent methodology. The Investment Score formula is proprietary; the inputs and what the score evaluates are documented.