
The cash conversion cycle measures how many days a company's cash is committed to operations before customers pay it back. It is days sales outstanding plus days inventory outstanding minus days payable outstanding. A shorter cycle means the business funds less of its own growth. Working capital reveals what the income statement hides: whether customers pay on the agreed terms, whether inventory turns, and how much leverage the company holds over its suppliers. The level is largely a business-model fact. The trend is the signal.
What the cash conversion cycle measures
Every business that holds stock and sells on credit runs a financing operation it never chose to run. It buys inventory, waits, sells it, waits again, and eventually collects. In the middle of that sequence it owes its own suppliers. The terms of that debt decide how much of the wait the company funds itself, and the cycle counts the days in the gap.
The construction has three parts. Days sales outstanding measures how long customers take to pay. Days inventory outstanding measures how long goods sit before they sell. Days payable outstanding measures how long the company takes to pay its suppliers. The first two are stretches when the company's own cash is committed. The third is a stretch when a supplier carries the operation instead.
Cash conversion cycle
The number of days between the cash payment for inventory and the cash collection from the customer who buys it. Days sales outstanding plus days inventory outstanding, less days payable outstanding. A positive cycle is a period the company funds itself; a negative cycle is one its suppliers fund.
Adding the first two and subtracting the third gives the days between paying for goods and collecting for them. A cycle of 60 days means roughly two months elapse between those two events. A cycle near zero means trade credit covers the whole gap. A negative cycle means the cash arrives before the bill falls due.
This matters because the cash tied up in working capital is a real claim that no income-statement line reports. Write-downs and credit losses on those balances do reach the income statement. The cost of carrying the balances does not. A company can grow revenue by 20 percent and hold its margin exactly, and still consume cash, because every incremental dollar of sales drags receivables and inventory up behind it. That is how a business can look profitable and still need funding. It is also why the gap between reported profit and operating cash flow so often traces back to these three line items.
The cycle is a measurement rather than a verdict, and a short cycle is not automatically better. It usually describes the industry more than the management. The safety checklist for value traps treats receivables outrunning revenue as grounds to disqualify a stock, and an earnings-quality review reads the same movement as a revenue-recognition tell. Both use the number as a signal, which is a later step. The question here is what the days are counting, and what moves them.
Computing the three components from a filing
The inputs come from two statements and nothing else. Receivables, inventories and trade payables sit on the balance sheet. Revenue and cost of sales sit on the income statement. Under Regulation S-X 17 CFR 210.5-02, which governs commercial and industrial filers, each balance has a prescribed caption on the face of the balance sheet or in the related notes. Receivables are item 3, inventories are item 6, and accounts and notes payable are item 19.
Item 19 is worth a second look. It requires payables to be split seven ways, and only the amount owed to trade creditors belongs in this calculation. Two of the other six categories are borrowings from banks and from factors or other financial institutions, a distinction this article returns to below.
The three formulas follow from what each balance is carried at. Days sales outstanding is average receivables divided by revenue, times 365. Days inventory outstanding is average inventory divided by cost of sales, times 365. Days payable outstanding is average payables divided by cost of sales, times 365. Average the opening and closing balances rather than taking the closing figure alone, and use the quarter-end balances where the 10-Q and 10-K filings supply them. A single year-end snapshot is the one date management has the most reason to tidy.
Non-cash working capital
Current assets excluding cash, less current liabilities excluding short-term debt. The three components computed here are the largest and most interpretable part of that balance, and every figure in this article's worked example uses only those three. Published sector benchmarks use the wider definition, which also picks up prepaid expenses, accrued liabilities and deferred revenue.
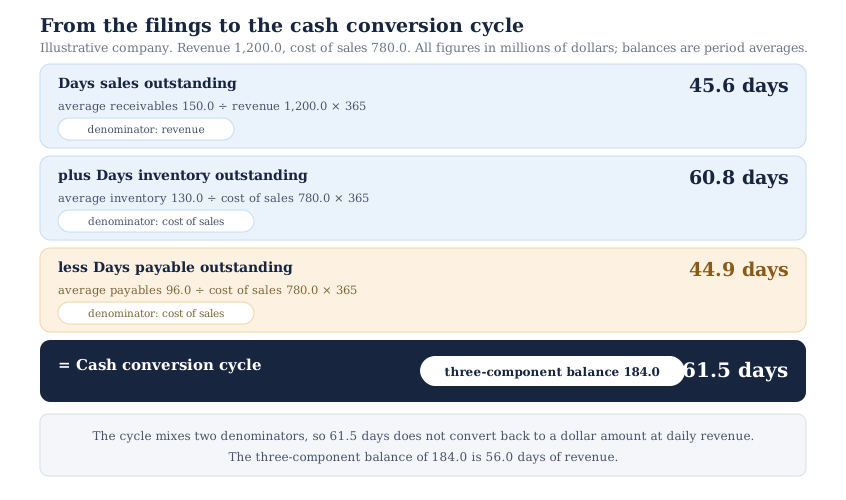
Work the example through. Revenue is 1,200.0 million dollars and cost of sales is 780.0 million. Average receivables are 150.0, average inventory is 130.0 and average trade payables are 96.0. Days sales outstanding is 45.6, days inventory outstanding is 60.8, and days payable outstanding is 44.9. The cycle is 45.6 plus 60.8 less 44.9, or 61.5 days. The three-component balance is 150.0 plus 130.0 less 96.0, which is 184.0 million dollars.
Both numbers are worth carrying forward, because they answer different questions. The 61.5 days is a duration and compares across companies of any size. The 184.0 million is the capital currently committed, and it is the figure that grows when the business grows. Pull the balances from the primary filing instead of a summary screen, and reading the 10-K covers where the inventory and receivables detail lives.
Why the denominator convention changes the answer
The three formulas do not share a denominator, and the reason is not arbitrary. Receivables are recorded at the invoiced amount, which is a selling price, so revenue is the matching base. Inventory is carried at cost, so cost of sales is the matching base for it. Dividing inventory by revenue instead pairs a cost-basis numerator with a price-basis denominator, and understates the days by roughly the gross margin. On the illustrative company the error is large: 130.0 against revenue gives 39.5 days rather than 60.8.
Payables deserve a caveat of their own. They arise from purchases, not from sales, but purchases are not a reported line, so cost of sales stands in for them. The substitution is exact only when inventory is flat. When inventory is building, purchases exceed cost of sales and the formula overstates the payment period. In this article's own growth year, purchases run to 916.5 million against cost of sales of 897.0, which moves days payable outstanding by nearly a full day.
This produces a consequence most treatments skip. Because the cycle sums components measured on two bases, it does not convert back into a dollar figure at any single daily rate. Multiplying 61.5 days by daily revenue of 3.288 million gives roughly 202 million, and the balance actually committed is 184.0 million. That balance is 56.0 days of revenue, not 61.5. Recovering it from the days needs both rates: receivables at daily revenue, and inventory less payables at daily cost of sales.
The same care applies to what a single day is worth. A day of days sales outstanding is worth revenue divided by 365, or 3.288 million dollars here. A day of inventory or payables is worth cost of sales divided by 365, or 2.137 million. Five days off the collection period releases 16.4 million. Five days added to the payment period releases 10.7 million. The two levers are not interchangeable, and a company reporting a shorter cycle has not said which one moved.
Two further conventions change the number without changing the business. Inventory cost-flow assumptions are one. A company on last-in, first-out reports a lower inventory balance than an otherwise identical company on first-in, first-out whenever input costs have been rising, and therefore fewer days. Item 6(c) of the same rule requires the excess of replacement or current cost over stated LIFO value to be disclosed when material. The reserve is therefore recoverable from the notes, and the two companies can be put on the same footing. The day count is the other convention: 360 still appears in some texts, and it cuts every component by about 1.4 percent against a 365-day basis.
What a negative cycle proves and what it does not
A negative cycle is the most misread number in this calculation. It means customers pay before suppliers do, so growth releases cash rather than absorbing it. The business runs on trade credit, and the faster it expands the more float it generates. That structure lets suppliers fund growth, and it is mostly a consequence of what the company sells and on what terms.
The sector data makes the point better than argument does. On Damodaran's working capital ratios by sector, covering US companies as of January 2026, non-cash working capital runs at 61.65 percent of sales for homebuilders. The soft beverage group sits at minus 6.00 percent, and grocery and food retail at 0.06 percent, essentially zero. A homebuilder holds land and finished houses because those are the product. A grocer sells perishable goods within days and pays suppliers on terms measured in weeks. Neither ratio reflects a decision the other management could copy.
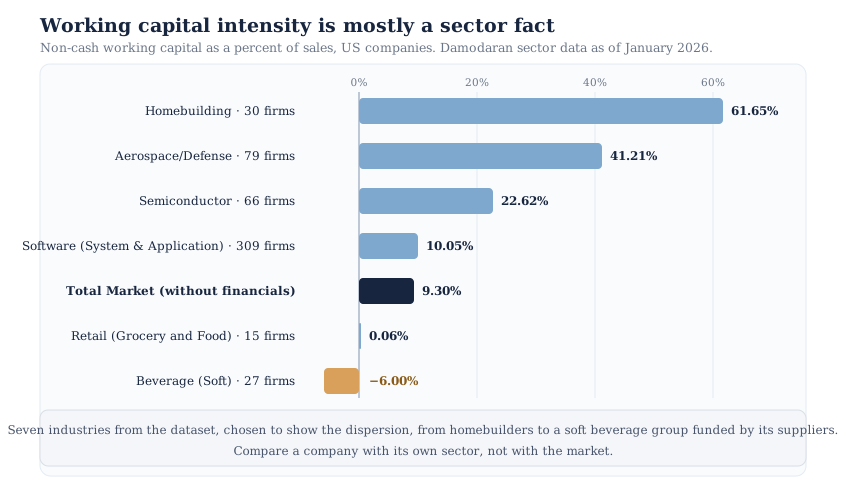
Negative cycles are not the property of one sector. The same dataset puts computers and peripherals, telecom services, auto and truck makers, healthcare support services and green and renewable energy below zero, alongside soft beverages. What they share is a structure, not an industry label. The goods convert to cash quickly, and the selling terms beat the terms the company itself receives. The consumer staples and consumer discretionary parts of the Stock Universe are a reasonable place to start looking, but the screen is on the balance sheet, not the sector.
So the question a negative cycle raises is not whether it is good. It is whether the cycle is durable, and whether it is what it appears to be. One test asks whether the payable extension reflects genuine leverage over suppliers or a third-party financing arrangement dressed as trade credit. Supplier finance programs are also called reverse factoring. A bank pays the supplier early, and the buyer keeps the invoice on its payables line for longer. Under ASC 405-50 the buyer must disclose the program's key terms and the confirmed obligations outstanding at each period end, and annually a rollforward of those obligations.
The second test asks what happens when volume falls. A negative cycle unwinds in reverse, because shrinking sales mean shrinking payables. The float the business enjoyed on the way up becomes a cash outflow on the way down. That asymmetry is why a structurally negative cycle deserves reading alongside the company's liquidity position.
Reading the trend against the cycle
The level belongs to the industry, so the information is in the movement. Three questions cover most of what a multi-year series will say, one per component, and each carries a different set of plausible explanations.
Rising days sales outstanding asks whether the company has loosened credit terms to hold volume. It could also have shifted mix toward slower-paying customers, or simply let collection deteriorate. Rising days inventory outstanding asks whether demand has softened, whether the build is deliberate ahead of a launch, or whether obsolete stock is accumulating at cost. Rising days payable outstanding asks whether the company has won better terms or is conserving cash because it has to.
Management often addresses at least one of these in the liquidity discussion. Item 303 of Regulation S-K requires short-term and long-term cash requirements to be covered separately, and known material trends in capital resources to be described.
The business cycle is the confounder that catches people out. Inventory ratios move sharply when sales move, and the movement often has nothing to do with purchasing decisions. The Census Bureau's seasonally adjusted total business inventories-to-sales ratio, published by the St. Louis Fed, stood at 1.30 in June 2026, in a series running back to January 1992. Its extremes are instructive. The ratio peaked at 1.74 in April 2020 and reached 1.48 in January 2009, in both cases because sales collapsed faster than inventory could be run down. Its low of 1.24 came in March 2011. A company whose inventory days jump during a demand shock is mostly reporting the denominator.
That ratio is itself the mixed-basis construction this article warned about, since inventories are carried at cost and sales are at selling prices. It is not a days measure and it does not convert into one. It is useful here only as a directional signal about the macro environment a company's own series is sitting inside.
Two practical rules follow. Read the series over at least three to five years, so one tidy year-end cannot set the impression. And compare within the sector, since the dispersion between industries dwarfs the dispersion within them. Where a working capital move traces back to an accounting choice instead of an operating change, the earnings-quality checks are the next step. Sector valuation context supplies the peer group to read the ratio against.
Working capital as a forecast input
Everything above resolves into one number a valuation actually needs: the change in net working capital. It is a cash outflow in a discounted cash flow model, no expense line reports it, and it is the input least likely to have been examined.
The mechanic is simpler than it looks once the days are in hand. Hold the three day-counts constant, and hold cost of sales at its ratio to revenue, and the three-component balance scales with revenue. The illustrative company carries 184.0 million dollars at revenue of 1,200.0. Grow revenue 15 percent to 1,380.0, with cost of sales rising to 897.0, and the balances become 172.5, 149.5 and 110.4. The balance becomes 211.6 million, and the change is 27.6 million. That is 15 percent of the opening figure, which is the general result under those two conditions.
Both conditions matter. Drop the constant-days assumption and the scaling breaks in the obvious way. Drop the constant cost ratio and it breaks less obviously, because inventory and payables track cost of sales while receivables track revenue. The result also holds only for the three-component balance. Under the wider definition, deferred revenue and accrued liabilities do not scale with revenue at the same rate.
This is what makes the days a forecast input rather than historical description. A model that quietly improves days sales outstanding across the projection has assumed a cash benefit without stating an operating reason for it. Running the projection twice, once on current days and once on the assumed improvement, sizes what the assumption contributes. It is the discipline the DCF inputs checklist applies to growth, margins and the discount rate, extended to the input that checklist does not cover.
One boundary is worth marking. A model can charge the full year-over-year swing in working capital, or only the increment needed to maintain current volume. The choice is definitional, and owner earnings versus free cash flow covers it, along with why a single year's swing is noisy. The cycle supplies the days; that article decides what the model does with them. The InvestViable Valuator works from the cash flow growth path, the discount rate and the terminal growth rate, so a working capital view reaches it through the growth path.
Where this sits in the analysis
Working capital analysis runs after the reported numbers have been tested and before a fair value is built. It takes a verified balance sheet and income statement as given, and asks what the operating rhythm of the business costs in cash. The output is not a price and not a score. It is three day-counts, a trend across several years, and a defensible assumption about what the next few years of growth will absorb.
It also produces questions rather than answers, which is the point. A cycle that lengthened by 12 days over three years does not say the business is deteriorating. It says one of three components moved, and the filings will usually show which. A receivables move and an inventory move point at different parts of the business, and they rarely have the same explanation. From there the work is ordinary: read the segment disclosure, check whether an acquisition changed the mix, and see whether peers moved the same way in the same years.
The habit that compounds is running it identically on every company. Do that across enough names and a receivables figure well outside the sector pattern registers immediately, and the follow-up question arrives without effort. To assemble candidates worth that scrutiny, the stock screener narrows the US universe on reported fundamentals. Each name then earns this read on its own filings.
InvestViable does not publish buy or sell recommendations on individual securities. All analysis is based on public financial data and a transparent methodology. The Investment Score formula is proprietary; the inputs and what the score evaluates are documented. The company figures in this article are illustrative and exist to demonstrate the arithmetic, not to describe any company.