
Earnings quality measures how closely reported profit tracks the cash a business actually earns. The gap between net income and operating cash flow is accruals, and a large or rising gap is the master warning sign. From there the recurring earnings quality red flags are receivables growing faster than sales, costs capitalized instead of expensed, and reserves released to smooth results. Recurring charges dressed up as one-time complete the set. None of these has to be fraud; most are legal but aggressive choices that flatter the reported number. Test them before you value the business, because every multiple and model inherits whatever earnings you feed it.
What earnings quality actually measures
Earnings quality is not a single ratio. It is a judgment about how faithfully reported net income represents the durable, cash-generating performance of the business. Accounting accrues revenues and expenses to the period they belong to rather than the period cash moves, which is what makes an income statement useful. The same accrual machinery is also where discretion lives. Management picks when to recognize a sale, how long to depreciate an asset, how large a reserve should be, and whether a cost is an expense or an investment. Each choice is legitimate within a range, and each can be pushed toward the flattering end.
Accruals
The portion of reported earnings not backed by operating cash flow in the same period. Accruals are the accounting adjustments that shift revenues and costs across time. Modest accruals are normal; large or persistently rising accruals mean a growing share of profit rests on estimates rather than cash.
High-quality earnings share three traits: they are backed by cash, they repeat, and they are conservative enough that later periods confirm them rather than reverse them. Low-quality earnings fail one of those tests. The point of an earnings-quality review is not to accuse management of anything. It is to size how much confidence a reported number can carry into a valuation, and to adjust the margin of safety accordingly. The value-trap safety checklist treats a failed cash-conversion test as one reason to disqualify a stock outright. This article opens that instinct into a full set of checks and shows the accounting mechanism behind each.
The accrual test: earnings that cash does not back
The single most useful earnings-quality check compares net income to operating cash flow. Over any multi-year stretch, a healthy business converts most of its reported profit into cash. When net income persistently outruns operating cash flow, a growing share of profit is sitting in accruals rather than in the bank.
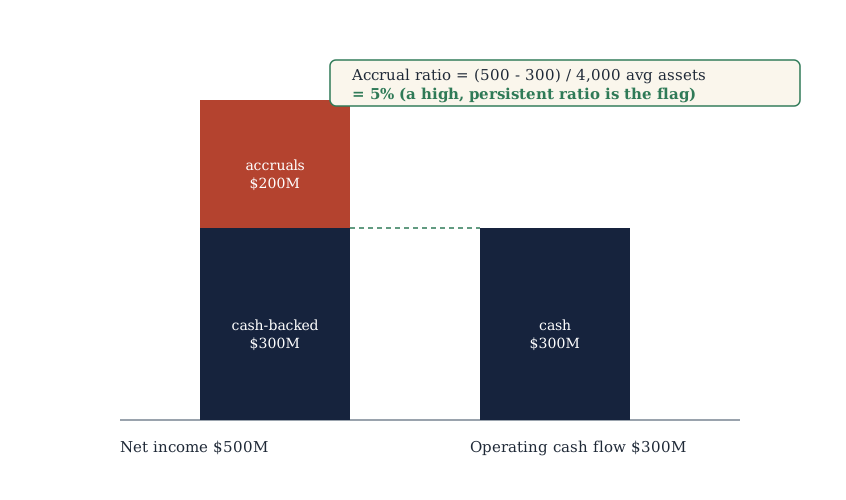
A simplified accrual ratio makes this concrete: net income minus operating cash flow, divided by average total assets. Fuller formulations net out investing cash flow and measure against net operating assets, but the simple version is enough to flag a problem. Take a company reporting 500 million dollars of net income against 300 million dollars of operating cash flow. Its accruals are 200 million dollars. On an average asset base of 4 billion dollars, the accrual ratio is 5 percent. A low or negative ratio says earnings are cash-backed. A high positive ratio says the opposite, and the academic evidence is unkind to it. Richard Sloan's 1996 work on the accrual anomaly, summarized in the CFA Institute Research Foundation's earnings-quality monograph, found that high-accrual firms disappoint on earnings and returns in later years. Accruals reverse; cash does not.
Figure 1. The accrual gap: reported profit versus cash earned
Net income can sit well above the operating cash flow that backs it. The gap is accruals, and a wide, persistent gap is the first earnings-quality flag to check.
Three cautions keep the test honest. Fast-growing companies invest in working capital, which can depress operating cash flow for legitimate reasons. Read the ratio as a trend and against peers, not as a single-year pass or fail. Operating cash flow is not incorruptible either. Stretching payables, factoring receivables, and reclassifying outflows into the investing or financing sections can all flatter it, so the cash line earns the same scrutiny as the earnings line. And it is a screen, not a diagnosis: a high ratio tells you where to look, not what you will find. What it reliably does is point at the specific line items that follow.
Revenue recognition: where earnings quality red flags start
Most managed earnings begin at the top line, because revenue is the number under the most pressure and the one with the most timing discretion. Revenue recognition under the current standard ties recognition to the transfer of control to the customer. The judgment about when control transfers leaves room to pull sales forward. The classic patterns are channel stuffing, shipping product to distributors ahead of real demand, and bill-and-hold arrangements that book a sale before the goods leave the building.
The balance sheet usually tells on the income statement before the income statement admits anything. When accounts receivable grow materially faster than revenue, the company is booking sales it has not yet collected, which points to loosened credit terms or pulled-forward recognition. Rising days sales outstanding across several quarters is the same signal in ratio form. For subscription and software businesses, watch the mirror image. Deferred revenue that stalls or falls while reported revenue climbs means the pipeline of already-collected future revenue is draining faster than it refills. Any of these deserves a trace back to the revenue-recognition footnote and the receivables detail in the company filings on SEC EDGAR. The accounting policy and the receivables aging are laid out there.
None of this requires fabricated sales. Pulling revenue forward is often perfectly legal; it simply borrows from next period, which is why aggressive recognition shows up later as decelerating growth even as receivables stay elevated. The red flag is the divergence between what is recognized and what is collected.
Capitalizing costs that belong in expenses
The second lever sits on the cost side. Every dollar a company capitalizes onto the balance sheet as an asset is a dollar it does not subtract from this period's earnings. Some capitalization is correct: genuine long-lived assets belong on the balance sheet and depreciate over time. The manipulation is capitalizing costs that are really current operating expenses, so profit today is higher and the charge is spread thinly across future years.
The recurring versions are familiar. Companies stretch the depreciable lives of assets so annual depreciation falls, aggressively capitalize software or internal project costs, and capitalize routine maintenance as if it were an upgrade. The tell is cross-statement. When capitalized costs rise, capital expenditure on the cash flow statement climbs relative to operating cash flow. Property, plant, and equipment or capitalized-software balances then grow faster than revenue. A company whose earnings look strong while free cash flow, which nets out that capital spending, stays weak is often capitalizing its way to the reported profit. Comparing the depreciation policy and useful-life assumptions in the notes against close peers surfaces the ones that have quietly extended their lives.
This is also where owner earnings and free cash flow earn their keep. Both frameworks force capitalized costs and real maintenance capital spending back into view, which is precisely what an aggressive capitalization policy is trying to keep out of the earnings number.
Reserves, one-offs, and the non-GAAP gap
The last cluster is about smoothing and presentation. Reserves and provisions, for warranties, bad debts, restructuring, or litigation, rest on management estimates. A reserve over-built in a strong year and released into a weak one lets a company smooth earnings without any change in the underlying business. Watch for reserve balances that move opposite to what conditions would suggest, and for provisions that fall just as results would otherwise miss.
Then there is the adjusted-earnings gap. Companies report the audited figure filed with the regulator and a management-defined adjusted figure that removes items it deems non-recurring. The SEC's interpretations on non-GAAP measures require a reconciliation to the nearest audited number, and warn that excluding normal, recurring cash costs can make the adjusted figure misleading. Three checks keep this in bounds. Frequency: a charge that appears every year for five years is an operating cost, whatever it is labeled. Magnitude: an item excluded as one-time that runs to a large share of operating income deserves scrutiny, not a footnote. Direction: adjustments that always run one way, removing costs to lift the profit, are a presentation choice rather than a measurement improvement. Stock-based compensation is the item this catches most often. It is a real, recurring cost of paying employees that adjusted-earnings figures routinely add back, which flatters profitability at companies that lean on equity pay. Audit standards on fraudulent financial reporting single out reserve manipulation and revenue timing as the mechanisms auditors are trained to probe. That is a fair guide to where an outside analyst should look too.
This is a different question from whether the raw data is accurate. The fundamental analysis checklist verifies that the numbers on a data platform match the primary filing. Earnings quality assumes the numbers are accurate and asks whether accurate, audited figures are being managed toward a flattering result.
How to run the earnings-quality screen
The checks combine into a fast pre-valuation gate that runs on any company from its filings.
Figure 2. A five-check earnings-quality screen
Each red flag has a statement relationship that exposes it and a filing line to check. Run them before trusting the earnings number a valuation is built on.
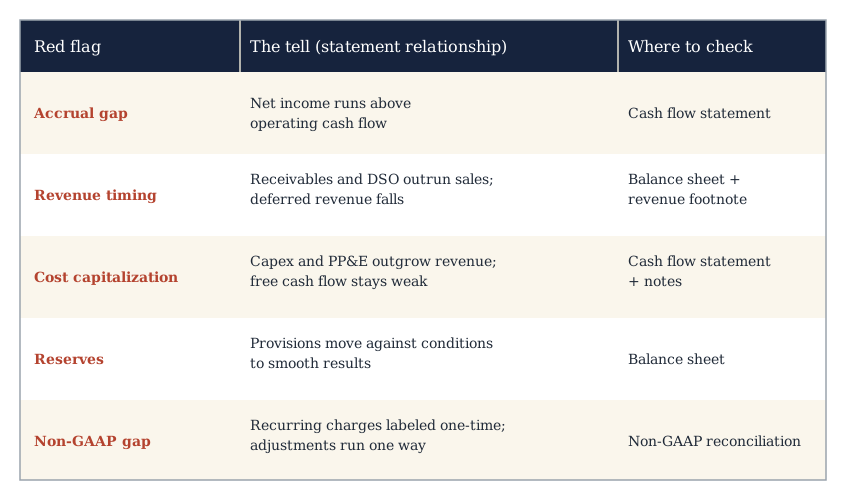
Work from the primary filing outward. Pull the most recent 10-K and 10-Q, compute the accrual ratio over three to five years, and read it as a trend. Trace receivables, days sales outstanding, and deferred revenue against reported revenue growth. Compare capital spending and asset balances to revenue and to free cash flow. Skim the reserve and provision movements for smoothing. Line the audited number up against the adjusted number and run the frequency, magnitude, and direction checks on the exclusions. Fifteen minutes of this surfaces most of what an earnings-quality problem looks like from the outside.
The output feeds the metrics that come next. A headline return on equity computed on flattered earnings is flattered by the same amount, so the return metrics are only as trustworthy as the earnings underneath them. The same is true of the reported fundamentals the Investment Score weighs across valuation, financial strength, and performance. Its checks are computed on the numbers a company reports, which is why those numbers deserve testing upstream rather than at face value. To start from a set of candidates worth this scrutiny, the stock screener narrows the US universe on fundamentals. Each name then earns a manual earnings-quality read before it reaches a valuation.
Where this fits in the workflow
Earnings quality is the gate, not the verdict. It runs after the raw data has been verified against the filing and before a single multiple or discounted cash flow model is built. Its job is to decide how much of the reported profit deserves to survive into the valuation. What comes out the other side is a normalized earnings figure, with the one-offs and estimate-heavy items stripped or adjusted. The review also shows how much confidence that number deserves. Running it the same way on every company compounds into judgment. After enough names, the industries and management styles that habitually flatter earnings become recognizable on sight, and the check that took fifteen minutes at first takes five. A business whose earnings pass every check earns a tighter margin of safety; one that trips several earns a wider one or a pass. The number at the top of the model was never the finish line. Getting it honest is where the real work starts.
InvestViable does not publish buy or sell recommendations on individual securities. All analysis is based on public financial data and a transparent methodology. The Investment Score formula is proprietary; the inputs and what the score evaluates are documented.