
To value an unprofitable company, first decide which kind it is. One has no earnings yet but is growing toward a credible profit; the other loses money structurally, with no path back. For the first, value the future business with a path-to-profitability DCF: forecast to a normal margin and discount back. Cross-check that against a revenue multiple such as EV/Sales on profitable peers. For the second, the balance sheet governs: cash runway, burn rate, and dilution decide whether equity holders see anything, and an asset floor sets the downside. Whichever applies, the honest output is a wide range, not a single price.
Why earnings-based methods break when there are no earnings
Start with what stops working, because the failure is instructive. A price-to-earnings ratio needs positive earnings. Feed it a loss and it returns a negative or meaningless figure, which is why data providers leave the P/E blank for lossmaking companies. The Graham formula has the same dependency. It capitalizes current earnings against a growth assumption and a bond-yield adjustment. Applied to a company with no earnings, it returns either a negative value or a small positive one anchored to nothing real. The P/E ratio and the Graham formula fail for the same reason: both need a profit that already exists to capitalize. A mechanical DCF breaks too, but through a different mechanism entirely.
A discounted cash flow model is more flexible, but it breaks differently. A young or turnaround company's near-term free cash flow is negative. A mechanical DCF then pushes almost all of the value into the terminal figure, the single least reliable number in the model. The result is a valuation that is technically complete and practically hollow: move the terminal margin by a point and the answer swings by a third. The full DCF methodology is sound; the problem is starting it from a base that carries no signal.
The deeper point is the one the method-selection guide makes: the method has to match the company's economics. A company with no earnings violates the core assumption of every earnings-based tool. Recognizing that is not a dead end. It tells you to stop capitalizing a profit that does not exist and start valuing the business that might.
First, sort the company: no earnings yet, or no earnings ever
Not all losses mean the same thing, and the most important decision comes before any model runs. A company can lose money because it is young, spending ahead of revenue on a credible path to profit. It can also lose money because its economics simply do not work, and no revenue volume will fix them. The two look similar on a single income statement and could not be more different to value.
Figure 1. The survival fork: no earnings yet versus no earnings, structurally
The same net loss routes to opposite methods depending on whether the business is investing into profit or eroding toward zero.
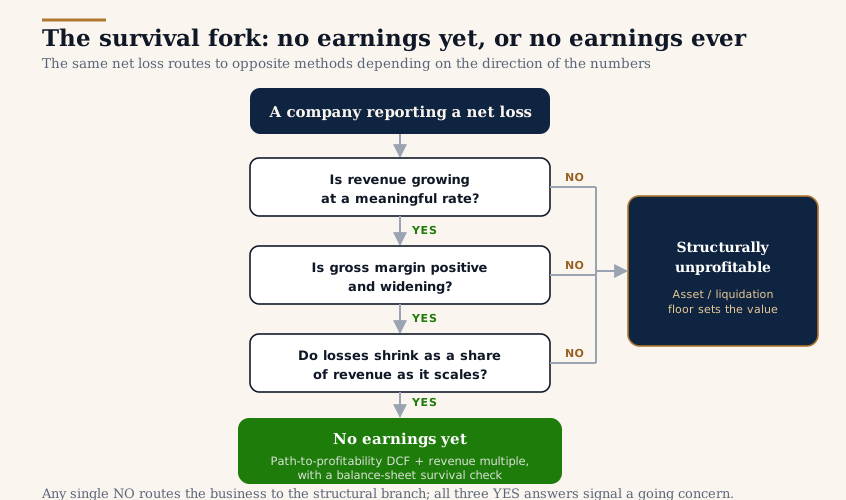
The distinction is empirical, not a matter of narrative. A business with no earnings yet shows a recognizable pattern. Revenue grows at a meaningful rate, the gross margin is already positive and widening, and operating losses shrink as a share of revenue as the company scales. The losses are an investment in growth, and the unit economics, what each customer contributes after its direct costs, are positive or trending there. A structurally unprofitable business shows the opposite: flat or shrinking revenue, gross margins that do not cover operating costs at any plausible scale, and losses that persist through good conditions.
Auditors have a formal version of this test. Under PCAOB AS 2415, recurring operating losses, working-capital deficiencies, and negative operating cash flow all raise substantial doubt about a company's ability to continue as a going concern. That is the point at which the financial statements themselves carry a warning. When a filing carries a going-concern qualification, the market is being told the survival question is live, and no growth story overrides it. Read it in the company's own filings on SEC EDGAR rather than a summary, because the going-concern language and the cash disclosures that support it live in the notes.
Sorting the company first does two things. It tells you which method to run: path-to-profitability valuation for the going concern, an asset floor for the structurally broken. And it protects you from the most expensive error in this category, paying a growth-company price for a business that is quietly burning toward zero.
Value the future business: the path-to-profitability DCF
For a company with no earnings yet but a credible path to profitability, the workhorse is a DCF. It values the business the company is becoming, not the one on today's income statement. The structure is standard; only the starting point changes. Instead of growing current cash flow, you forecast the company forward to a normal, defensible operating margin for its industry. Free cash flow then follows from that margin, and you discount the whole stream back.
Three judgments carry the valuation. The first is the revenue trajectory: how large the business becomes. Bound it by the size of the market it serves, not by extrapolating an early hypergrowth rate that no company sustains. The second is the target margin: what a mature, competitive version of this business earns, best sourced from established peers rather than from management's aspiration. The third is the discount rate, anchored to the 10-year Treasury yield plus an equity risk premium, as with any DCF. The distinctive risk of an early-stage company is that it fails outright, and that is better handled on its own. Aswath Damodaran's work on valuing young and growth companies weights the going-concern value by an explicit survival probability. Burying that failure risk in the discount rate instead would double-count it. Treating survival as its own input is the honest way to handle a business that might not make it.
An illustrative example shows the shape. Suppose a software company has 500 million dollars in revenue, a positive 70 percent gross margin, and a current operating loss. Growth starts near 30 percent and fades as the business scales. Carry it to roughly 3 billion dollars in revenue at a mature 20 percent operating margin around year eight. That is 600 million dollars of operating income where there is a loss today. Discounting that future stream produces a going-concern value; weighting it by survival probability sets the final figure, so halving that probability roughly halves the result. The figures are illustrative, but the mechanics are the lesson: the value lives in the terminal business, so the terminal assumptions deserve the most scrutiny.
You can run this in the InvestViable Valuator, which computes the DCF from three explicit inputs: the cash flow growth path, the discount rate, and the terminal growth rate. For a pre-profit company, the discipline is to model the climb to the mature margin inside those inputs and keep them visible. A valuation resting entirely on a terminal figure is one you must be able to interrogate. A reverse DCF is the natural companion once a price exists, since it asks what growth the current price already assumes. It needs a stable cash flow base to be reliable, so it fits a company approaching profitability better than one deep in losses.
Relative valuation without earnings: revenue and gross-profit multiples
When earnings do not exist, the multiple has to move up the income statement to a line that does. The revenue multiple, usually enterprise value to sales (EV/Sales), is the common choice: it prices the business against what the market pays for a dollar of revenue at comparable companies. Enterprise value to gross profit is often better still. A dollar of high-margin software revenue is worth far more than a dollar of low-margin hardware revenue, and EV/Sales ignores that difference.
The method is fast and it sidesteps the missing-earnings problem, but it carries traps sharper than usual. The first is that a revenue multiple quietly assumes the company will one day convert revenue into profit at a normal rate. Two businesses on the same EV/Sales can be worth very different amounts if their eventual margins differ, and that margin is exactly what the multiple hides. The second is dilution. Unprofitable companies fund themselves by issuing stock, and heavy stock-based compensation grows the share count, so each share owns a smaller slice of the business tomorrow than it does today. The third is the familiar one for any multiple: it inherits the mood of its peer group. A sector priced for perfection makes every name in it look reasonable relative to the others. Choosing and applying the multiple well is its own discipline, covered for the earnings-based case in the EV/EBITDA valuation guide. The same anchoring logic applies to revenue multiples, with wider error bars.
Comparability is where the work sits. A pre-profit software company should be benchmarked against businesses with similar growth and gross margins, not against the profitable incumbent that happens to share its sector. The SaaS stocks slice of the Stock Universe collects subscription-software names in one place, a reasonable starting population for finding peers. Yet the grouping is by business model, not profitability, so the comparison set still has to be built by hand. A revenue multiple is a triangulation tool, most useful held next to a path-to-profitability DCF rather than trusted alone.
Read the balance sheet: cash runway, burn rate, and dilution
A company with no profit lives on its cash balance, so for an unprofitable business the balance sheet is not a footnote to the valuation; it is part of it. Two numbers frame the survival question. The burn rate is how much cash the company consumes each period, read most cleanly as negative free cash flow. The cash runway is how long the existing cash lasts at that burn: cash and equivalents divided by the periodic burn, expressed in quarters or years.
Runway only means something against a second clock, the time until the business reaches breakeven on its own cash generation. When runway comfortably exceeds the time to breakeven, the company can fund itself to profitability from cash in hand, and the path-to-profitability valuation stands. When runway is shorter than the time to breakeven, there is a funding gap, and the company will have to raise money to cross it.
Figure 2. Cash runway against time to breakeven
The gap between how long the cash lasts and how long the business needs to reach breakeven is the dilution risk.
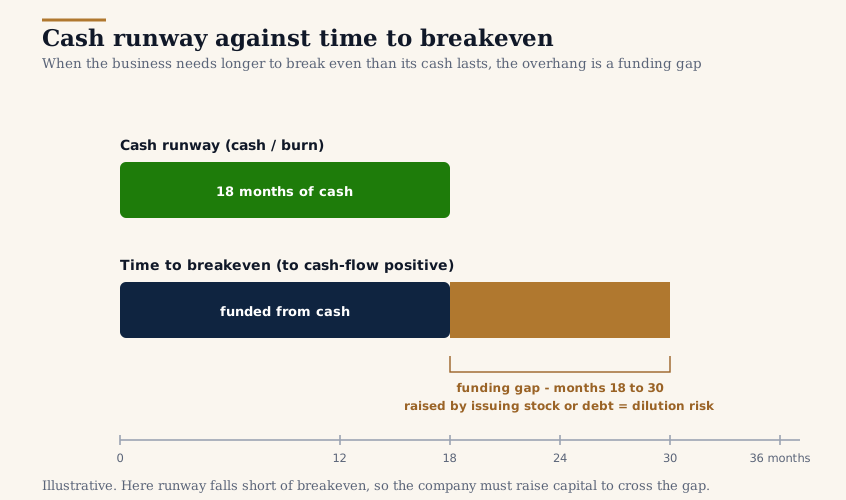
That funding gap is where value leaks out of the current shareholder's hands. Raising equity below the price you paid dilutes your stake; raising debt adds interest and covenant risk to a business that cannot yet cover its costs. Either way, the equity value you buy today is claimed in part by whoever funds the gap tomorrow. This is why two companies with identical revenue growth and identical target margins can be worth very different amounts. The one that reaches breakeven inside its runway keeps its equity intact. The one that must return to the market hands part of the upside to new capital.
The practical checks are concrete and sit in the filings. Track the trend in cash and short-term investments across recent quarters, not just the latest balance. Read whether operating cash flow is improving or deteriorating. Note existing debt maturities and any covenants. And watch the diluted share count over time, because a rising count is dilution already in progress. A business growing into profit with runway to spare differs from one growing into a capital raise, even when their income statements look alike.
When the business is worth its assets, not its future
For the structurally unprofitable company, the one on the wrong branch of Figure 1, forecasting a profit the economics do not support is not conservatism; it is fiction. Here the question changes from what the business will earn to what it owns. An asset-based view sets a floor by summing what the company could realize from its assets net of its liabilities, rather than capitalizing an income stream that may never arrive.
The rigor is in the discounts. Book value is a starting point, not an answer. Cash is worth its face, receivables somewhat less, inventory less again, and goodwill or intangibles tied to a failing operation often little. For a business heading toward wind-down, the relevant figure is closer to liquidation value than to the balance sheet's carrying amounts. PCAOB guidance draws the same line, noting that going-concern analysis stops applying once liquidation is the operating assumption, at which point a liquidation-basis measurement takes over.
An asset floor is rarely the whole valuation, but it is the essential downside anchor for any lossmaker. It answers the question the growth story ignores: if the path to profitability does not materialize, what is actually here? For a going concern with a credible future, the floor sits well below the operating value and simply bounds the risk. For a structurally broken business, the floor may be all the value there is, and paying more than it is speculation on a turnaround the numbers do not yet support.
How to apply this
Work the sequence in order. First classify: does this company have no earnings yet, on a credible path to profit, or no earnings structurally, with economics that do not close? The filings on SEC EDGAR answer that better than any narrative, because the revenue trend, the gross margin, and the going-concern language are all there. Second, match the method to the branch. Use a path-to-profitability DCF and a revenue multiple for the going concern, an asset floor for the structurally broken, and the balance-sheet survival check for both. Third, express the result as a range wide enough to reflect your assumptions, and demand a margin of safety scaled to that width. Building the output as a bear-base-bull range rather than a single number is not optional for a company this uncertain; it is the honest form of the answer.
A note on tooling. On InvestViable, every stock page shows three base valuations, a DCF, an EBITDA Multiple estimate, and Earnings Fair Value. For a company with no earnings, the earnings-based figure will be uninformative by construction. That uninformative reading is itself a signal: this is a company the standard methods cannot value on autopilot. The work moves to the future-business forecast and the balance sheet, which is exactly where a company with no earnings earns, or loses, its valuation.
InvestViable does not publish buy or sell recommendations on individual securities. All analysis is based on public financial data and a transparent methodology. The Investment Score formula is proprietary; the inputs and what the score evaluates are documented.