
Check any backtest or historical screen result in four steps. First, confirm the universe was rebuilt as of each test date and includes companies that later left. Second, confirm every exit carries a terminal return, with missing performance delisting returns set to about minus 30 percent and minus 100 percent as the upper bound. Third, confirm fundamentals are point-in-time rather than backfilled. Fourth, remove any filter that requires a company to survive the test period.
What survivorship bias is, and where a screen is safe from it
Survivorship bias is a selection effect. The sample is chosen by an outcome, survival, that is correlated with the thing being measured, return. Companies that are still listed at the end of a period are disproportionately the ones that did well during it. A test that starts from them has already filtered out many of the failures before measuring anything.
The distribution of individual stock returns makes the effect larger than intuition suggests. Hendrik Bessembinder's study of lifetime stock returns reports two findings for CRSP stocks since 1926. Fifty-eight percent of common stocks had lifetime buy-and-hold returns below one-month Treasury bills. And the top four percent of companies by lifetime dollar wealth creation account for the net gain of the entire US market. A sample of survivors is not a random draw from that distribution. It over-represents the right tail.
A current screen is a different object. A filter applied today can only return companies that are listed today, and those are the only companies anyone can buy. For building a research queue, the list is exactly the right population. The screener workflow that filters candidates for deeper valuation works on exactly that basis: the output is a starting point for analysis, not a performance claim.
The problem starts when the list is read backward. Three common versions look harmless:
- Checking how today's matches performed over the past five years.
- Treating a long record of profitability among today's matches as evidence that the rule selects durable businesses.
- Testing a rule on the current members of an index across its history, when those members were admitted because they grew.
Each statement conditions on survival. The companies that met the same criteria five years ago and then failed are not in the list, so they cannot count against the rule. The pillar piece on how database design determines the reliability of investment models defines the bias alongside look-ahead bias. This article works through the mechanics of testing a result for it.
Four ways survivorship bias enters stock data
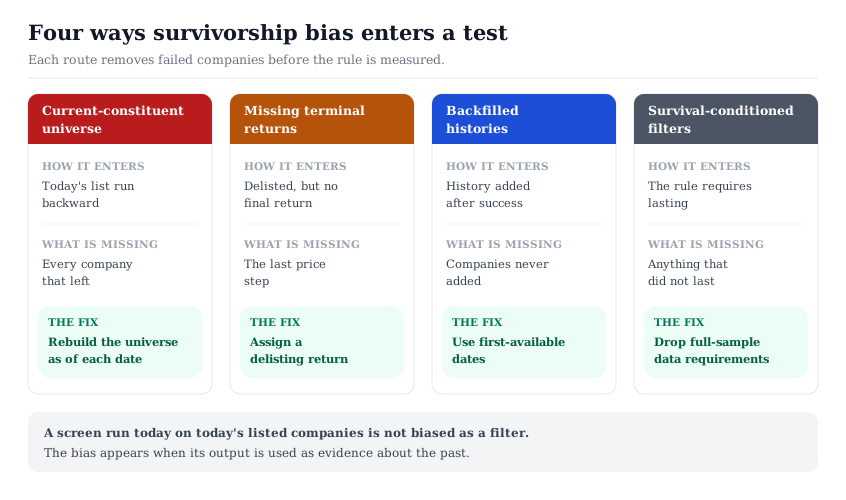
The bias rarely arrives as a single decision to drop failed companies. It usually enters through one of four routes, and a dataset can carry more than one at once.
1. A current-constituent universe. The test starts from companies listed today, or from an index's current members, and runs the rule backward. Every company that was listed at the start date and has since left is missing. This is the version most likely to appear in a spreadsheet test built from a current download.
2. Missing terminal returns. The universe includes delisted companies, but the final return is absent. A stock is halted, delisted and trades later on over-the-counter quotes at a fraction of its last exchange price, or becomes worthless. If the database records no return for that last step, the portfolio is implicitly credited with selling at the last exchange price. That sale was rarely possible, because most performance delistings arrive as surprises.
3. Backfilled histories. A company is added to a database years after it listed, and its earlier history is filled in at the time of addition. If companies are added because they became large or widely followed, the backfilled history is weighted toward success. A related look-ahead problem affects fundamentals when later revisions overwrite what was originally filed. That problem is covered in why fundamentals differ by source.
4. Survival-conditioned filters. The rule itself requires survival. A common example is a spreadsheet test that drops every company with an incomplete data series over the test window. Another is a filter such as "positive earnings in each of the next five years" that quietly uses data from after the portfolio date. Both keep only companies that lasted, whatever the stated criteria.
How large the missing returns are: the CRSP delisting evidence
The best-documented measurement comes from academic work on the CRSP stock file, the database most US return research uses. Tyler Shumway's 1997 paper, The Delisting Bias in CRSP Data, audited how that file handled companies delisted for bankruptcy, insufficient capital and other performance reasons.
The gap was large. In the 1993 file, only 11.7 percent of the 1,029 NYSE and AMEX stocks delisted for performance reasons from 1962 to 1993 had a delisting return. None of the 3,750 performance-delisted Nasdaq stocks had one. Over 4,500 performance delisting returns were missing in total. Merger and exchange-transfer delistings, by contrast, usually had returns.
Shumway then rebuilt the missing values from over-the-counter quotes and from records of companies that became worthless. Combining the new data with the returns CRSP already had, the average NYSE and AMEX performance delisting return was about minus 30 percent. The median was near minus 31 percent. Roughly two-thirds of the performance delistings he could trace in news archives were surprises rather than preannounced. So in most cases the missing return was not a loss an attentive holder could have sidestepped.
The effect on results depended heavily on what a strategy held. In a replication of size and book-to-market portfolios, assuming a total loss on every performance delisting cut the annualized return of the smallest size decile by 5.21 percentage points. Using the reconstructed over-the-counter returns, with minus 30 percent where no quote existed, cut it by 1.45 points. The largest decile did not move. Equal-weighted portfolios were more sensitive than value-weighted ones.
Two practical rules follow from the paper. Be explicit about how delisting returns are handled. Where they are missing, test with minus 30 percent as a central case and minus 100 percent as the upper bound.
A second line of research explains why survivor samples can manufacture patterns rather than just inflate levels. Brown, Goetzmann, Ibbotson and Ross showed in a 1992 study of survivorship in performance data that truncating a sample by survival can create the appearance of return predictability. Their setting was mutual fund performance persistence, but the mechanism is general. When volatile members with poor returns exit and volatile members with high returns stay, the survivors look persistently strong.
A worked example: one screen, four treatments of the exits
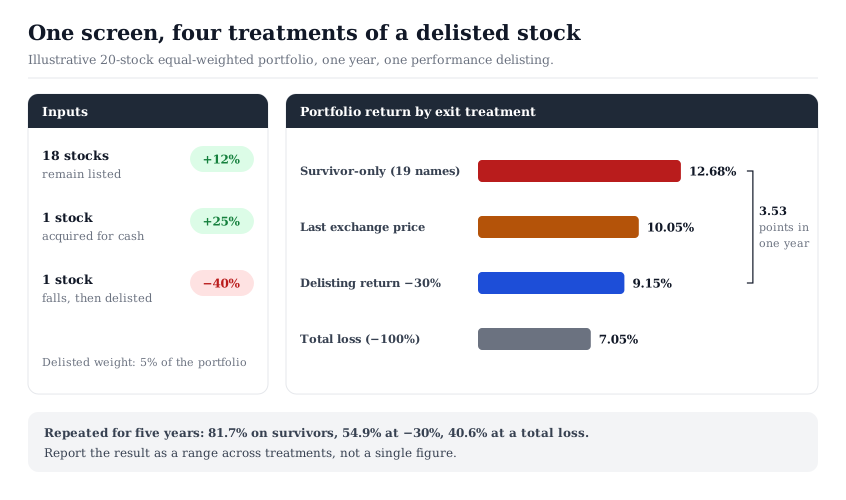
The mechanics are easiest to see on a single illustrative screen. Suppose a rule selects 20 small-cap stocks at the start of a year, equal-weighted, and holds them for twelve months. During the year:
- 18 companies remain listed and return 12 percent each.
- 1 company is acquired for cash at a 25 percent gain, with a recorded merger return.
- 1 company falls 40 percent, is halted, and is delisted for failing its exchange's continued-listing standards.
The one delisted stock is 5 percent of the portfolio. That is a high rate for a single year and is chosen to make the arithmetic visible, not to describe any market.
Four common treatments of that exit produce four different results:
- Survivor-only. The delisted company is absent from the database, so the rule is measured on 19 names. The return is (18 × 12 + 25) ÷ 19, or 12.68 percent.
- Last exchange price. The company is included, but its return stops at the last trade. The return is (216 + 25 − 40) ÷ 20, or 10.05 percent.
- Delisting return of minus 30 percent. The after-delisting loss is compounded onto the minus 40 percent, for a total of minus 58 percent. The return is (241 − 58) ÷ 20, or 9.15 percent.
- Total loss. The upper bound assumes the equity became worthless. The return is (241 − 100) ÷ 20, or 7.05 percent.
The survivor-only figure exceeds the central-case figure by 3.53 percentage points in one year. If the same pattern repeated for five years, the cumulative return would read 81.7 percent on survivors and 54.9 percent with a minus 30 percent delisting return. The total-loss bound gives 40.6 percent.
None of these is the true answer, because the true exit price is exactly what is missing. What the exercise shows is the range the data leaves open. A result that holds at 9.15 percent and 7.05 percent carries information. A result that only holds at 12.68 percent is a statement about the database.
Why value and small-cap screens are the most exposed
Survivorship bias does not fall evenly across strategies. Shumway, citing earlier work by Queen and Roll on firm mortality, expected it to concentrate in small stocks, low-priced stocks and stocks with low past returns. Those are the companies most likely to be delisted for performance. His own replications confirmed the size effect most clearly.
Many value screens select exactly that profile. A deep-value rule that sorts on low price relative to book value, earnings or liquidation value tends to hold more distressed companies than the market does. A net-net screen built on liquidation value is the extreme case: it selects companies priced near liquidation value. Some of them do fail, and a test that loses those exits measures the survivors of a portfolio built around failure risk.
Shumway's size and book-to-market table adds a qualification worth reading carefully. The total-loss treatment reduced returns at both the high and the low book-to-market ends by about one percentage point. The strong effect was in size. A value screen confined to large companies carries less exposure than a small-cap one. A screen that combines cheapness with small size, low price or recent declines stacks the exposures.
Two further features raise sensitivity. Equal-weighted results are more exposed than value-weighted results, because a small failed company counts as much as a large survivor. Cumulative-abnormal-return calculations that imply monthly rebalancing are more exposed than buy-and-hold calculations, a difference Shumway measured directly in his replication of the overreaction study.
This is why a survivorship check belongs before any conclusion about a value rule's history. The value-trap checklist works company by company on the same risk: a low multiple can reflect a business on its way out. Survivorship bias is that risk at the level of a whole test. The Stock Universe slices for small-cap stocks and value stocks show where this exposure sits in the listed market today. Their membership is a current list of listed companies.
How to test a backtest or historical screen for survivorship
The four steps summarized at the top expand into six questions, and most published results answer some of them in the methodology note. Where a question has no answer, treat the result as survivor-conditioned until shown otherwise.
- Universe date. Was the universe rebuilt as of each portfolio formation date, including companies that later left? A test built from a current download fails this question by construction.
- Exit coding. How is each exit classified: merger, exchange transfer or performance delisting? Performance delistings, and some liquidations, need a substitute return. The classification determines how many substitutes there are.
- Terminal returns. What return does a performance delisting receive? Rerun the result at minus 30 percent and at minus 100 percent. Report both.
- Data start dates. When was each company added to the dataset, and was its earlier history backfilled? Use each company's data only from the date it entered the dataset.
- Point-in-time fundamentals. Were the screen's inputs the figures as originally filed, or later revised values? The period base matters as well, a trap set out in trailing twelve months versus fiscal year data.
- Filters. Does any rule require data or survival past the formation date? Remove it and rerun.
Primary filings can close the gap for any individual company missing from a current list. Under SEC Rule 12d2-2, removing a class of securities from exchange listing requires a Form 25. The rule makes the delisting effective 10 days after filing. Outside redemptions and merger substitutions, an exchange-initiated removal also requires notice to the issuer and a chance to appeal. An issuer that receives a delisting notice, or fails a continued-listing standard, must disclose it in a Form 8-K under Item 3.01.
A search of the company's filings on SEC EDGAR will usually show which of these it filed, and when. That record separates a merger exit from a performance delisting. It also dates the exit. The terminal return runs from the last exchange trade, which can come days before the Form 25 date.
Where survivorship checks fit in the workflow
A screen and a backtest answer different questions. A screen asks which listed companies meet a set of criteria now. A backtest asks what a rule would have earned over time. The first builds a research list. The second is a claim about the past, and only the second needs a survivorship check.
The InvestViable stock screener screens the current US-listed universe on fundamentals and the Investment Score. Its output is a research list, which is the use a current-universe filter is built for. The three value-investing strategy recipes are filter configurations of the same kind. They describe what a rule selects, and any statement about how such a rule performed historically would need the six checks above.
Treat any historical claim about a rule as a range across delisting treatments, not a single figure. Record which treatment produced which number. Where a published result gives no answer on universe dates or terminal returns, carry it as survivor-conditioned until shown otherwise. The companies that are missing from a dataset are part of the result, and the test has to price them before it says anything about the rule.
InvestViable does not publish buy or sell recommendations on individual securities. All analysis is based on public financial data and a transparent methodology. The Investment Score formula is proprietary; the inputs and what the score evaluates are documented.