Net current asset value is total current assets less total liabilities. Then take out every claim ranking ahead of the common: preferred stock, and any noncontrolling interest in a consolidated subsidiary. A net-net trades below that figure, and Graham's entry rule was two-thirds of it. A liquidation value estimate applies the same idea line by line. It discounts the current assets themselves toward what they would realize in a wind-down, instead of discounting the finished total. Running both on one balance sheet charges the company twice for the same uncertainty. Apply exactly one realization discount, say which, and read the output as a lower bound on equity value, not an estimate of it.
What is a net-net stock?
Net-net stocks are companies whose market capitalization sits below their net current asset value. The construct is Graham's, and it is deliberately crude. Take current assets. Subtract every liability, current and long term. Subtract the preferred and any minority interest ranking ahead of the common. What remains is the figure. Fixed assets never enter it.
NCAV = Total current assets − Total liabilities − Preferred ranking ahead of common − Noncontrolling interests
NCAV per share = NCAV ÷ Common shares outstanding
Graham's entry threshold = ⅔ × NCAV per share
Total liabilities means all of them, not the current portion. The preferred deduction covers both redeemable and non-redeemable issues, because both stand ahead of the common in a wind-down. The noncontrolling interest comes out because ASC 810 reports minority holders inside equity and outside the parent's share, so neither of the two subtractions above reaches them.
Assigning zero to plant and goodwill is the point, not an oversight. A going-concern valuation capitalizes what the assets will earn. This one asks a narrower question: what is present now in a form the balance sheet calls current, after everyone ahead of the common shareholder is paid. Fixed assets get nothing because a wind-down realizes them last and least reliably. Current is not a synonym for near-cash, though. ASC 210 sets it by the entity's own operating cycle rather than by twelve months, and a distiller and a homebuilder both classify multi-year inventory as current.
Graham did not buy at net current asset value. He bought below two-thirds of it, which builds a discount of at least a third into the entry price. That discount does the work a margin of safety does on a discounted cash flow output, and how to calculate margin of safety sets out the general form.
Two neighboring constructs are not this one. The Graham Number caps price using earnings and book value together, and the Graham formula article covers where it applies. The price to book ratio prices book equity as a capital base the business earns on, which is the subject of price-to-book and when book value carries information. Net current asset value uses no earnings at all, and treats the balance sheet as claims to be settled instead of capital to be compounded.
How do you calculate net current asset value?
The filing hands you most of it. Regulation S-X prescribes a total current assets caption and a total current liabilities caption, both qualified as appearing when appropriate. That qualifier does real work. Real-estate and utility filers often omit the subtotal, and banks and insurers never carry it, since they file under Articles 9 and 7. Valuing a bank stock starts elsewhere. Total current assets is the starting figure. Total current liabilities is not the subtraction: this construct deducts long-term debt, deferred credits and every other obligation too.
Preferred stock needs a decision, and the regulation makes it easy. Preferred that must be redeemed, or whose redemption is outside the issuer's control, is reported outside stockholders' equity; the rest sits inside it. Both rank ahead of the common, so both come out, at redemption or liquidation value plus arrears. Regulation S-X puts carrying amount and redemption amount side by side and expects them to differ.
Noncontrolling interests are the deduction that gets missed. Consolidation brings in the whole of a partly owned subsidiary, so total current assets holds assets the minority owns part of. ASC 810 then reports that claim inside equity, not among the liabilities. Neither subtraction above reaches it. Deduct the reported balance on a screen, or on a single name the minority share of that subsidiary's current assets net of its liabilities.
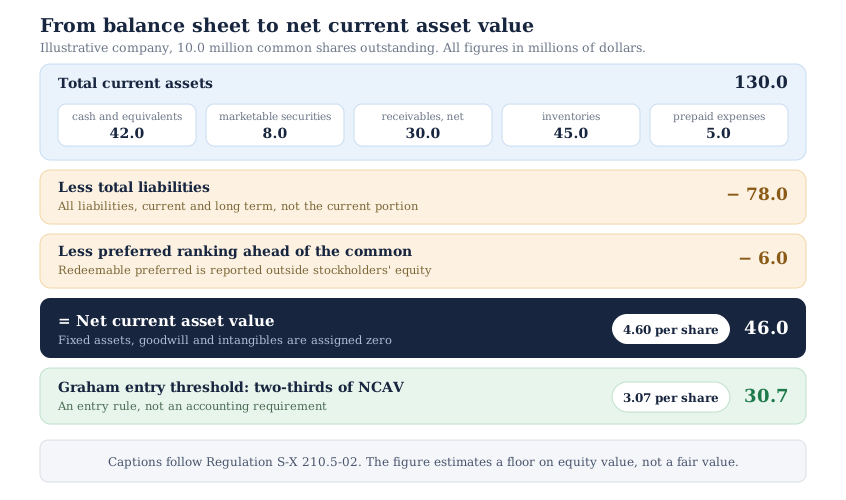
Take an illustrative company with 10.0 million shares outstanding. Current assets total 130.0 million: 42.0 cash and equivalents, 8.0 marketable securities, 30.0 receivables net of allowance, 45.0 inventories and 5.0 prepaid expenses. Property and equipment is 60.0 million net, which this construct ignores. Total liabilities are 78.0 million. Redeemable preferred stands at 6.0 million, stated at redemption value with no arrears, and there is no noncontrolling interest. Net current asset value is 130.0 less 78.0 less 6.0, or 46.0 million. Across 10.0 million shares that is 4.60 per share, and Graham's two-thirds threshold is 3.07.
Contingencies are what the total misses. The regulation carries a caption for commitments and contingent liabilities that points to a footnote instead of an amount. An indemnity, an environmental obligation or unresolved litigation can be real, material and absent from the total. Read the footnote in the 10-K first; how to read a 10-K says where. Restricted cash needs the same pass, since a balance restricted as to withdrawal is disclosed separately and is not free to the common.
Dilution falls outside the liability line as well, and it runs one way. Restricted stock units and performance shares add shares with no cash coming in, so nothing offsets them. Options and warrants add shares only if a holder exercises, which does not happen below the strike, and a stock near its floor usually carries grants under water. A convertible trades a deducted claim for shares if it converts. Take each on whether it would actually be exercised, and let the share count conventions settle the denominator.
What haircuts should you apply?
Carrying amount is not realizable amount, and the gap is where this earns its keep. Graham published rough approximations in Security Analysis in 1934. Cash assets realize their face. Receivables realize around 80 percent, on a range of 75 to 90. Inventories two-thirds, on 50 to 75. Fixed and miscellaneous assets 15 percent, on 1 to 50.
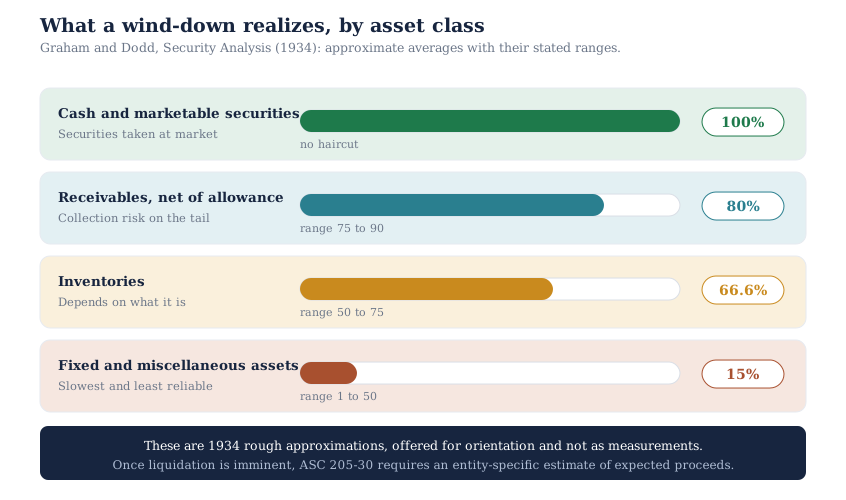
Current accounting reaches the same question on a different basis. When liquidation is imminent, ASC 205-30 carries assets at the estimated cash the entity expects to collect in settling or disposing of them. Expected proceeds replaces carrying amount, the estimate is entity-specific, and the standard is explicit that fair value may not be presumed to approximate it for every asset.
The same guidance cuts the other way once. An entity on the liquidation basis also recognizes items it never carried as assets, and the standard names previously unrecognized trademarks. So a wind-down measurement can add value the balance sheet omitted, the same expensing gap that understates book equity for a brand-heavy business. Not every adjustment is a reduction.
Two filed disclosures let you move off those averages. The first is the allowance for doubtful accounts, stated separately by requirement. Graham defined his receivable class net of usual reserves, so the allowance is no reason to skip the haircut. It tells you whether 80 percent is generous or harsh here. The second is the LIFO reserve. Where inventory is on last-in first-out, the excess of replacement cost over stated LIFO value must be disclosed if material. A large reserve says the carrying amount sits below replacement cost, which is an entry price and not what a liquidator collects. It narrows the haircut only where the exit market is near that cost, and widens it where prices have turned. It also raises the tax accrual, since selling old layers realizes the reserve as income.
Apply Graham's schedule to the illustrative company. Cash and equivalents of 42.0 million realize their face. Marketable securities realize fair value, not carrying amount, because held-to-maturity debt stays at amortized cost and ASC 321 holdings at adjusted cost. Take that from the fair value footnote; here the two agree, so the 8.0 realizes in full. Receivables of 30.0 realize 24.0 at 80 percent, applied to the net figure, where Graham's own class starts. A defended estimate moves off 80 using the aging, the concentration and the related-party split the regulation requires. Inventories of 45.0 realize 30.0 at Graham's 66.6 percent, taken here as exactly two-thirds. Prepaid expenses realize nothing here. His schedule has no class for them; the closest fit is fixed and miscellaneous at 15 percent. Taking them to zero is a deliberate deviation: a prepayment is a right to a service, not a saleable asset. Realizable current assets are 104.0 against 130.0 carrying, a reduction of 20 percent. Subtract 78.0 of liabilities and 6.0 of preferred and 20.0 million remains, or 2.00 per share.
What the wind-down itself costs
That 2.00 is gross of the wind-down's own costs. It is realizable proceeds less liabilities and preferred, before disposal costs, before the overhead paid while assets are sold, before tax, and before any allowance for time. None of the four is on the balance sheet you started from.
The standard names two of them. An entity on the liquidation basis must accrue the estimated costs of disposing of its assets, and separately the income and expenses it expects while it runs. Disposal costs are broker and auction fees, professional work, and the discount a forced timetable imposes. Operating costs are the staff, rent and insurance paid while assets are sold. Tax is the bucket the standard does not hand you, and the one most often double-counted. Selling above tax basis triggers a corporate-level gain, and the loss carryforwards the company holds are what absorb it. So accrue tax on the unsheltered remainder, not on the whole gain. The 80 percent of taxable income limit on post-2017 losses and any section 382 restriction both bite here. The part that does go to zero is a carryforward waiting on operating profit the company will never earn.
State the conventions outright. Deferred credits and deferred revenue sit inside total liabilities, and face is the transaction price ASC 606 requires rather than what settling the obligation costs. The claim in a wind-down is the refund the customer can demand or the cost of performing, whichever the contract creates. Deduct that, and say which. And the floor computed here is undiscounted. A wind-down runs over quarters or years, so proceeds arriving at the end are worth less than the same figure today. The standard makes the same choice on its cost accruals, which it forbids an entity to discount, and requires the expected duration to be disclosed instead. Do the same: name the horizon when you state the number.
Leases sit in the same place, and the screen and the claim are different numbers. Under ASC 842 an operating lease puts a liability on the balance sheet and a screen subtracts it in full. That amount is the present value of the rent promised, so it enters an otherwise undiscounted figure already discounted. Section 502(b)(6) of the Bankruptcy Code then caps a rejected real-property lease claim near one to three years of remaining rent plus arrears. The right-of-use asset sits outside current assets either way. For a long leased estate the two differ widely, so say which you deducted.
The last limit is structural, not arithmetic. A minority shareholder cannot force a wind-down. The floor is a claim on realizable assets, not a right to realize them. In practice only a controlling holder, an acquirer or an activist converts one into the other. That is why a price can sit below the floor for years without anything correcting it.
Two conservatisms, applied once
Graham's two-thirds rule and the haircut schedule price the same uncertainty: whether current assets realize what they are carried at. Running both charges the company twice for it.
Be precise about which axis this is. Excluding fixed assets is a scope decision, and it answers a different question, which assets count at all. Scope and realization compose without double-counting, which is why the 2.00 above is a legitimate figure. Two realization discounts do not compose. That is the one to apply once.
That scope choice is worth stating outright. The worked example carries Graham's net-net rule of zero on fixed assets straight through the haircut step, so 2.00 is a floor beneath his own liquidating value. Credit the 60.0 of property and equipment at his 15 percent and the estimate becomes 29.0 million, or 2.90 per share. The gap between 2.00 and 2.90 is a choice about whether plant belongs in the answer. Make it out loud.
On the figures above the undiscounted floor is 4.60 per share, and two-thirds of it is 3.07. The haircut floor is 2.00 per share before any entry discount is applied at all. So the haircut version is already stricter than Graham's own entry rule, by roughly a third again. Stacking the two would produce 1.33 per share, and nobody chose that number. A third is also a wider buffer than realization risk alone would justify, and contingencies, holding period and estimation error all sit inside it. So if you have defended the haircuts line by line, whatever buffer you keep on top covers error in your own percentages. It is not a second discount for the same realization risk.
Decide which discount is doing the work and state it. The criterion is whether you have read the footnotes. Across a screen you have not, so the two-thirds rule is the honest instrument: a blanket buffer against carrying amounts you have accepted without checking. On a single name you have read the inventory note and the allowance, and a defended percentage per line beats a flat third. The two-thirds figure is not a constant of nature either. It was a buffer against industrials carrying mostly inventory and receivables, and a company holding 90 percent of its current assets in Treasury bills does not need it.
These are not two estimates of one quantity, so a mid-point between them means nothing. They are one floor computed under two different assumptions about realization, and the honest output names the assumption instead of splitting the difference. The same discipline applies whenever valuation methods disagree: the spread carries the information, and averaging deletes it.
Why are there so few net-net stocks today?
Several mechanics work against the population, and they compound. The companies Graham screened were inventory-heavy and receivable-heavy industrials, so current assets were large relative to everything else on the page. Much of what generates earnings today was expensed rather than capitalized, so it reaches no asset caption at all and cannot help a current-asset test. And lease obligations now sit on the balance sheet as liabilities while their matching assets stay outside current assets. That pushes the calculation down for any company with a large leased estate.
What the screen does return follows from the same mechanics. A surplus of current assets over every liability tends to persist only where no flow is consuming it. The names that clear the test are usually the ones where something is. The profitable, debt-free microcap is the counterexample worth looking for, so check the flow before assuming the floor is eroding. Net current asset value is a stock measured on one date. Cash burn is a flow. A floor of 4.60 per share against a quarterly burn of 0.60 is a different proposition from the same floor against a burn of 0.05. The balance-sheet check for that sits in how to value unprofitable companies.
Screen hits also fail on the claims the total misses. Take an inventory line that has not turned in two years. It clears the test at full weight, and the reason nobody has bought it is the reason a liquidator will not either. A receivable from a related party fails the same way, for reasons the footnote records and the caption does not. The earnings-quality red flags that distort an income statement distort these captions too, because the allowance and the write-down are one judgment applied in two places.
The practical use is therefore not a buy list. It is knowing where the floor sits on a company you are already valuing for other reasons. The screen is one way to find names where that distance is short enough to matter.
What a failed floor test still tells you
Equity is worth the higher of two things: its value as a going concern, and the value of the shareholders' option to liquidate. Damodaran sets out that pairing in his chapter on distressed equity, and notes that for most firms the going-concern figure is the larger of the two. His option takes the firm's whole liquidation value as the underlying and the face of the debt as the strike. A net current asset value floor is a narrow proxy for that underlying, built from current assets alone. A floor far below the price is not a failed test. It is the test returning its ordinary answer, which is that the business is worth more running than broken up.
That framing also answers the result most readers will actually get. Run this on a company picked at random and the figure usually comes out negative, because for most listed filers total liabilities exceed current assets. The exception is a cash-rich balance sheet carrying little debt, which is where the surviving net-nets are. A negative floor does not mean the equity is worth nothing. It means the option is out of the money, and an out-of-the-money option keeps value while there is time left on it. What the negative figure does tell you is that the balance sheet alone will not support the price, so the entire case has to come from the business.
The floor becomes decision-relevant in two settings. The first is a price that has fallen toward it, where the distance between the two is the loss the balance sheet alone would absorb. The second is a company whose going-concern estimate rests on a profit that has not arrived. The floor is then the part that does not depend on the forecast.
Used that way the floor belongs at the bottom of a range, not in a headline. Running the operating estimate across its assumptions, as valuation sensitivity analysis sets out, gives the upper part. The floor gives the lower part, and it moves for different reasons, which is what makes it a second anchor and not a duplicate.
A floor above the price is a question, not an answer. Something is being priced that the subtraction did not capture, and the candidates are finite. A contingency may sit in the footnotes. Receivables may not collect, or inventory may have no buyer. A controlling shareholder may have no interest in realizing anything. Or a burn rate may consume the surplus first. Work through those before concluding the market is wrong.
Where the floor test fits in your workflow
Run the floor after the operating estimate, not instead of it. Start with the method the business calls for, which which valuation method to use helps you pick. Then compute net current asset value from the filing. Subtract every liability and not just the current ones, take out the preferred and the minority interest, and read the footnote on contingencies. Decide whether you are applying the two-thirds rule or a defended haircut schedule, and apply exactly one realization discount. Record both the floor and the operating estimate. The width between them is the part of your position that does not depend on the forecast holding.
For the operating estimate the InvestViable Valuator keeps the discounted cash flow's inputs on the surface: the cash flow growth path, the discount rate, and the terminal growth rate. The InvestViable stock screener narrows the US universe on fundamentals and carries the Investment Score. A current-asset test only has a chance among smaller, balance-sheet-led names, so start in the value slice of our Stock Universe and the small-cap slice. The discount you require once the estimate is built is a separate discipline, set out in margin of safety as an operational definition. The full method-selection question sits in the stock valuation methods and DCF guide.
InvestViable does not publish buy or sell recommendations on individual securities. All analysis is based on public financial data and a transparent methodology. The Investment Score formula is proprietary; the inputs and what the score evaluates are documented. The per-share figures in this article are illustrative and exist to demonstrate the arithmetic. The realization percentages are Graham's published rough approximations from 1934, not measurements of any company.