
Use the diluted share count for per-share valuation, the latest cover-page outstanding count for market capitalization, the weighted-average count for earnings-per-share comparisons, and float only for liquidity and index questions. Each count answers a different question; the errors start when one count substitutes for another.
The share-count ladder: authorized, issued, outstanding
Every share count in a filing sits on one ladder. At the top is the authorized count: the maximum number of shares the corporate charter permits. Raising that ceiling requires a shareholder vote, so the authorized count moves rarely and sits far above the rest of the ladder. It is headroom for future issuance.
Issued shares are the shares the company has actually created: sold in offerings, granted to employees, or handed over as acquisition currency. Treasury shares are issued shares the company later repurchased and still holds. They carry no vote and receive no dividend, and they leave the issued count only if the company formally retires them.
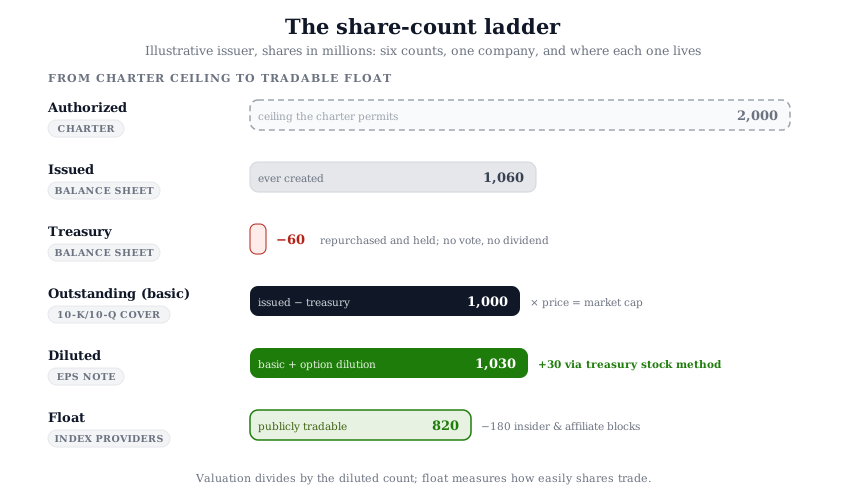
Outstanding shares are issued shares minus treasury shares. This is the count most people mean by share count: the common stock currently held by investors. Multiplied by the market price, it produces market capitalization. The illustrative issuer used throughout this article has 2,000 million shares authorized, 1,060 million issued, 60 million in treasury, and therefore 1,000 million outstanding.
Figure 1. The share-count ladder
Illustrative issuer, shares in millions: six counts, one company, and the filing address of each.
One refinement matters before the ladder continues downward. A count taken on a single date is a snapshot, and earnings-per-share arithmetic does not use snapshots. It uses the weighted average of the outstanding count across the reporting period, so that shares issued or repurchased mid-period count only for the fraction of the period they existed. A company that bought back stock steadily all year shows a period-end count visibly below its weighted average. Both numbers are correct; they answer different questions. The snapshot describes the claim structure today. The weighted average describes the denominator that matches a flow measured across the whole period.
What diluted shares outstanding means
Diluted shares outstanding start from the basic count and add the shares that existing securities would create if they converted into common stock. Stock options, restricted stock units, warrants, and convertible bonds are all claims that can become shares. A per-share figure that ignores them divides the business among fewer owners than actually hold claims on it.
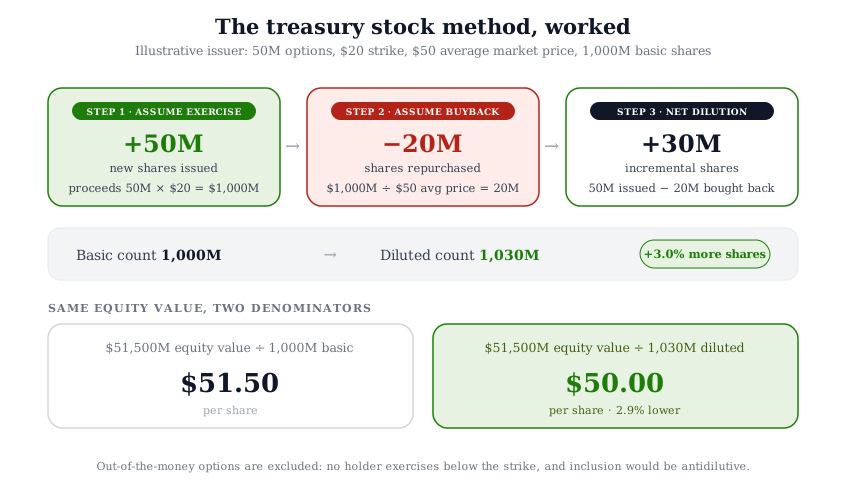
Options and RSUs enter the diluted count through the treasury stock method. The method assumes three things happen at once. Every in-the-money option is exercised, and the company collects the exercise proceeds. Those proceeds are assumed to repurchase stock at the average market price for the period. Shares issued minus shares repurchased equals the incremental dilution. For unvested awards, unrecognized compensation cost counts as additional assumed proceeds, which is why an RSU with no exercise price still adds slightly less than one full share.
The illustrative issuer carries 50 million options struck at $20 while its stock averages $50. Assumed exercise creates 50 million new shares and $1,000 million of proceeds. The assumed buyback at $50 retires 20 million shares. Net dilution is 30 million shares, and the diluted count is 1,030 million against a basic count of 1,000 million.
Figure 2. The treasury stock method, worked
Illustrative issuer: 50M options at a $20 strike, a $50 average market price, and a 1,000M basic count.
Convertible bonds and convertible preferred stock use the if-converted method instead. Assume conversion at the start of the period and add the conversion shares to the denominator. Then add back to the numerator the after-tax interest on convertible debt, or the preferred dividends (which carry no tax adjustment), that the company would have saved.
Two boundaries limit the reported number. First, out-of-the-money options are excluded, because no holder exercises below the strike. Second, U.S. GAAP excludes any security whose inclusion would raise earnings per share rather than lower it. For a loss-making company that rule catches everything: adding shares to the denominator of a loss shrinks the loss per share, so the reported diluted count collapses back to basic. The overhang is still there; it sits outside the EPS arithmetic, disclosed in the antidilutive-exclusions note instead. That quirk matters when valuing companies with no earnings yet, where reported diluted counts systematically understate the true claim structure.
The reported diluted count is also a rear-view number in one more way. It capitalizes the awards already granted, not the grants still coming. An issuer that pays a meaningful share of compensation in stock adds new claims every year, a dynamic concentrated in software and other technology stocks. Aswath Damodaran's paper on employee stock options and restricted stock works through the valuation treatment: value the outstanding options as a separate claim, or project the future dilution explicitly. Either way, treat the filing's diluted count as a floor for the adjustment.
What float measures, and what it does not
Float is the subset of outstanding shares available for public trading. Start from the outstanding count and remove the blocks that do not trade. Those blocks include founder and family stakes, shares held by directors and officers, strategic corporate holdings, and restricted stock that cannot yet be resold. The SEC's overview of restricted and control securities under Rule 144 explains when those blocks can reach the public market. The illustrative issuer's insiders and affiliates hold 180 million of its 1,000 million outstanding shares, leaving a float of 820 million.
Unlike every count above it on the ladder, float has no single authoritative definition. Each index provider and data vendor draws its own line on which holders count as non-public. S&P Dow Jones Indices documents its float adjustment methodology, assigning each company an investable weight factor that scales index weight to the float rather than to total capitalization. Other providers classify government stakes or founding-family trusts differently. Two platforms quoting different float percentages for the same company are usually applying different definitions.
The 10-K cover page carries a float-adjacent disclosure: the aggregate market value of common equity held by non-affiliates. The figure is stated as of the last business day of the company's most recently completed second fiscal quarter. It is a legal-status measure rather than a tradability measure, but it is the closest thing to a float figure inside the filings themselves. The proxy statement's beneficial-ownership table fills in the rest, listing the insider and five-percent blocks a float calculation removes.
Multiple share classes complicate every count on the ladder. The filing cover page lists each class separately, and market capitalization sums them all at their respective prices. Super-voting founder classes usually sit outside the float entirely, and index providers weight only the listed class they track. A dual-class issuer therefore reports one outstanding total and trades on a float that can be a fraction of it.
Float exists for liquidity and index mechanics. A low-float company trades thin, moves sharply on modest volume, and carries wide spreads, and float-adjusted weighting determines how much of it index funds hold. Screens that filter on market capitalization or trading volume, in whichever stock screener produces the list, sit downstream of these mechanics.
Float is not a valuation denominator. Intrinsic value per share divides the equity value by the claims on it, and an insider-held share is exactly as much a claim as a publicly traded one. Dividing by float overstates per-share value in direct proportion to the insider stake. For the illustrative issuer the error is material: $51,500 million of equity value divided by the 820 million float suggests roughly $62.80 per share, against $50.00 on the diluted count. The float figure answers how easily shares change hands. It says nothing about what a share is worth.
Where each share count lives in the filings
Every count on the ladder has a fixed address in the filings on SEC EDGAR.
The cover page of the 10-K and 10-Q states the number of shares outstanding as of the latest practicable date, which usually postdates the balance sheet by several weeks. This is the freshest count in any filing and the right starting point for market capitalization.
The balance sheet's equity section reports shares authorized, issued, and held in treasury as of the period-end date. A gap between the cover-page count and the balance-sheet count is timing: buybacks and grants that landed between the period end and the filing date.
The income statement presents basic and diluted earnings per share, and most issuers show the two weighted-average denominators on its face. The EPS note behind it reconciles the two and discloses the securities excluded as antidilutive, which is where a loss-maker's hidden overhang becomes visible.
The proxy statement carries the beneficial-ownership table: directors, officers, and holders above five percent. It is the primary-source input for any float estimate.
The SEC's investor bulletin on how to read 10-K and 10-Q reports maps where each statement sits inside the filing. The value-investor walkthrough in how to read a 10-K covers the same documents at workflow depth. Tracing a platform's share count back to one of these four addresses takes minutes, and it follows the same trace-to-filing discipline as the fundamental analysis checklist. A platform figure that matches none of the four is applying an adjustment worth identifying before the number feeds anything downstream.
Why the denominator moves the valuation
Per-share value is a fraction, and the share count is the entire denominator. Whatever the model produced as equity value, a different count moves the per-share output mechanically. The illustrative issuer's $51,500 million of equity value is $51.50 per share on the basic count and $50.00 on the diluted count. The 2.9 percent gap comes from nothing except the denominator. Heavier option and RSU loads widen the spread well past that. The cross-platform audit in why valuations differ across platforms finds share-count definition to be the largest single source of per-share divergence between data platforms. For stock-compensation-heavy issuers the divergence runs ten to twenty-five percent.
The count also drifts, which turns a definitional problem into a freshness problem. Buybacks shrink the count quarter by quarter; stock compensation grows it. For an issuer repurchasing at pace, the weighted-average count runs above the period-end count, and both run above the cover-page count of the newest filing. A platform serving last fiscal year's share count against today's price computes a market capitalization that never existed on any date. Which vintage of the count a database stores, and when it updates, is a stock market database design question: the same point-in-time discipline that governs fundamentals applies to the denominator.
Screeners inherit all of it. A market-capitalization filter built on basic shares and one built on diluted shares rank borderline companies differently. A P/E column computed on weighted-average diluted earnings will not match one computed on period-end shares. None of this is visible on the output. The audit question is the one that applies to every field on a data platform: which definition, from which filing, as of which date.
Inside a model, the choice compounds. The DCF inputs checklist treats share count as one of its six input categories for exactly this reason. An enterprise-value model can be assumption-perfect and still miss per-share value by double digits, because the denominator was stale or basic.
Choosing the count for the task at hand
Each job has a right denominator. For market capitalization, use the cover-page outstanding count from the latest filing: the freshest snapshot of the claim structure. For per-share intrinsic value, build a current diluted count: the latest cover-page outstanding figure plus the treasury-stock-method dilution from the equity-compensation note. Extend it with projected dilution for issuers that grant heavy stock compensation. For earnings-per-share comparisons, keep the weighted-average convention the filings use, so the figure stays comparable to the company's own reported numbers. For liquidity screens and index questions, use float, and expect it to vary by provider.
Whichever counts the analysis settles on, write them down. A model note that records the count, its filing source, and its as-of date can be re-audited in one pass when the next 10-Q lands. A note that records only a number cannot. The habit costs a minute and removes the most common silent error in per-share work.
The denominator is decided at the data layer, before any modeling starts. The InvestViable Valuator surfaces its core inputs: the cash flow growth path, the discount rate, and the terminal growth rate. Whichever tool runs the discounting, the count that converts the resulting equity value into a per-share figure comes from the filings, and verifying it takes minutes. When two sources still disagree on a per-share figure after the count is verified, the remaining gap has other owners. Time-period base, GAAP treatment, currency, and restatement layer are reconciled in the cross-platform data-source audit.
InvestViable does not publish buy or sell recommendations on individual securities. All analysis is based on public financial data and a transparent methodology. The Investment Score formula is proprietary; the inputs and what the score evaluates are documented.