
Analyze a buyback in three steps. First, test the repurchase price against your own estimate of value, because buying back stock above value transfers wealth away from continuing shareholders. Second, verify the net share-count change across consecutive annual reports, since employee stock issuance offsets much of the gross spend. Third, check the funding source: programs paid from free cash flow after reinvestment read differently from programs funded with debt. Then read insider activity on Form 4 with the buy-sell asymmetry in mind: clustered open-market purchases are the strongest configuration, scheduled 10b5-1 sales the weakest. Treat both signals as adjustments to your required margin of safety, never as a buy trigger.
What buybacks and insider activity actually signal
Both signals are disclosures by the people holding the most information about the business. A buyback is the board allocating the company's capital; an insider trade is an executive allocating personal capital. Markets tend to read both as endorsements. They are closer to testimony: statements of conviction that still need cross-examination against the filings. Boards misjudge their own stock, and executives sell for reasons that have nothing to do with the business.
The boundary with neighboring checks matters. The value-trap safety checklist uses one insider read as a veto: sustained discretionary selling with no offsetting purchases is grounds to disqualify a candidate outright. This article covers the evidence lane behind that veto and its buyback counterpart. It works through what each pattern means, where the filings verify it, and how much weight each deserves. The output feeds the due diligence triage as a discount, a monitor item, or in the severe configurations a disqualifier.
One framing rule governs everything that follows. Capital-allocation signals condition the price test; they never replace it. A company repurchasing stock aggressively can still be overpriced, and a company with insiders buying can still be a value trap. The signals change how much protection you demand and how hard you verify. The valuation still has to be done.
Stock buybacks analysis: the price-versus-value test
A repurchase is a transaction between the company and its exiting shareholders, executed with money that belongs to the continuing ones. That framing makes the first check obvious. When the company pays less than the stock is worth, the sellers subsidize the holders. When it pays more, the holders subsidize the sellers. The program's size, its press release, and its effect on earnings per share are all secondary to that one variable.
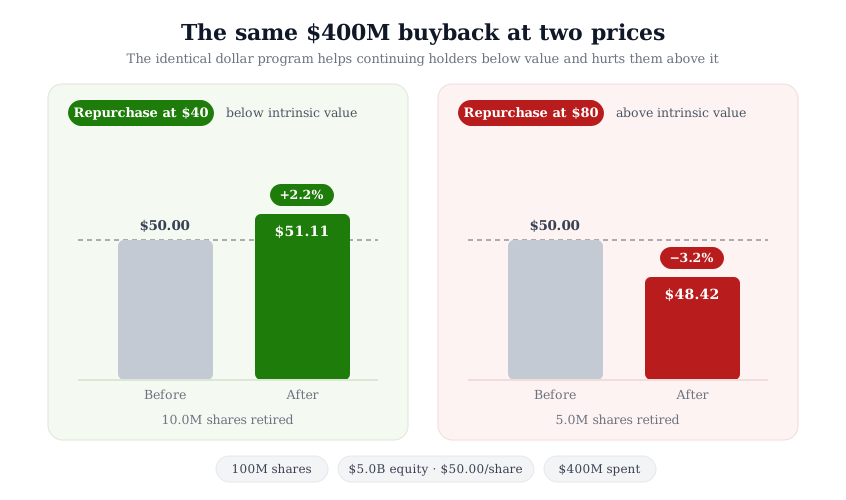
Illustrative arithmetic makes the transfer visible. A company has 100 million shares and a defensible equity value of $5.0 billion, or $50 per share. It spends $400 million on repurchases. At $40 per share, the buyback retires 10 million shares. The remaining $4.6 billion of value spreads across 90 million shares, or $51.11 each: continuing holders gained roughly 2 percent. At $80, the same $400 million retires only 5 million shares. Now $4.6 billion spreads across 95 million shares, or $48.42: continuing holders lost about 3 percent. Same company, same spend, opposite outcomes. The only variable that moved was price against value.
Figure 1. The same $400M buyback at two prices
With 100M shares and a $50 per-share value, the identical dollar program helps continuing holders at $40 and hurts them at $80.
Warren Buffett's standing condition in the Berkshire Hathaway shareholder letters is the compact version of this test. Repurchases serve continuing shareholders when the company holds ample funds for its operations and the stock sits materially below a conservative estimate of intrinsic value. Both halves are load-bearing. A cheap repurchase funded by starving the business fails the first clause; a well-funded repurchase at any price fails the second.
The test therefore needs your value estimate, not management's. Work out a range before reading the program, using the same discipline you would apply to any valuation. The InvestViable Valuator holds that structure fixed for every covered ticker. Its core inputs are the cash flow growth path, the expected return you demand (the discount rate), and the terminal growth rate. Price the stock against your range, then ask which side of it the company is transacting on. The margin of safety formula turns the answer into a discount you can track across reporting periods.
Net buybacks: verify the share count, not the announcement
The announcement is the least reliable part of a buyback. An authorization is a permission the board grants itself, not a commitment: programs run for years, can be paused without any announcement, and frequently lapse partly unused. Headlines report the authorized total. The filings report what actually happened, and the two often diverge. The quarterly issuer-purchases table (Item 2 of Part II in the 10-Q, Item 5 in the 10-K) reports shares repurchased by month and the average price paid. That average price is the number the price-versus-value test actually needs.
Two lines in the cash flow statement's financing section carry the facts. Repurchases of common stock records the gross dollars spent buying shares in. Proceeds from issuance of common stock, a few lines away, records the dollars raised selling shares out, mostly through employee compensation plans. Companies with heavy stock-based compensation can spend billions on the first line while the second, plus new grants, replaces most of the retired shares. The gross number is real cash spent; whether it changed anything shows up only in the share count.
Net buybacks
Gross repurchases minus new share issuance over the same period, observable as the year-over-year change in the diluted weighted-average share count. Only net retirement concentrates a continuing shareholder's claim; a program that offsets employee issuance holds the count flat and concentrates nothing.
The verification is one table. Pull the diluted weighted-average share count from two or three consecutive annual reports and read the trend. The 10-K section map locates the count with the income statement and the two cash-flow lines nearby. Verify against the primary filing in the company filings on SEC EDGAR rather than a data platform, because share-count definitions vary across providers. A falling diluted count is a net buyback. A flat count despite years of gross spend means the program is compensation plumbing.
The count also disciplines two optical effects. A shrinking denominator lifts earnings per share with no change in the business, which flatters growth screens. It also shrinks the equity base, which is one of the two ways return on equity gets flattered without operational improvement. And for valuation work, the share-count path is a live input: the DCF inputs checklist covers how a sustained program changes per-share value even when enterprise value stands still.
How a buyback is funded changes its meaning
The same repurchase reads differently depending on where the money came from. Three funding profiles cover most cases, and the cash flow statement separates them.
The cleanest profile is surplus free cash flow. Operating cash flow covers maintenance capital, the reinvestment the strategy claims to need, and the dividend, and repurchases absorb what remains. Here the program signals that the board sees the stock as its most attractive remaining use of capital, and the price-versus-value test decides whether that judgment holds. The second profile is debt-funded repurchase, visible when buybacks run alongside rising borrowings. That is not automatically a failure; it is a leverage decision, and it should be judged as one, through interest coverage, maturity schedule, and cyclicality. But the signal changes from surplus capital to a balance-sheet bet on the equity. The third profile is circular: repurchases running alongside significant equity issuance, which mostly recycles shareholder money through the compensation system. Since 2023, US net repurchases have also carried a 1 percent federal excise tax, a small friction in the payout math.
Opportunity cost frames the judgment without requiring an opinion about management. Every repurchase dollar competes with reinvestment in the business, debt reduction, and dividends. The return on a repurchase is set by the price-to-value ratio. Buying $1.00 of value for $0.80 earns a return few capital projects can match. Buying it for $1.25 locks in a loss no project would be allowed to show. For context on the channel's scale, Damodaran's financing-flow data tracks dividends, buybacks, and issuances by sector for US companies, which anchors what a normal payout mix looks like.
How to read insider transactions on Form 4
Corporate insiders in US markets file their transactions in near real time. Officers, directors, and owners of more than 10 percent of a class of shares must report trades in company stock within two business days on Form 4. The filings are public on EDGAR the day they arrive. The SEC's investor-education page on Forms 3, 4, and 5 summarizes who files what and when.
The transaction code column does most of the analytical work. Code P marks an open-market purchase with the insider's own money. Code S marks an open-market sale. Code M marks an option exercise, and A marks a grant or award from the company. The codes separate choices from mechanics: an M followed by an S is compensation being converted to cash, while a standalone P is a conviction trade. Reading the code column before reacting to a headline avoids most of the common misreadings.
One more field changes the weight of any sale: the Form 4 checkbox that flags a 10b5-1 trade. The 2022 amendments added the box, along with the plan's adoption date. These are prearranged trading schedules an insider adopts while not in possession of material nonpublic information, and sales executed under them are largely calendar events rather than fresh decisions. The SEC's 2022 amendments to Rule 10b5-1 tightened the regime with cooling-off periods before trading can begin, certification requirements, and limits on overlapping plans. A scheduled sale set months in advance says little about this quarter.
The asymmetry between buys and sells follows from motive. An insider sells for taxes, diversification, a house, or an expiring option, and only sometimes because of the business. An insider buying on the open market with personal money has one motive worth modeling. That is why the two directions never deserve equal weight.
Which insider patterns carry signal
Within the buy-sell asymmetry, configuration decides how much a filing means. The strongest pattern is the cluster: several insiders making code-P purchases with their own money inside a short window, especially after a price decline. Academic work supports the ordering. Lakonishok and Lee examined insider filings across NYSE, Amex, and Nasdaq companies from 1975 to 1995 in NBER Working Paper 6656. They found insider purchases more informative than insider sales, with the predictive content concentrated in smaller firms.
Weigh a lone purchase before you count it. Size it against the insider's existing holdings and annual compensation. A chief financial officer adding meaningfully to an already large position is one fact. A new director making a token purchase to satisfy an ownership guideline is another. Role matters for the same reason. Finance and operating executives see the numbers first; outside directors often trade on the same schedule as everyone else.
Figure 2. Reading insider activity: a signal-strength ladder
Direction and configuration together set the weight. Open-market purchases carry the most information; scheduled and mechanical transactions carry the least.
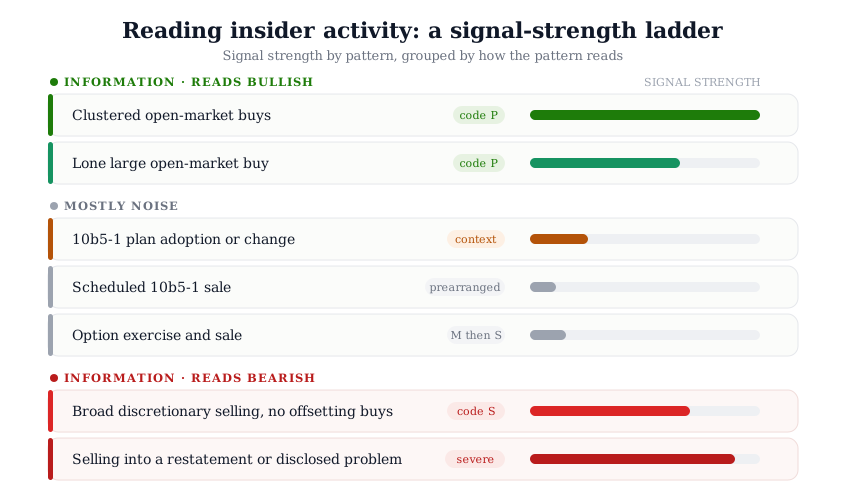
The noise band in the middle of the ladder absorbs most filings. Scheduled 10b5-1 sales, option exercise-and-sale sequences, tax-withholding dispositions, and small trades relative to the insider's wealth are the everyday plumbing of executive compensation. Treating them as signals produces a steady stream of false alarms at any large company. The plan filings themselves occasionally matter at the margins. An unusual adoption or modification right before a results season is context worth noting, and exposing that timing is part of what the 2022 amendments were designed to do.
The bearish end of the ladder is narrow but serious. Broad discretionary selling by multiple insiders with no offsetting purchases is the configuration the safety checklist treats as a veto. It deserves that treatment only after the codes confirm the sales were choices rather than schedules. Selling concentrated around a restatement, an auditor change, or a disclosed problem is the severe case. It pairs a capital signal with a trust signal. In the due diligence triage, that combination reads as a disqualifier rather than a discount.
High insider ownership is a different fact from insider buying. It is a standing condition, and a useful one; it aligns incentives over years. The ladder reads the flow, not the stock: what the people with the most information did with their own money this quarter.
Where buyback and insider signals fit your workflow
The two reads enter late, and their job is to move the margin-of-safety bar. A value-priced repurchase program alongside clustered insider buying is corroborating evidence: it can justify operating at the lower end of the margin-of-safety range your risk assessment requires. Repurchases executed above your value range alongside heavy discretionary selling push the other way, widening the requirement or ending the analysis. In both directions the signals move the bar the price test must clear. They never substitute for the test itself.
Placement in the funnel follows from that role. In the five-step valuation workflow, the reads belong to the evidence-gathering middle, after screening and before the verdict. The stock screener narrows the US universe on fundamentals. Mature cash-generative pools such as the quality stocks slice of the Stock Universe are where sustained repurchase programs most often appear. For any name that advances, run the earnings-quality checks before trusting per-share trends. A buyback-driven EPS lift sits on top of whatever the accruals are already doing. Then record both reads in the dossier with their filing pointers. The share-count trend carries its 10-K citation; the insider configuration carries its Form 4 dates.
The habit that makes the signals usable is the same one that makes the rest of the workflow auditable: write down what the filing showed. A buyback headline and a Form 4 alert are invitations to check two tables. The tables take fifteen minutes, they come from primary sources, and they regularly contradict the story. The gap between the story and the table is where these two signals earn their place in a disciplined process.
InvestViable does not publish buy or sell recommendations on individual securities. All analysis is based on public financial data and a transparent methodology. The Investment Score formula is proprietary; the inputs and what the score evaluates are documented.