
Value a bank on the equity side. Start from reported book equity, and keep the return you apply measured on that same base. Add the present value of the returns the bank earns above its cost of equity. The same answer states as a multiple: justified price to book equals return on equity minus growth, divided by the cost of equity minus growth. A lender earning 12 percent on equity, growing at 4 percent, discounted at 10 percent, justifies 1.33 times book. If your earnings are stated on a market yield, deduct any unrecognized held-to-maturity shortfall once. Then check that the growth rate is one the bank's capital position can fund.
How to value a bank stock: start by discarding enterprise value
Enterprise value exists to remove a funding decision from a valuation. Add debt, subtract cash, and what remains is the operating business, priced independently of how the owners chose to pay for it. The method assumes the borrowing and the operating are separable activities, and for a lender they are the same activity.
Run the bridge anyway and the arithmetic makes the point. Take a lender with assets of 100, funded by 85 of deposits, 5 of other borrowings and 10 of equity. It holds 8 of cash and reserves and trades at 12. Enterprise value comes to 12 plus 90 minus 8, or 94. That is 7.8 times its market capitalization and 9.4 times its book equity, and 95.7 percent of it is borrowed funding. The deposit book alone is 90.4 percent of it, and that book is the business rather than the way the business was paid for.
Cash fails the same test from the other side. Subtracting cash treats it as a balance the owners could withdraw without touching operations. A bank's cash and reserve balances are working inventory, and liquidity rules set expectations for how much stays. Free cash flow to the firm inherits the whole problem. It asks you to forecast cash flow before financing, on a company whose financing is its input cost.
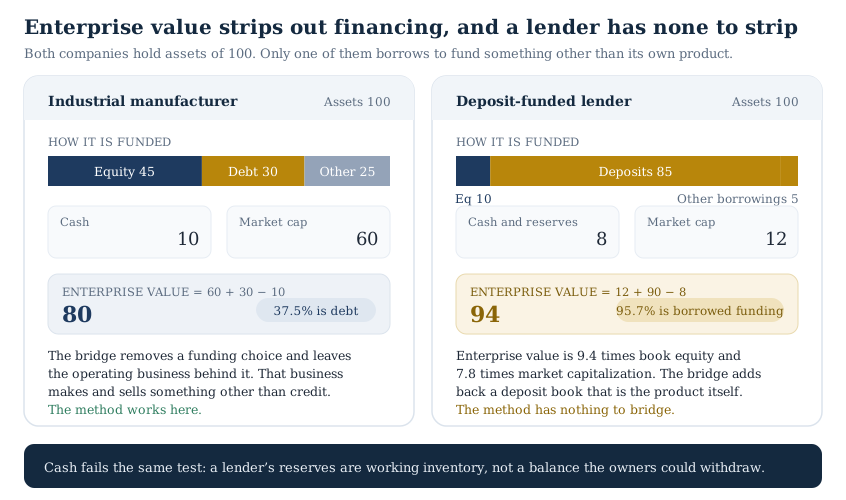
This is a different failure from the one that stops a mechanical model on a company with no profits. There the method is sound and the inputs have not arrived yet. That is why valuing an unprofitable company turns on a path to profitability or an asset floor. Here the inputs are all present and the frame is wrong. Sector valuation reaches the same conclusion from the multiples end and stops there. It notes only that equity-side metrics hold up where enterprise-value metrics do not.
What drives a bank's earnings: net interest margin, fees, and the provision
A lender earns on a spread and reports it as net interest margin: net interest income over average earning assets. The industry figure is published quarterly. FDIC-insured institutions reported a net interest margin of 3.32 percent in the second quarter of 2026. Return on assets came to 1.37 percent across 4,238 banks and savings institutions. Both figures come from the FDIC Quarterly Banking Profile released on August 25, 2026.
A bank holding equity equal to 10 percent of assets converts a 1.37 percent return on assets into 13.7 percent on equity. That equity ratio is a capital-structure choice management makes, not a property of the lending business. Return on assets is therefore not comparable between a lender and an industrial. The comparison of return on invested capital, equity and assets makes the point directly: for a bank, assets are the business. Return on equity is the metric that travels, and it is the one the valuation needs.
Fee income sits alongside the spread and behaves differently. Deposit service charges, card interchange, wealth management and mortgage servicing carry their own margins and their own cyclicality. None of them scales with the balance sheet the way net interest income does. Forecast the two separately, or the growth rate you produce is a blended guess.
The provision for credit losses is the line that decides the year, and it is neither a payment nor a default. Under the current expected credit loss model a lender books lifetime expected losses on a loan at origination. The allowance is the measured quantity, remeasured each period against the portfolio that exists. The provision is the plug that reconciles the opening allowance to the required closing figure after charge-offs.
That ordering changes how you read the two numbers. A provision above net charge-offs often just funds a growing loan book. Read the allowance as a percentage of loans before calling it a build. A provision persistently below charge-offs can mean an allowance being drawn down, or a shrinking book, or an improving forecast. Pull both figures from the allowance footnote in the filings on SEC EDGAR and check the ratio, not the direction. Earnings quality red flags covers the generic mechanics of reserve building and release. On a lender the same behavior moves a number large enough to decide the year, because the loan book is the balance sheet.
Which book value to start from: reported, tangible, and the held-to-maturity gap
Every equity-side route starts from book value, which makes the definition of book value a valuation input rather than a lookup. Three items matter: goodwill and other acquired intangibles, the securities marks the accounting already handles, and the held-to-maturity gap that never reaches the balance sheet.
Goodwill and other intangibles come first. Take a lender reporting common equity of 44.00 per share, of which 6.00 is goodwill and acquired intangibles. Tangible book value per share is 38.00. Regulatory capital deducts goodwill too, though net of associated deferred tax liabilities, so the capital deduction is smaller than the gross figure tangible book removes. Mortgage servicing assets face threshold limits under 12 CFR 217.22 rather than a full deduction.
Securities marks come second, and the accounting already does part of the work for you. Available-for-sale debt securities are carried at fair value. The non-credit portion of any decline runs through accumulated other comprehensive income into reported equity. Credit-related declines are recorded as an allowance for credit losses charged to earnings.
Reported equity and regulatory capital diverge here. Only banks outside the advanced approaches could make the one-time election under 12 CFR 217.22, which keeps most accumulated other comprehensive income out of regulatory capital. The largest banks had no such option, so their available-for-sale marks do reach common equity tier 1.
Held-to-maturity securities are the third item and the one that hides. They are carried at amortized cost less an allowance for credit losses, so the allowance absorbs credit while a rate-driven decline shows no loss in equity. The shortfall appears only in the securities footnote. Suppose the footnote discloses 2.50 per share of unrealized loss on the held-to-maturity book, which is 1.98 after tax at 21 percent. The balance sheet does not move, so the shortfall never appears in reported equity.
The figures used from here on carry one stated convention. The 5.28 of earnings per share below is the coming year's figure on the opening 44.00 of equity, so the 12.0 percent return on equity is forward rather than trailing. It is also stated on a market-yield basis, which means the held-to-maturity shortfall is not already sitting inside it. The deduction below is therefore the only place that shortfall enters. Work the other way if you prefer, and keep reported earnings with the yield drag still inside them. Then skip the deduction, because taking both charges the shortfall twice.
Check the funding side before treating the mark as a clean loss. Deposits that do not reprice with the market are worth more when rates rise, and that is the offset an asset-side mark ignores. Two lenders with identical securities losses are not equally damaged. One may fund itself with sticky non-maturity deposits while the other does not, and that difference belongs in the forward return you assume, and only secondarily in the discount rate.
Two routes to a bank valuation: excess return to equity and price to book
Bank valuation runs on two expressions of one idea. A valuation that misses this reports the pair as two independent methods agreeing.
The excess-return route treats book equity as capital already in place and asks what the bank adds to it. Value equals book equity plus the present value of returns above the cost of equity. Under constant growth that is B plus B times return on equity less the cost of equity, divided by the cost of equity less growth.
Value = B + B × (ROE − r) ÷ (r − g)
where B is reported book equity per share, ROE is the sustainable forward return measured on that same B, r is the cost of equity, g is growth in book equity, and the form holds only while g < r.
For the lender the capital charge is 4.40 against earnings of 5.28. The 0.88 that remains, divided by 0.06, is 14.67. Add that to the 44.00 of book equity and the value is 58.67 per share.
The price to book route states the same answer as a multiple. Justified price to book equals return on equity minus growth, over the cost of equity minus growth: 0.08 over 0.06, or 1.3333. Carry the unrounded figure and 1.3333 times the 44.00 base returns 58.67 again. The rounded 1.33 gives 58.52, a reminder that a two-decimal multiple is a display and not an input.
Justified P/B = (ROE − g) ÷ (r − g) = 1 + (ROE − r) ÷ (r − g)
where ROE is the sustainable, through-the-cycle forward return measured on the same book base the multiple is applied to, reported equity here rather than tangible, r is the cost of equity, and g is growth in book equity with g < r; at ROE = r the multiple is 1.0 at any growth rate below it.
The two agree because they are algebraically identical, not because two methods corroborated each other. That distinction matters when a valuation reports both and treats the match as evidence. Where genuinely different methods disagree, the disagreement is information, not an error to be averaged away. Where the same model appears twice in different notation, the agreement carries no information at all.
The break-even is the useful thing the multiple form makes visible. When return on equity equals the cost of equity, justified price to book is exactly 1.0 at any growth rate below it. A lender earning 8 percent against a 10 percent cost of equity is worth less than book at growth rates under 8 percent. Between 8 and 10 percent the constant-growth form returns a negative number, and at 10 percent it is undefined. Either result is a signal to switch to a staged build rather than a number to report.
The same algebra drives the earnings multiple in sector valuation. The equity-side pairing is deliberate. Return on equity belongs with the cost of equity, in the way return on invested capital belongs with a weighted average cost of capital.
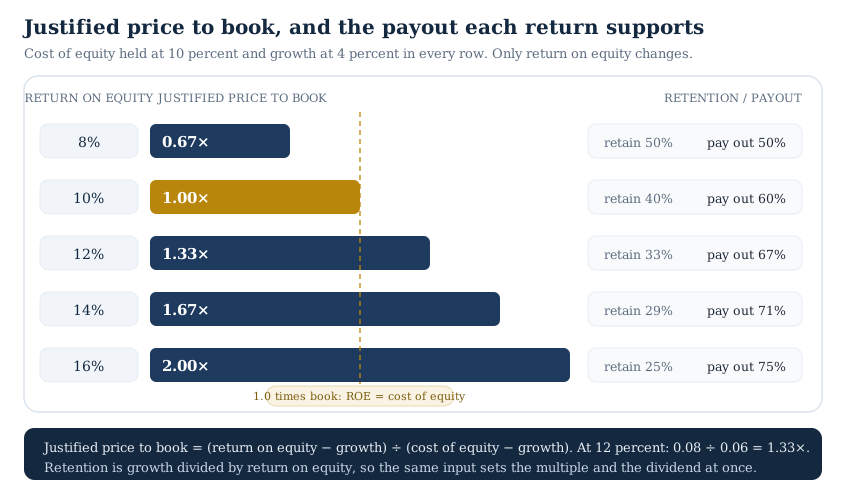
The payout column in the figure is the constraint the section after next turns into a check.
The cost of equity carries the same construction problem here that it carries anywhere. Regulation sets a floor under a lender's capital, and management still chooses how much cushion to hold above it. A levered figure therefore moves with rules and with strategy. The discount rate and WACC walkthrough sets out how to build the number and defend it. Aswath Damodaran's paper on valuing financial service firms covers the same terrain in more depth, including the equity-side reformulations used here.
Tangible book value traps: pair every adjustment with its earnings adjustment
Adjusting the capital base without adjusting the earnings that base produces manufactures value out of nothing. The failure is narrow: only two numbers have to move together, and they almost never do.
Keep the 44.00 lender and the 58.67 the build above produced. Now strip the 6.00 of goodwill and intangibles out of the base and leave earnings alone. The same 5.28 against a 38.00 base returns 62.67, which is 6.8 percent higher. The bank did not change. The model simply read the same profit as coming off less capital.
Levy the capital charge on the reported 44.00, which is the capital the business actually runs on, contributed and retained. Return on tangible common equity is the right pairing for comparing multiples across banks, and it is not a discounting base. Goodwill is not amortized, so removing it carries no offsetting earnings adjustment. Other acquired intangibles are amortized, and return on tangible common equity as banks report it adds that amortization back after tax. The 13.9 percent implied by 5.28 over 38.00 omits that add-back, so it is not the reported figure either.
Now take the held-to-maturity shortfall. Subtract the 1.98 after-tax figure from the 58.67 and the answer is 56.69. Against that, the half-adjusted 62.67 is 10.5 percent too high, and it got there by combining a conservative-looking move with the earnings adjustment it omitted.
Deducting from the value, not from the base, is itself a convention, and it needs stating. Take the 1.98 off the base instead and the capital charge falls to 4.20. The residual rises to 1.08, and the value comes out at 59.98. The 3.29 gap against 56.69 has the same cause as the goodwill gap above. Holding earnings at 5.28 on the reduced base lifts the implied return to 12.6 percent, which breaks the pairing rule a second time. Deducting from the value keeps the capital charge on the whole 44.00 the business runs on. Tax-effecting the mark at 21 percent presumes realization, and a security actually held to maturity produces neither the loss nor the benefit.
Name the convention in writing before you report a number. The excess-return form used here assumes constant growth and clean surplus, meaning all changes in book equity flow through earnings and dividends. Available-for-sale marks are the most common breach at a lender, because they move book equity through other comprehensive income instead. Share issuance to rebuild capital is the second. A stressed provision is the third, and a single-stage build on a balance sheet levered ten to one assumes the provision never spikes.
How regulatory capital limits a bank's growth and payout
For most companies the sustainable growth identity describes an opportunity. Growth equals retention times return on equity, because reinvested profit funds expansion. For a lender the same identity runs into a constraint set outside the business.
Growing a loan book grows risk-weighted assets, though not one for one, because risk weights differ by asset class. Capital ratios are measured against those risk-weighted assets. Under 12 CFR 217.10, a Board-regulated institution must maintain a common equity tier 1 capital ratio of 4.5 percent. It must also hold a tier 1 ratio of 6 percent, a total capital ratio of 8 percent, and a leverage ratio of 4 percent. Advanced approaches and Category III institutions add a 3 percent supplementary leverage ratio. A qualifying community banking organization that elects the community bank leverage ratio framework is treated as having met all of them.
Above the minimums sits the capital conservation buffer, composed solely of common equity tier 1. For large firms the buffer incorporates a firm-specific stress capital buffer requirement. A bank that lets the buffer fall short has distributions and discretionary bonus payments capped at a graduated share of eligible retained income, under 12 CFR 217.11. Growth and payout compete for the same retained earnings.
The requirement sets a floor, and it sets no schedule. A bank already at its buffer requirement can fund growth only out of retention. One holding surplus capital can grow risk-weighted assets faster for years by running that surplus down, or by shifting mix toward lower risk weights.
So say precisely what the identity does. Retention times return on equity caps the growth rate of book equity, exactly, under clean surplus with no issuance. It caps asset growth only if the capital ratio and the asset mix hold still. And common equity tier 1 is not book equity. Goodwill and intangibles are deducted, carryforward deferred tax assets come out in full, and temporary-difference ones face threshold tests.
Used that way it is still the most useful check available on a growth assumption. At a 12 percent return on equity, funding 4 percent growth requires retaining a third of earnings and permits a 66.7 percent payout. The same FDIC release put industry loan growth at 6.8 percent from the year-earlier quarter and 1.8 percent from the prior quarter. A single year of loan growth is not a perpetual rate, and the model's growth rate applies to book equity, not loans. Still, run 6.8 percent through the identity and retention has to reach 56.7 percent, leaving 43.3 percent to distribute.
Implied payout = 1 − g ÷ ROE
where g is the model’s growth in book equity under clean surplus with no share issuance, ROE is the sustainable forward return, and the result is compared with the payout the bank actually makes.
Run the check in that direction. Take the growth rate from the model, divide by return on equity to get the retention it requires, and compare the implied payout with what the bank pays. Neither figure is unusual on its own, and a model cannot hold both at once. A gap is a question about the capital plan, and it has more than one answer.
Where bank valuation fits in a research workflow
Read the two footnotes before you open a model. The allowance footnote tells you whether the provision is tracking losses or funding a bigger book. The securities footnote tells you what the balance sheet is not showing. Those two readings move the answer further than any refinement of the discount rate.
The multiple also runs backwards, which is the fastest use of it. Rearrange the justified expression and the market price hands you the return it is assuming, given your own cost of equity and growth. A lender trading at 1.33 times book, against a 10 percent cost of equity and 4 percent growth, is priced for a 12 percent forward return on equity. Ask whether the bank has earned that through a full credit cycle. The same inversion on a cash flow model is the subject of reverse DCF and implied expectations.
Implied ROE = g + P/B × (r − g)
where P/B is the multiple the market currently pays on the same book base, and the result is the forward return the price assumes given your r and g; move one input at a time.
The stock valuation methods guide sets out the four core approaches and matches each to a business profile. Choosing a valuation method routes financial firms to a book-value view in one line, and this article is that line worked out.
The InvestViable Valuator runs a discounted cash flow from three explicit inputs the analyst sets: the cash flow growth path, the discount rate, and the terminal growth rate. It values an entity from a projected cash flow stream. That is the frame a lender sits outside, so the equity-side build replaces it rather than feeding it. Use the Valuator on the non-financial names in the same portfolio, and keep the bank work in a sheet where the base and the return stay visibly paired.
The InvestViable stock screener filters 3,000+ US stocks on fundamentals and the Investment Score. Slices of the Stock Universe narrow the field to where this method applies, whether by sector across financials or more tightly through bank stocks.
Write down the base you used, the return measured on that base, and the payout ratio your growth rate implies, on the same line. You usually pull two of those from a data provider and build the third yourself. Check that the provider measured the return on the base you actually used.
InvestViable does not publish buy or sell recommendations on individual securities. All analysis is based on public financial data and a transparent methodology. The Investment Score formula is proprietary; the inputs and what the score evaluates are documented. The per-share figures in this article are illustrative inputs chosen so every step can be recomputed, and they are not estimates of what any security is worth.