
The price to book ratio is only interpretable against two other figures: the return a company earns on its book equity, and the return shareholders require. A business earning more than shareholders require should trade above book value, and by more the wider that spread runs. One earning less should trade below it. The justified form of the ratio makes this exact: return on equity minus growth, divided by the cost of equity minus that same growth. So the ratio is not a cheapness gauge. It is a statement about a spread, and about whether the denominator underneath it still describes the capital the business uses.
What the price to book ratio measures
Book equity is an accounting record of contributed and retained capital. Shareholders paid in a sum, the company retained some profits, and dividends, buybacks and write-offs took some back out. Accumulated other comprehensive income sits alongside those, holding currency translation, pension remeasurement and marks that never passed through earnings. Strip out preferred equity and non-controlling interests, and what remains is the carrying value of the common owners' claim.
The price to book ratio sets market value against that record. A ratio of 1.0 says the market values the equity at exactly its carrying value. A ratio away from 1.0 says one of three things, and separating them is the whole exercise. Either the market expects the capital to earn more or less than it costs. Or book equity is not measuring the capital the business runs on. Or the price is wrong, which is the reading available only once the first two are ruled out.
Price to book ratio
Market value per share divided by book value per share. Book value per share is total shareholders' equity, less preferred equity and non-controlling interests, over common shares outstanding.
That framing already rules out the common use. The ratio is not a measure of cheapness, because nothing in it refers to earning power directly. It refers to earning power only through the market's price, which is the figure you are trying to assess. On its own it tells you what other people will pay for a dollar of accounting capital.
Two inputs make it interpretable. The first is the return the company earns on that capital, treated in full in ROIC vs ROE vs ROA. The second is the return shareholders require. Assembling it from a risk-free rate and a premium is covered in the discount rate and WACC guide. The equity leg is taken apart in the cost of equity guide. With those two figures the ratio becomes an equation. Return on equity and the cost of equity are both equity-side measures, which is why they belong with a price multiple rather than with an enterprise-value one.
What book value per share contains
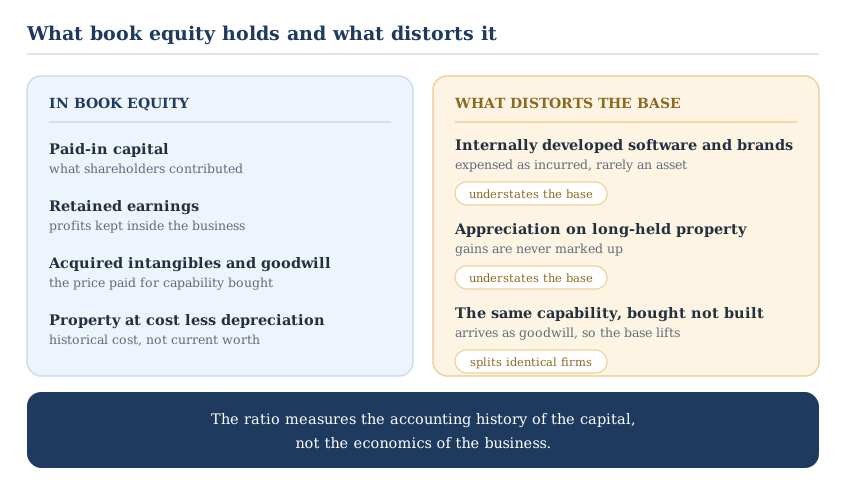
Before using the denominator, know what accounting puts in it. Three rules do most of the work, and each leaves a specific gap.
The first rule is that most internally developed intangibles are not assets at all. US accounting has required research and development costs to be charged to expense as incurred since FASB Statement No. 2, issued in 1974; the requirement now sits in ASC 730 of the Codification. Two neighboring rules do the same work for spending that is not research. Advertising, where most brand building lands, is expensed under ASC 720-35. ASC 350-20-25 bars recognizing an internally developed intangible that is not specifically identifiable, which is what catches a distribution process. So a company that spends a decade building a brand or a route to market has expensed nearly all of it under one of the three.
Software is the main exception, and it runs on two rules with different thresholds. Software built to be sold is capitalized after technological feasibility under ASC 985-20, and internal-use software during the application development stage under ASC 350-40. Smaller carve-outs exist for website development and for film and episodic content. What reaches the asset column is thin against what the engineering cost, and whatever the rules leave out still exists and still earns money.
The second rule reverses the first for anything bought instead of built. Acquired capability arrives on the balance sheet as identifiable intangibles and goodwill, at the price paid for it. Two companies with identical operations can therefore carry very different book equity, decided by whether they built or bought. The ratio reads the accounting history, not the economics.
The third rule is historical cost. Property and equipment are carried at what was paid for them, less accumulated depreciation, and land is carried at cost without depreciation at all. A site held for forty years therefore sits on the books near its 1980s price. This pushes the same way as the first rule and leaves book equity understated. The error is not one-way, though. The impairment test for long-lived assets bites only once undiscounted future cash flows fall below carrying amount. Carrying value can therefore sit above economic value for years with no write-down.
Two pages of any 10-K on SEC EDGAR settle which rule is doing the most damage here: the statement of shareholders' equity, and the intangibles footnote. The stock market value formulas reference covers where each figure sits in the statements.
The justified price-to-book identity
Deriving the ratio is what turns it into a diagnostic. Start from the constant-growth valuation of an equity stream, the structure behind the dividend discount model. Price equals next year's dividend over the cost of equity less growth.
Write next year's earnings as return on equity times current book equity. Write the dividend as the payout share, and growth as the retained share times return on equity. Substituting and cancelling leaves a compact identity.
Justified P/B = (ROE − g) ÷ (r − g) = 1 + (ROE − r) ÷ (r − g)
where ROE is next year's return measured on current book equity, sustainable rather than a peak year. r is the cost of equity. g is growth in book equity funded from retention, with g below both ROE and r. And book equity moves only by earnings less dividends. At ROE = r the multiple is 1.0 at any growth rate below it.
The convention in that legend is where this goes wrong in practice. Most published returns are trailing instead: last year's earnings over reported equity. Where that equity is the ending balance, the denominator is already the one the identity wants. Only the earnings are stale, so multiply the trailing return by one plus growth. Where the source divides by average equity, the figure is part way forward and needs less. Check the definition before you convert. Two of those conditions bite hardest, on top of the steady return and payout the form assumes in perpetuity. Growth funded from retention cannot exceed the return that funds it. And book equity moving only by earnings less dividends is what buybacks and write-downs break, which a later section takes up. Outside those bounds the identity still returns a figure, which is worse than returning none.
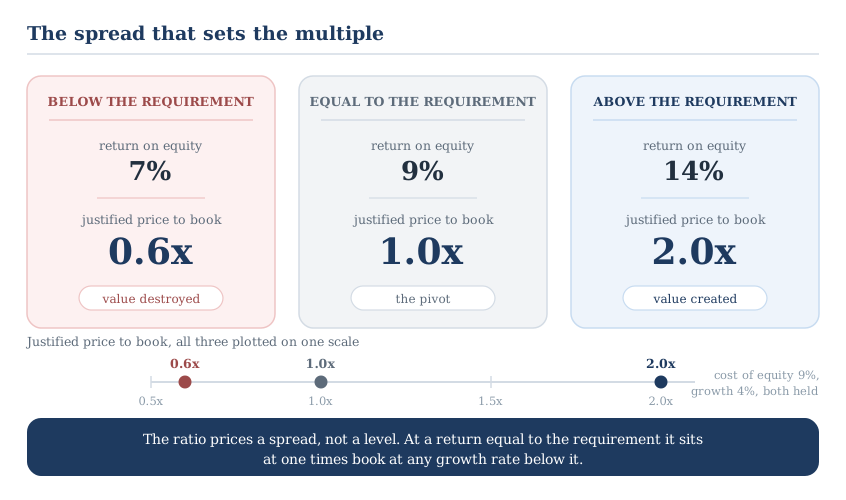
Three cases make the shape clear. Take a company with book value per share of 40.00 and a 9 percent cost of equity, growing at 4 percent.
Earning 14 percent on equity, next year's earnings are 5.60 per share. Growth of 4 percent needs 28.57 percent of that retained, leaving a payout of 71.43 percent, or 4.00 per share. Capitalizing 4.00 at the 5 point spread between the cost of equity and growth gives 80.00 per share, which is 2.0 times the 40.00 of book.
Earning 7 percent instead, next year's earnings are 2.80. Funding the same growth now needs 57.14 percent retained, leaving 1.20 per share. That capitalizes to 24.00, or 0.6 times book, and the identity agrees: 3 over 5.
Earning exactly the 9 percent shareholders require, the numerator and denominator match and the ratio is 1.0 at any growth rate below the cost of equity. That is the pivot the whole ratio turns on, and it is why growth is not the story here. Growth only lifts the multiple while the return on equity exceeds the cost of equity, a condition the justified P/E article develops on the earnings side.
Reading a sector aggregate against the identity
The identity is worth running against real figures, with one caution first. What follows tests the algebra, not any bank, and an industry aggregate is not a company.
Aswath Damodaran's price and value to book ratios by sector is dated January 2026. It puts the 568 regional banks in his US sample at 1.14 times book, with a return on equity of 9.75 percent. Both figures are pooled rather than averaged: aggregate market value over aggregate book equity, and aggregate net income over that same base. So the largest banks set them and the median bank appears in neither. That shared denominator is also what keeps the pair consistent enough to run the identity on. His industry definitions are his own, so a group is a rough grouping and not a peer set.
Build the required return from the same vintage of data. Damodaran's implied equity risk premium series updates in the first weeks of January, and the row labeled 2025 reads 4.23 percent against a Treasury bond rate of 4.18 percent. The column is headed implied ERP on a free cash flow to equity basis. At a beta of one that is a cost of equity of 8.41 percent. The ten-year constant maturity series DGS10 on FRED has since moved, printing 4.79 percent on 2026-09-02. That figure cannot simply be dropped into the build. The implied premium was solved against the 4.18 percent bond rate in the same estimate. Swapping one without re-solving the other counts the rate move twice. Substituted anyway it returns 1.17 times book against a market 1.14, which shows how much of this section's residual is a matter of vintage rather than level.
The beta of one is imposed here, and the same author publishes a measured alternative. His economic value added by sector dataset gives the identical 568-firm group a beta of 0.40 and a cost of equity of 5.73 percent. Rebuilt from the same 4.18 percent bond rate and 4.23 percent premium, that beta returns 5.87 percent. The published beta is rounded, and the input behind his figure is nearer 0.37. Run the identity at 5.73 percent and it returns 2.58 times book. So the choice of required return moves the answer by 1.28, against a gap to the market of 0.16. Growth carries the same kind of weight, because the multiple runs on the required return less growth, and that spread is only 5.41 points here. Hold the required return and move growth from 3 to 6 percent, and the figure goes from 1.30 to 1.80. That ordering is the honest headline of this section: the assumptions dominate the residual.
Now apply the convention. His return on equity is a trailing figure on reported book equity, so at 3 percent growth the identity wants 10.04 percent. That gives 10.04 minus 3, over 8.41 minus 3, or 1.30 times book. The market is paying 1.14.
What the gap actually resolves to
That gap is the useful output, and it resolves three ways. Hold the return and the growth rate, and the observed 1.14 implies a cost of equity of 9.18 percent. Holding the 4.18 percent bond rate and the 4.23 percent premium, that implies a beta of about 1.18. Hold the cost of equity instead, and 1.14 implies a forward return on equity of 9.17 percent. Restated on the trailing basis the source reports, that is 8.90 percent against the 9.75 percent it recorded. The third reading is that the inputs are wrong, and the sensitivities above say that is what to test first. The return on equity is a trailing aggregate across 568 filers who do not share a cost of equity. The 3 percent growth rate was assumed, and it is not free. The identity ties growth to retention, so 3 percent on a 10.04 percent return needs 29.9 percent retained. That is a payout near 70 percent. Test that against what the group actually distributes before treating the 1.30 as a reference point. Only once they survive does the residual read as a difference in risk or in expected profitability. Even then it is a property of the aggregate rather than of any bank. A disagreement between the identity and the price is information, not an error to be averaged away.
When book equity stops being a capital base
The denominator breaks in four recognizable ways, and in each one the ratio keeps producing a number.
Sustained buybacks are the most common. A repurchase takes cash out of book equity and shares out of the count at the same time, so the direction depends on the price paid against book. Above one times book it lowers book value per share and the ratio rises, with no change in the business underneath it. Below one times book it lifts book value per share and the ratio falls. A bank buying back at 0.8 times book therefore screens cheaper afterwards, for purely mechanical reasons. Carried far enough, and especially when funded with debt, book equity approaches zero and the ratio approaches infinity before turning negative. What that pattern does to the return on equity in the identity's numerator is covered in ROIC vs ROE vs ROA. What it does to the ratio's own denominator is simpler. There is no capital base left to price.
Write-downs act in one step. An impairment cuts book equity on the day it is booked, so the ratio jumps at an unchanged share price. The charge is measured as the shortfall of carrying amount against fair value, and fair value is an estimate of future cash flow. So the write-down is a late and lumpy recognition of news the price absorbed earlier, and the ratio moves because the accounting has caught up.
Asset-light businesses never had the denominator in the first place. In the same January 2026 dataset, the 29 companies Damodaran groups as internet software carry 10.86 times book with an aggregate return on equity of negative 1.47 percent. Twenty-nine firms is a thin aggregate. His economic value added file puts their combined book equity near 23 billion dollars, small enough that one large loss sets that sign. The identity cannot be run on that pair at all. A negative return on equity cannot fund positive growth, so the retention step behind the identity has already broken. The numerator turns negative before any cost of equity is chosen. The output would not be a valuation. It would be the arithmetic reporting that the inputs do not describe a going concern with a stable capital base. His separate system and application software group reads 9.14 times book on a 29.62 percent return. The two groups are not a range and should not be merged.
Negative book equity ends the exercise. The ratio changes sign while the business has not changed at all, and no threshold applied to it survives that.
Where price-to-book still does real work
The ratio stays useful wherever book equity is close to the capital the business deploys. Three settings qualify.
Financial companies are the clearest case, because a bank funds itself with the same liabilities an industrial would call debt. Netting those out to reach an enterprise value deletes the business instead of isolating it, which leaves the equity-side pair standing where the enterprise-side one collapses. One check comes first for a bank. Debt securities held to maturity stay at amortized cost, and their unrealized losses never touch book equity. The denominator can be overstated before any of this is run. Why that holds sector by sector is set out in sector valuation fundamentals, and the population itself sits in the bank stocks slice of our Stock Universe.
Asset-heavy industrials come next. Plant, vessels and track sit on the balance sheet at cost less depreciation, and inventory at the lower of cost and net realizable value. The denominator is at least measuring the right things, even where depreciation has left it low. Where a company has been on last-in first-out for decades, the footnoted reserve says how far below replacement cost the inventory line sits.
Last comes the near-liquidation case, where book equity is being tested instead of capitalized. That is a different exercise, and asset-based approaches and the haircuts they need are treated in how to value unprofitable companies. Graham's ceiling on price against earnings and book value belongs in the same family, and the Graham formula article covers the 1.5 times book criterion and where it fails.
In all three the ratio does triage work. It narrows a universe to companies worth modeling properly, and it flags the ones whose price implies a return the filings do not support.
Where this fits in your workflow
Run the ratio in one direction only: from the observed level to an implied return, then to the filings.
Implied ROE = g + P/B × (r − g)
Implied r = g + (ROE − g) ÷ P/B
where P/B is the multiple the market currently pays on the same book base. The result is the return the price assumes given the inputs you held. Move one input at a time.
For the estimate the ratio is checking, tooling helps. The InvestViable Valuator keeps the discounted cash flow's inputs on the surface and under your control: the cash flow growth path, the discount rate, and the terminal growth rate. The InvestViable stock screener narrows the US universe on fundamentals and carries the Investment Score. Where the balance sheet is the point, a value stocks slice of our Stock Universe is a reasonable place to start. The full method-selection question, including when a balance-sheet multiple is the wrong tool entirely, sits in the stock valuation methods and DCF guide.
InvestViable does not publish buy or sell recommendations on individual securities. All analysis is based on public financial data and a transparent methodology. The Investment Score formula is proprietary; the inputs and what the score evaluates are documented. The per-share figures in this article are illustrative and demonstrate the arithmetic. The sector aggregates are dated third-party figures used to test that arithmetic. Neither is a view on any company or industry.