
A justified P/E ratio converts a company's fundamentals into the multiple those fundamentals support. In the constant-growth form it equals the payout ratio times one plus the growth rate, divided by the cost of equity minus the growth rate. Payout is one minus retention, and retention is the growth rate divided by return on equity, so the three inputs move together. Build the multiple from your own estimates, then set it beside the multiple the market is paying. The single-stage version only holds while retention times return on equity stays below the cost of equity.
What a justified P/E ratio is
A justified P/E ratio is a model output. You estimate three things about a business, and the multiple those estimates support falls out of the arithmetic. The traded P/E is a different object entirely. It divides a price by an earnings figure and records what someone paid.
The derivation is short. Divide a constant-growth dividend model through by current earnings and the dividend per share becomes a payout ratio. What is left is a pure multiple: payout times one plus growth, over the cost of equity minus growth. The forward version sits on next year's earnings and drops the one-plus-growth term. The two bases therefore differ by exactly that factor. A benchmark quoted on one has to be multiplied by one plus growth before it sits beside an estimate built on the other. At 7 percent growth, skipping the step is a 7 percent error.
The inputs also have to come from one side of the balance sheet. Payout, return on equity and the cost of equity all measure what accrues to shareholders, and shareholders are what a price-to-earnings multiple prices. Drop a return on invested capital into the same expression alongside a cost of equity and the output prices nothing at all.
The group-level version of this algebra, meaning why one industry supports a different multiple from another, belongs to sector valuation. What follows stays on the company-level build: which figures go in, what the identity forbids, and where the single-stage form quits. It is a discounted cash flow compressed into one growth rate, and whether a multiple suits the business at all is settled earlier, in choosing a valuation method.
The justified P/E formula and the constraint that binds it
The justified P/E formula has three inputs, and two of them are tied together. Growth is not free. A company funds it by retaining profit, and the return earned on that retained profit decides how much growth each retained dollar buys. Written out, the sustainable growth rate equals the retention rate times return on equity. Invert that and the payout ratio stops being a free choice: the growth rate you assume fixes the retention it requires, and payout is the remainder.
Paste a growth rate in from a broker model and you have implicitly set the payout ratio you are allowed to use. Keep the company's reported payout alongside it and the two assumptions contradict each other. The contradiction usually runs in the direction that flatters the multiple.
Work the constraint on a fixed pair of inputs. Hold the cost of equity at 10 percent throughout, as an illustrative figure rather than a reading of any company. Take a business earning 14 percent on equity. Retain 30 percent of profit and the sustainable growth rate is 4.2 percent, payout is 70 percent, and the justified multiple is 12.58. Retain 50 percent and growth reaches 7.0 percent against a 50 percent payout, giving 17.83. Retain 60 percent and growth is 8.4 percent against a 40 percent payout, giving 27.10.
Now run the identical ladder on a business earning 8 percent. Retaining 30 percent produces 2.4 percent growth and a multiple of 9.43. Retaining 50 percent produces 4.0 percent growth and 8.67. Retaining 60 percent produces 4.8 percent growth and 8.06. The multiple falls as the growth rate rises.
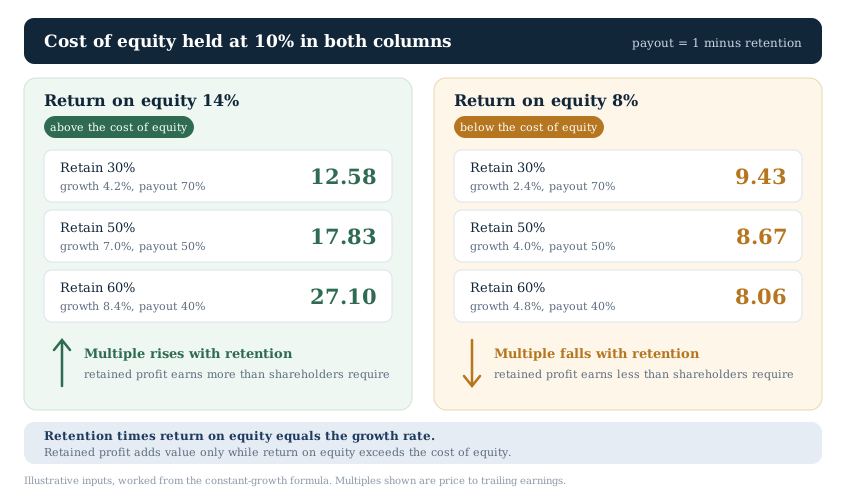
The reversal is not a quirk of the numbers. Retained profit earning 14 percent against a 10 percent cost of equity adds value, so more retention buys a higher multiple. Retained profit earning 8 percent against the same 10 percent destroys value, so shareholders capture more from receiving the cash than from having it reinvested. The formula prices that judgment automatically. Retention lowers the payout in the numerator and raises the growth rate in the denominator, and which effect wins is decided by whether retained profit clears the cost of equity.
Push the high-return case one rung further and the form stops being useful before it stops working. Retaining 70 percent at a 14 percent return implies 9.8 percent growth against a 10 percent cost of equity, still inside the condition, and the multiple reads 164.70. Nothing in the business justifies that jump. The denominator is two tenths of a point wide, so the output is a division artifact rather than a valuation.
Growth adds value only above the cost of equity
The economics are unambiguous: retained profit adds value only while return on equity exceeds the cost of equity. Below that line, growth is a use of cash that returns less than shareholders require. In the forward form, payout over the cost of equity minus growth, the multiple's direction reverses exactly at that point. The trailing form used here carries the extra one-plus-growth term, so its crossover sits slightly lower, and it is not one number. It runs from 9.54 percent at 30 percent retention to 9.85 percent at 60 percent. On the ladder above, the 30 and 60 percent rungs return the same multiple at a 9.73 percent return. Any argument that a company deserves a higher multiple because it is growing faster has to clear that test first.
The folk rule that a fair multiple equals the growth rate, sometimes written as a price-earnings-to-growth ratio of one, has no general derivation behind it. Test it against the formula on the trailing basis used throughout. At a 10 percent cost of equity, that rule holds at 4 percent growth only if payout is 23.1 percent, which implies a return on equity of 5.2 percent. At 6 percent growth it needs a 22.6 percent payout and a 7.8 percent return. At 8 percent growth it needs a 14.8 percent payout and a 9.4 percent return.
Every one of those implied returns sits below the 10 percent cost of equity. At this cost of equity, a price-earnings-to-growth ratio of one describes a company earning less than its cost of equity. That is not the company most investors have in mind when they reach for the rule. The result is not general, but the exception is narrow. The implied return catches the cost of equity only when growth, in percentage points, exceeds one hundred divided by the cost of equity less one. An 11 percent cost of equity therefore needs growth above 10 percent, which none of these three rungs reaches. Re-run them at 11 percent and the implied returns are still 5.5, 8.4 and 10.3 percent. Read the threshold the other way. It sits at a 13.5 percent cost of equity for 8 percent growth, 17.7 percent for 6 percent, and 26.0 percent for 4 percent. That a bare hundred appears in that threshold is the tell. The rule is not scale-invariant, and a verdict that moves with the discount rate is not a valuation standard.
Graham's formula runs into the neighboring version of the same problem from the other direction. It fixes the coefficients rather than the return, so its implied multiple rises in a straight line with growth and never asks what funds that growth. The justified form ties growth to the return that pays for it, which is the discipline the heuristic gives up in exchange for speed.
Which payout ratio belongs in the numerator
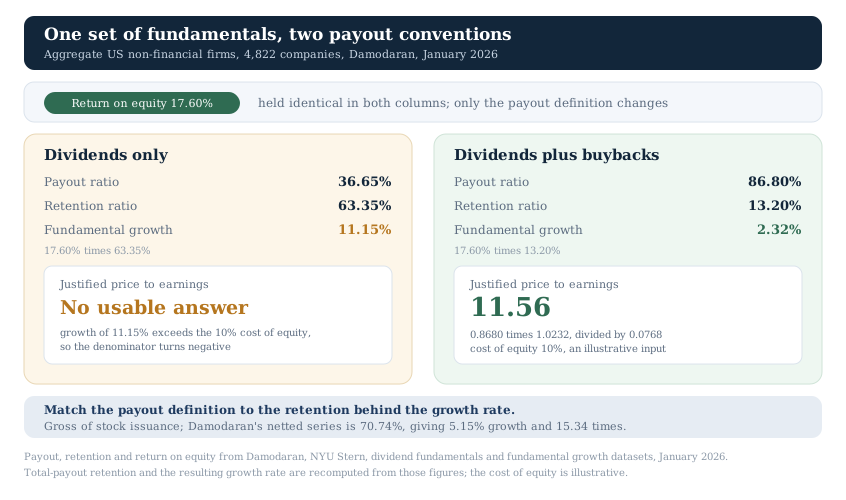
Dividends are no longer the main route cash takes back to US shareholders. In Damodaran's January 2026 dividend fundamentals dataset, aggregate dividends across 4,822 non-financial US firms come to 36.65 percent of net income. Add buybacks and total cash returned reaches 86.80 percent, roughly 2.4 times the dividend figure and 50.15 percentage points above it. The gap is not uniform. General utilities pay 65.40 percent as dividends and return 65.84 percent in total, while system and application software pays 20.98 percent and returns 60.38 percent.
That gap propagates into the growth rate, because retention is whatever payout leaves behind. The companion fundamental growth dataset puts the non-financial aggregate return on equity at 17.60 percent and the retention ratio at 63.35 percent, which multiply to 11.15 percent. That retention figure is one minus the dividend payout. Recompute retention as one minus total cash returned, or 13.20 percent, and the same return on equity yields 2.32 percent. For system and application software, whose return on equity the same table puts at 29.62 percent, the identical substitution moves fundamental growth from 23.41 percent to 11.74 percent.
Both cannot be right, and the choice is a convention you have to name. Book equity grows by profit minus dividends minus net repurchases, so the equity-funded growth in net income is the total-payout version. The dividend-only version treats repurchase cash as though it stayed in the business. The 86.80 percent figure is gross of stock issuance. Damodaran reports the netted series separately, at 70.74 percent of net income, which lifts retention to 29.26 percent and fundamental growth to 5.15 percent. The two bound the answer rather than settling it. The gross series assumes every buyback dollar leaves book equity for good, while the net series credits back the shares issued to pay employees. What that cash actually buys is a smaller share count. That lifts per-share earnings above net-income growth by a margin set by the price paid rather than by the return on equity. The aggregate flow sits in the corporate equities tables of the Federal Reserve's Financial Accounts of the United States. Reading repurchases as a price signal is a separate exercise.
What a mismatched payout definition costs
The rule is a matching rule: measure payout and retention on the same definition, then carry both through the formula. Total payout of 86.80 percent with 2.32 percent growth, discounted at a 10 percent cost of equity, returns a justified multiple of 11.56 on the rounded growth rate above. The netted series, 70.74 percent payout against 5.15 percent growth, returns 15.34. Nearly four turns of multiple sit in a column choice, which is this article's strongest argument for naming the convention out loud. Now feed the dividend payout of 36.65 percent in alongside its 11.15 percent growth. The denominator turns negative and the expression returns minus 35.4 times, a figure a spreadsheet carries forward without complaint. One caveat travels with it. The fix corrects the payout side but leaves the 17.60 percent return on equity untouched, and the next section explains why that return is flattered by the same repurchases.
Thirty-seven industry groups in the same dataset return more than their entire net income, with aerospace and defense at 128.45 percent. Retention is then negative and so is implied growth, and the expression does not fail. At the same 17.60 percent return and 10 percent cost of equity it returns 8.13, an unremarkable-looking multiple resting on a shrinking earnings base. Nothing in that output signals the problem, which makes it the harder case to catch.
Which earnings and which return on equity go in
The earnings figure and the return on equity are the two inputs most often copied from a data field without inspection. Either one can move the multiple by several turns.
Start with the earnings basis. Trailing twelve months and fiscal-year figures answer different questions and rarely match, and the difference between them shows up directly in the denominator. For cyclical businesses the problem runs deeper than the window. A commodity producer at a cycle peak reports earnings the formula's constant-growth assumption cannot accept, so normalizing earnings first is not optional. Companies with negative earnings fall outside the form altogether, and valuing an unprofitable company needs a different route.
Return on equity carries the subtler risk, because two things inflate it without any operating improvement. The first is leverage. Debt shrinks the equity base, which lifts the ratio mechanically. That is why the choice between return on invested capital, return on equity and return on assets belongs upstream of this calculation. A leverage-driven return also raises the cost of equity that sits in the denominator, so importing the high return without adjusting the rate double-counts in your favor.
The second is the same repurchase activity discussed above. Buybacks reduce book equity, so years of them leave a return on equity that looks like operating excellence and is partly arithmetic. Research-heavy companies show a related distortion, since expensed development spending never enters book equity, leaving the denominator understated and the return overstated. In both cases the inflated return raises the growth rate the identity permits, and that error lands in the denominator. The identity behind all of this also assumes the return is measured against beginning-of-period book equity. Average-equity and ending-equity versions, which is what most data fields carry, give a growth rate wrong by roughly half the equity growth rate.
When the single-stage form stops working
The constant-growth version is a mature-company tool. The software group above makes the point. On the dividend convention its 23.41 percent growth exceeds any cost of equity anyone would defend. On the total-payout convention, 11.74 percent, the expression survives only above about 12 percent, and it returns 255 times there and 53 times at 13 percent. An answer that swings 200 turns on one point of discount rate is the same signal to stage the model.
Take a company earning 20 percent on equity and retaining 60 percent of profit. Its sustainable growth rate is 12 percent, above a 10 percent cost of equity, so the single-stage expression fails. Hold the 12 percent growth and the 40 percent payout for five years instead. Then fade the return on equity to 12 percent and growth to 4 percent, which the retention identity converts into a 66.7 percent payout.
Discount five years of payouts at 10 percent and they are worth 2.11 times current earnings. Year-five earnings stand at 1.76 times today's figure. The terminal block, valued on the faded payout and growth, is worth 11.56 times year-five earnings. That is 20.36 times current earnings, or 12.64 times once discounted back at 10 percent. Adding the two blocks on unrounded inputs gives a justified multiple of 14.76.
Name the convention, because the answer depends on it more than on any single input. This is a five-year first stage, an abrupt fade with no transition period, and a perpetuity terminal value. A linear fade across the same horizon, or a longer first stage, gives a different number. So does the terminal return on equity, which sets the terminal payout. It also applies the faded 12 percent return only to new investment and leaves the legacy book earning 20 percent. Fading the whole book instead gives a terminal block of 13.16 times current earnings, 8.17 discounted, and a total multiple of 10.28. That single convention moves the answer more than the fade path does. And 85.7 percent of the multiple sits in the terminal block, which puts the weight of the answer on the assumption you can defend least. Testing which inputs the answer actually depends on is what sensitivity analysis is for, and the terminal structure itself gets its own checks in the DCF inputs checklist.
Staging also changes what the multiple means. A single-stage justified P/E is a statement about a steady state. A staged one is a compressed discounted cash flow wearing a multiple's clothing, and it inherits every terminal-value problem that comes with the longer model. Build the discount rate for either version with the same care, following the discount rate and WACC walkthrough.
Where a justified P/E belongs in the workflow
Build it before you look at the traded multiple. Run the steps in the other order and each input gets nudged until the output matches the price. That turns the exercise into an expensive way of restating what the market already told you.
Two comparisons then earn their keep. The first is against the market. A traded multiple of 22 against a justified 15 settles nothing by itself, but it does narrow the disagreement. Not to payout and growth, though, because those are outputs. The independent levers are return on equity, the retention rate, and the cost of equity. Solve backwards on each in turn, moving retention with its payout attached. Discard the answers that land outside anything you would defend, and what remains is the assumption actually in dispute. A reverse discounted cash flow runs the same logic on the cash-flow model rather than the multiple.
The second comparison is against your own cash-flow model. Take your discounted cash flow value, subtract net debt if the model was built on unlevered cash flows, and divide the resulting equity value by normalized earnings. That is an implied P/E, and it is comparable to the justified one. An enterprise value divided by net income is not, and the gap it opens is capital structure rather than disagreement. If that figure reads 26 times while your justified multiple reads 15, two of your own models disagree about one company. Reconciling them is more informative than averaging them. That translation step is the core of multi-method valuation, and the reasons methods diverge in the first place are set out in why valuation methods disagree.
The InvestViable Valuator runs a discounted cash flow from inputs you set: the cash flow growth path, the discount rate, and the terminal growth rate. A justified multiple built the way this article describes works as a cross-check on what that tool returns. The InvestViable stock screener filters a universe of 3,000+ US stocks on fundamentals. Slices of the Stock Universe such as quality stocks and dividend stocks group companies whose payout and return profiles differ in exactly the way this formula cares about. The payout, earnings and equity figures all trace back to the filings, searchable through SEC EDGAR.
A final check costs nothing. Before the traded multiple enters the room, write the retention rate your growth assumption implies next to the payout ratio you actually used. When those two numbers fail to add to one, the multiple you just built belongs to a company that does not exist.
InvestViable does not publish buy or sell recommendations on individual securities. All analysis is based on public financial data and a transparent methodology. The Investment Score formula is proprietary; the inputs and what the score evaluates are documented.