
Introduction
The S&P 500 reached an all-time high of 6,978.60 in the end of January, before it pulled back amid geopolitical crises, labor market deterioration, and artificial intelligence sector rotations. This convergence creates a complex environment to assess whether equity prices have detached from economic reality.
U.S. stock market valuation currently reflects elevated optimism, but the degree of vulnerability depends on which measurement frameworks analysts apply and whether corporate earnings can sustain their projected growth rates. For example, the Shiller P/E ratio is currently 41, and this marks the second-highest level ever recorded in U.S. stock market history.
The following sections do not deliver a simple prediction on an impending crash. Instead, they outline specific analytical frameworks and historical correction patterns that help evaluate probability-weighted outcomes. The data helps build a concrete decision framework and removes reliance on conflicting expert opinions.
Disclaimer: This article is educational only and does not serve as investment advice. We do not intend to provide a market forecast.
Where U.S. stock market valuation stands right now
Objective metrics like trailing Price-to-Earnings, forward P/E, the Cyclically Adjusted Price-to-Earnings ratio, and price-to-sales ratios reveal how much market participants pay for corporate earnings in early 2026. According to DataTrek Research, the S&P 500 trades at a 14.4% premium to its 10-year average forward P/E multiple as of early February 2026. This aggregate number suggests an expensive market, but a closer look reveals a heavy concentration problem.
The top 10 U.S. stocks now account for roughly 35% of the market, and this share grew from just 18% a decade ago. When we remove these technology companies from the index, the remaining 490 stocks trade at much lower multiples. Because mega-cap companies distort the broader index, financial analysts need a reliable valuation analysis template to separate market-cap-weighted illusions from the actual median stock price. A good fundamental analysis framework helps uncover these hidden divergences.
Comparisons to historical pricing levels provide empirical context. During the dot-com era, market participants paid premium prices for internet companies that lacked earnings. In 2017, broad tax cuts justified higher multiples across all sectors.
Three forces that compress multiples
A handful of companies generate massive cash flows to support current market prices, but three distinct macroeconomic headwinds create downward pressure on equity multiples. Energy spikes, employment weakness, and software sector disruption act as a causal chain that transmits systemic vulnerability into broader market pricing. If we want to understand how U.S. stock market valuation might contract, we should examine how these independent variables interact.
Energy shocks act as the first domino. High oil prices increase production costs and reduce discretionary consumer spending. When consumers spend less, corporate profit margins shrink. This margin compression eventually forces companies to reduce their workforce. Labor market weakness then slows overall economic output, and this leads to lower earnings expectations across major indexes.
At the same time, specific sectors face their own internal crises. Artificial intelligence disrupts legacy software companies and forces a rigorous repricing of their future cash flows. When technology companies lose their premium multiples alongside a slowing broader economy, the entire stock market faces downward pressure.
Energy shocks drive inflation transmission
Energy shocks initiate this compounding effect, and the conflict in the Strait of Hormuz severely impacted global oil supplies in early 2026. Because a significant portion of the world's crude oil passes through this specific chokepoint, geopolitical tensions quickly translate into higher energy costs. After this geopolitical conflict began, crude oil spiked to nearly $120 per barrel and created stagflationary pressure on the U.S. economy.
Sustained crude prices above the $100 threshold squeeze corporate profit margins. Transportation networks, manufacturers, and retailers face immediate cost increases that they cannot always pass on to their customers. Higher gas prices also drain consumer wallets and leave less money for discretionary purchases. This precise transmission mechanism turns a regional geopolitical conflict into a domestic inflation problem that forces companies to lower their earnings guidance.
Labor market weakness impacts US equity valuation
The February jobs report delivered an unexpected contraction that shifted economic forecasts. According to the U.S. Bureau of Labor Statistics, total nonfarm payroll declined by 92,000 in February 2026, while the unemployment rate held steady at 4.4%. This negative job growth signals a softening labor market that directly affects corporate earnings expectations.
Historically, a rising unemployment trend serves as a measured indicator of broader economic slowdowns. When fewer people hold full-time jobs, aggregate wage growth stalls, and national economic output drops. Companies respond to this weakness when they cut their hiring budgets and reduce operational investments. This cyclical contraction ultimately forces financial analysts to lower their estimates for future corporate profits, and lower profits make current stock prices look even more expensive.
AI sector disruption forces software price adjustments
Specific sector disruptions compound this cyclical contraction, and legacy software companies face an existential threat from new AI tools. In early 2026, software stocks sold off dramatically as market participants realized that AI competitors could perform similar tasks for a fraction of the cost. This rapid price adjustment forces a fundamental question about the safety of traditional technology investments at current multiples.
Whether this selloff represents an isolated sector rotation or the beginning of a broader multiple compression across all technology stocks remains genuinely uncertain. The answer depends on how quickly legacy software companies can adapt their business models before losing their customer base to cheaper AI alternatives. And how patient capital markets remain while that transition unfolds.
Are 2026 earnings estimates realistic?
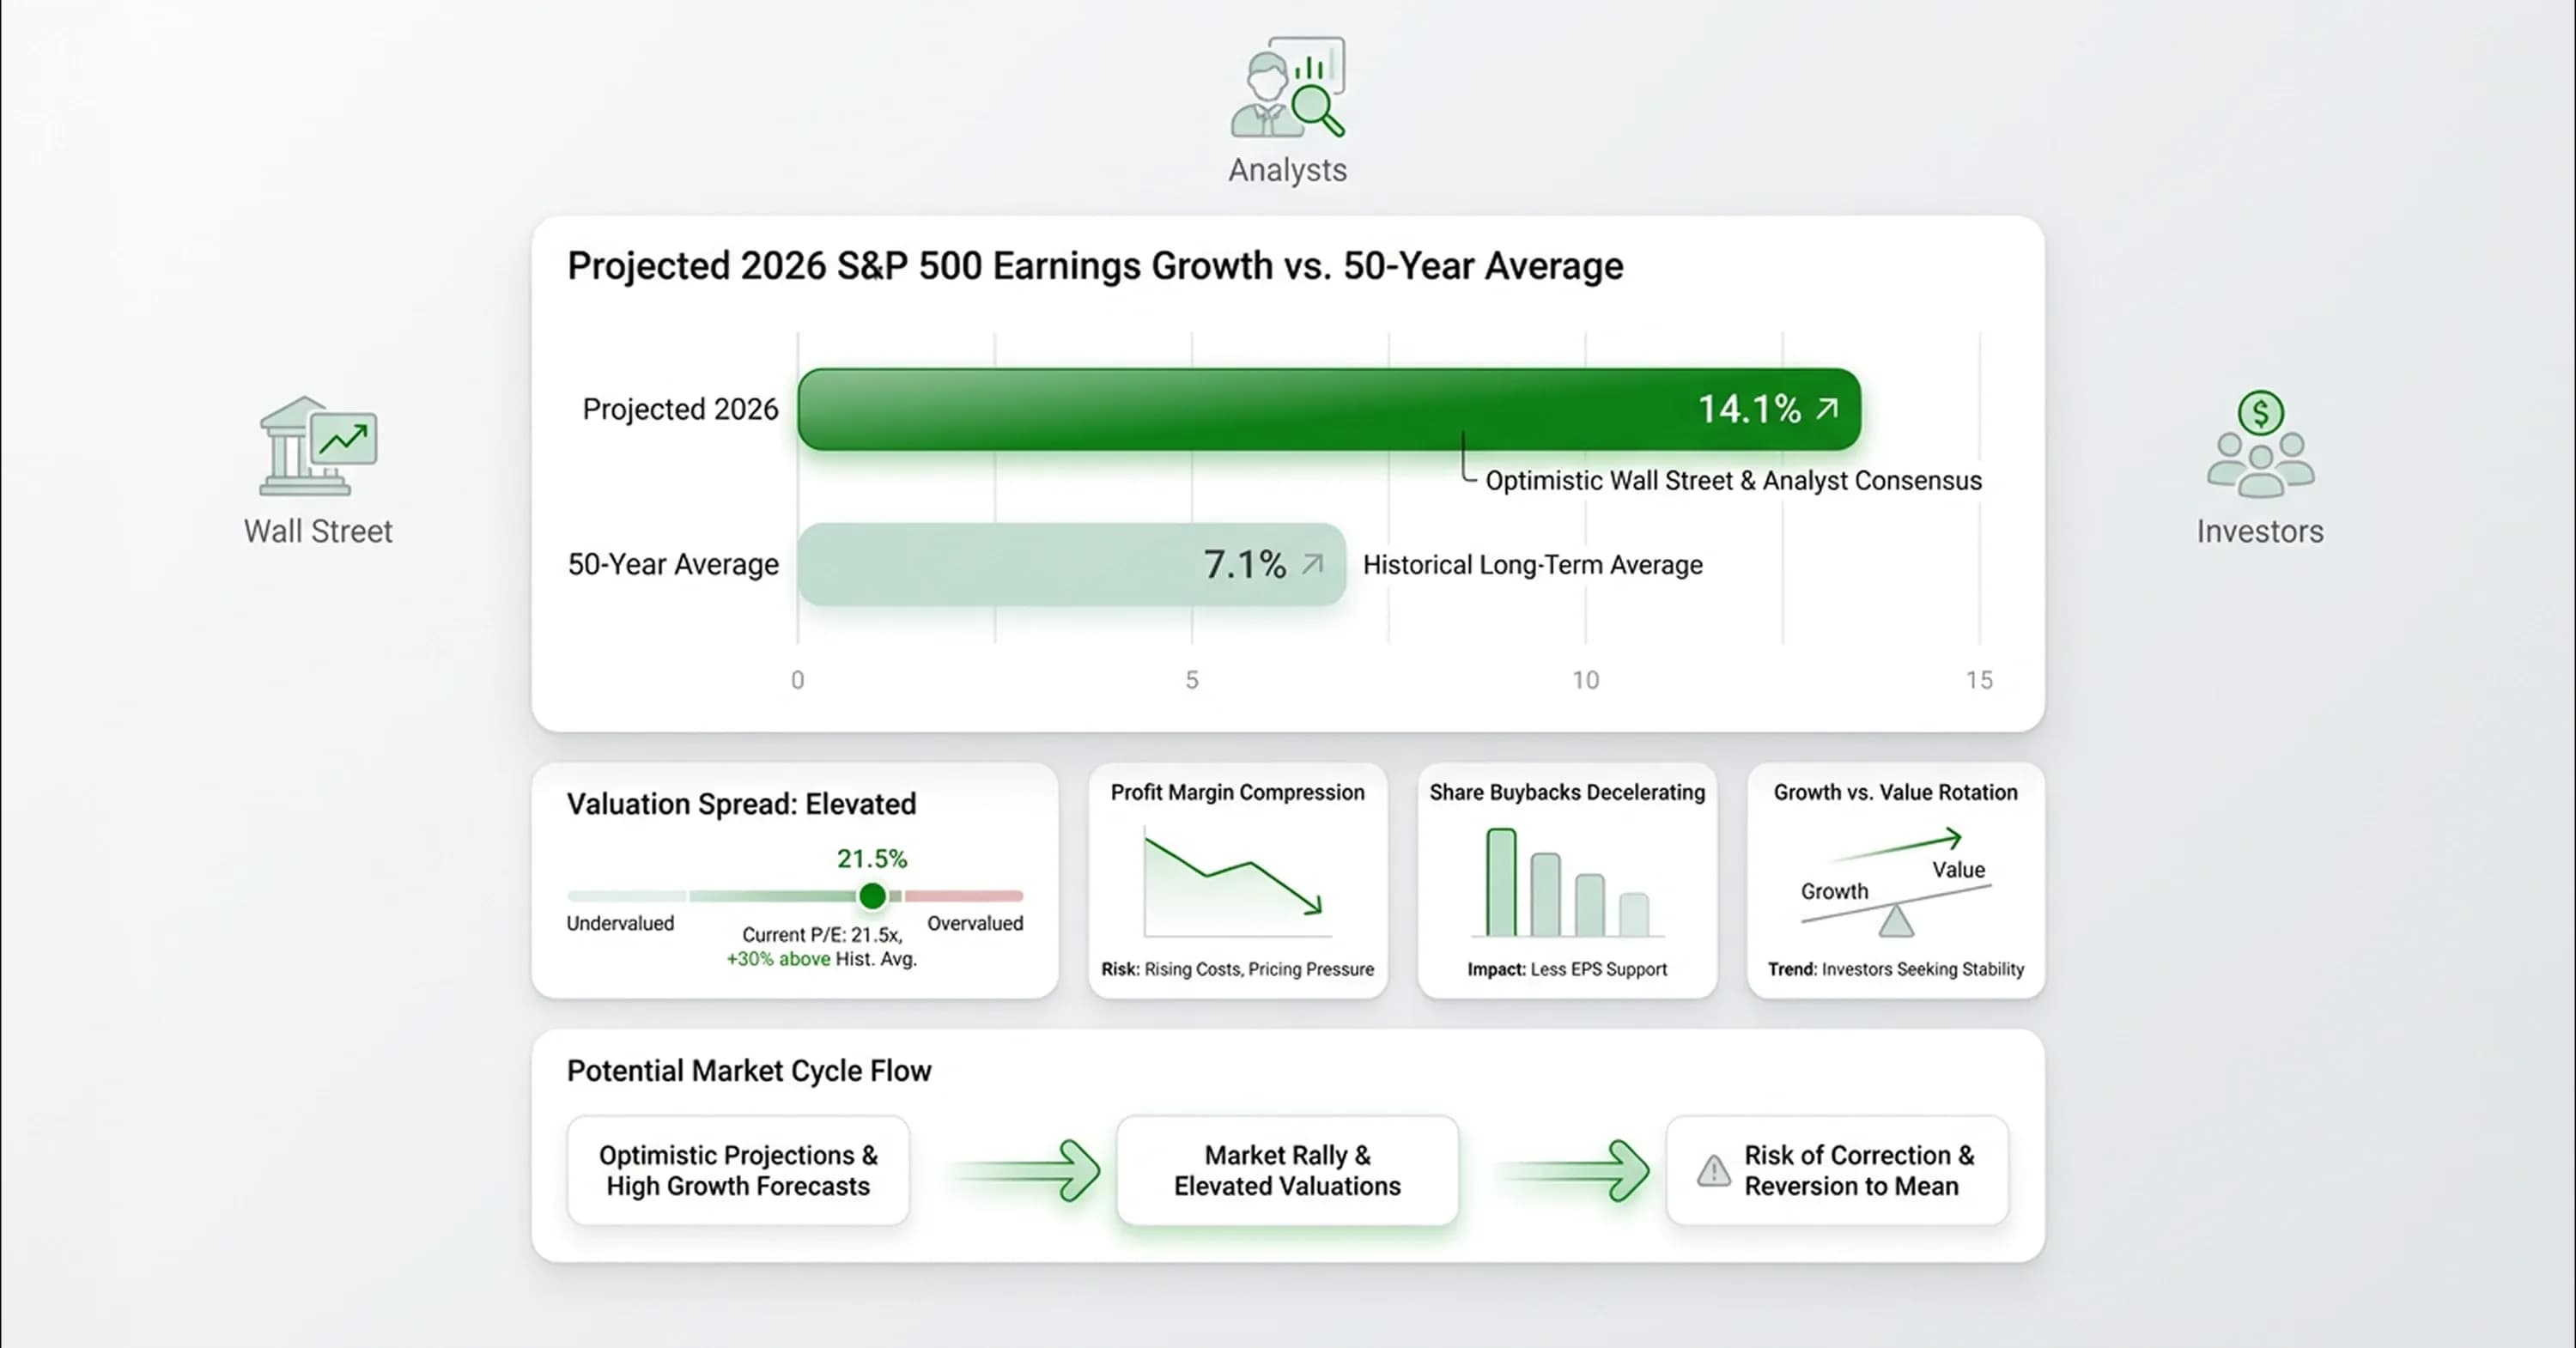
Financial analysts monitor these sector declines to determine if broader market projections remain accurate, because current stock prices rely heavily on optimistic Wall Street targets that assume continuous corporate growth.
According to consensus expectations, Wall Street projects 14.1% earnings growth for the S&P 500 in 2026. This figure represents double the 50-year annualized growth rate of 7.1%. Given the current economic pressures, market participants must question the sustainability of these projections.
If economic headwinds continue to compress profit margins, these aggressive growth targets will likely fail. Rob Arnott, Founder and Chairman of Research Affiliates, told Morningstar: "Growth was getting more and more frothy. And lo and behold, right now, the relative valuation spread is in the top 2 percentiles of all of history in terms of the spread between growth and value. The snapback when it comes is likely to be stupendous."
Arnott's point is that the premium investors currently pay for growth stocks relative to value stocks has reached a historically extreme level. A spread that, based on past cycles, tends to correct sharply rather than gradually. A systematic review of past performance also reveals that share buybacks previously masked weak organic growth across many sectors. Companies reduced their total share count and artificially boosted earnings per share without actually selling more products or services.
What history says about corrections from elevated valuations
The five previous times the CAPE ratio exceeded 30 during a continuous bull market led to eventual declines ranging from 20% to 89%. The current reading of approximately 38 to 41 sits well above that threshold, which places U.S. stock market valuation in territory that has historically resolved through sharp repricing rather than gradual normalization.
What history also reveals is that the path of the correction depends heavily on whether earnings hold. In 2022, when the CAPE briefly touched 40 before declining, the S&P 500 dropped 25% over nine months while corporate profits remained largely intact. The multiple compressed but earnings did not collapse.
In 2000 to 2002, by contrast, both the multiple and earnings fell simultaneously, and the index lost more than 40%. The distinction matters for interpreting the current environment because the three forces such as energy-driven margin compression, labor market deterioration, and AI-driven software repricing carry a different implication for earnings.
An oil price sustained above $100 compresses margins but does not necessarily destroy them. A second consecutive month of negative payroll growth moves the risk profile closer to an earnings recession. A broad loss of pricing power among legacy software companies accelerates both outcomes simultaneously. History does not predict which path materializes, but it does show that U.S. stock market valuation starting from a CAPE near 40 leaves almost no buffer against earnings disappointment before the index reaches overvaluation territory on any reasonable forward metric.
Practical decision framework for U.S. stock market valuation
The historical evidence establishes probability ranges but not outcomes. What turns that evidence into a usable framework is identifying which incoming data points would shift the probability distribution toward the benign scenario versus the severe one.
Second-quarter earnings revisions carry the most signal value. The 14.1% growth consensus assumes that energy cost increases remain manageable, that the February payroll contraction was a one-month anomaly, and that AI disruption stays contained within legacy software rather than spreading to adjacent sectors.
If even one of those assumptions breaks, the consensus number requires revision downward, and U.S. stock market valuation re-rates against a weaker earnings base. History shows that multiple compression alone produces corrections in the 20 to 25% range. Earnings compression added on top has produced losses exceeding 40%.
The unemployment trajectory above 4.4% is the second indicator worth tracking. A single weak payroll print is noise. Two consecutive months of negative payroll growth constitutes a signal that aggregate demand is cooling faster than the Federal Reserve's models anticipated, which constrains its ability to cut rates without reigniting inflation already elevated by energy prices.
Oil price persistence above $100 is the third. Energy shocks that resolve within one quarter have historically produced corrections without recessions. Shocks that persist for two or more quarters have preceded five of the last seven U.S. recessions, according to research from the Federal Reserve Bank of Cleveland.
If crude stays elevated through the second quarter, stagflation risk moves from a tail scenario to a base case, and U.S. stock market valuation faces simultaneous pressure from rising discount rates and falling earnings. This is the most damaging combination the historical record contains.
Conclusion
U.S. stock market valuation remains historically elevated, and the concentration of that overvaluation in a small group of mega-cap technology companies masks genuine vulnerabilities in the broader index. The convergence of energy shocks, labor market deterioration, and AI-driven software repricing does not guarantee a correction. But it does narrow the conditions under which the 14.1% earnings growth consensus can survive intact.
History shows that corrections from CAPE readings above 30 have consistently produced declines of 20% or more, and that the severity scales with how much earnings deterioration accompanies the multiple compression. The three leading indicators worth monitoring closely are second-quarter earnings revisions, the unemployment trajectory above 4.4%, and oil price persistence through mid-year.
InvestViable builds the analytical tools that help evaluate how current earnings estimates hold up against these pressures at the individual stock level. Try our valuation tools to measure how the companies in your portfolio are positioned as U.S. stock market valuation faces its most concentrated test since the dot-com era.