
A valuation tracker holds one row per valuation event per position. The row carries the date, the observed inputs with the source each came from, and the assumed inputs you chose. It also carries the resulting fair value, the market price that day, and a one-line thesis. The observed and the assumed inputs sit in separate column blocks. That separation is the whole point of the record. It lets a later change in fair value be split into the part the facts moved and the part you moved.
A fair value that moved is ambiguous without a valuation tracker
Suppose you valued a holding in February at 75.00 dollars per share and value it again in August at 99.00. The estimate rose 24.00 dollars, or 32 percent. Read on its own, that number says the business improved.
It may not mean that. Between the two dates, three things changed at once. The company filed two quarters, so the trailing cash flow figure you build on is genuinely higher. Market rates moved, so the discount rate you apply is genuinely lower. And somewhere in those six months you also raised your long-run growth assumption, which no filing and no data series told you to do.
The first two changes came from outside you. The third came from you. A single fair value cannot distinguish them, because by the time you produce the August number, the February inputs exist only in memory. Memory is the wrong instrument here. Recalling what you assumed six months ago, after seeing how the position performed, tends to reproduce an assumption consistent with the outcome rather than the one you actually held. CFA Institute groups hindsight bias with the belief-perseverance biases.
This is the specific failure a valuation tracker prevents. A filing cabinet stores documents and a performance log stores outcomes; this stores inputs. It keeps them available in a form precise enough to be recomputed. The difference between two estimates can then be attributed rather than guessed at. A tracker earns its keep at the second valuation, not the first.
What to record: the column split that makes drift readable
The sourced-versus-reasoned distinction is not new. It is already the discipline the valuation report and the framework template impose inside a single valuation. The tracker's contribution is to carry that distinction into columns which persist across dates.
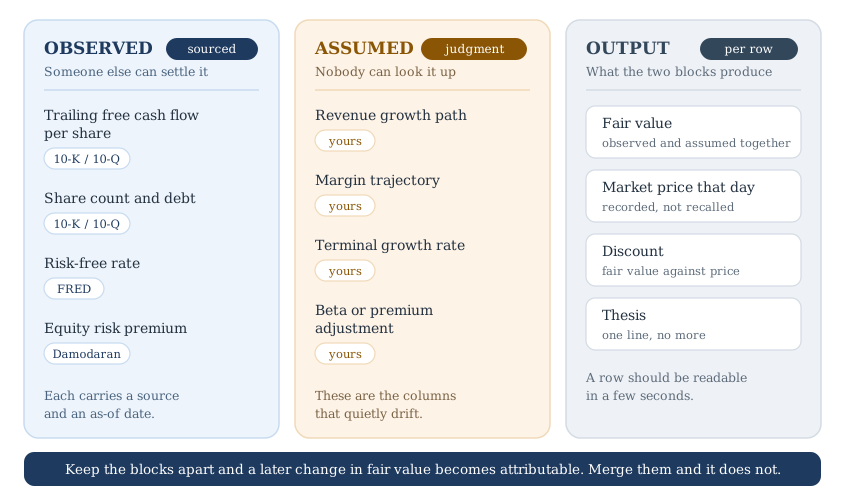
So the structural requirement is a split. Observed inputs occupy one block, assumed inputs occupy another, and the fair value that falls out of them sits in a third. A tracker that lists every input in one undifferentiated run holds the same numbers and cannot answer the question it exists for.
The observed block holds figures that came from somewhere you can point at. Trailing revenue, operating margin and capital expenditure trace to the most recent annual or quarterly filing on SEC EDGAR. They roll up into the free cash flow per share the model consumes. The risk-free rate traces to the ten-year Treasury constant-maturity series, DGS10 on FRED. The equity risk premium traces to Aswath Damodaran's implied equity risk premium series at NYU Stern. Share count and debt trace to the balance sheet. The first three can be checked by someone else and settled against a document. The implied premium is different in kind, because it is published and reproducible but is itself the output of a model. Record it as sourced, and record which vintage you took.
The assumed block holds the figures you chose. The revenue growth path, the margin trajectory, the terminal growth rate, and whatever beta or premium adjustment you applied on top of the published inputs. Nobody can settle these by looking them up. They are your judgment, and the tracker's job is to hold them still so you can see them move.
Each input carries a source, an as-of date, and a basis. That three-tag rule is developed in the report; the tracker inherits the tags rather than restating them. The column saying which block an input belongs to is the tracker's own addition.
The output block is short: fair value, the market price that day, the discount between them, and one line of thesis. The DCF inputs checklist covers the verification each input should survive before it is written into either block.
Figure 1. Two blocks of columns, one fair value
Observed inputs are sourced and settleable. Assumed inputs are judgment. The split is what makes a later change in fair value attributable.
Separating a fact change from an assumption change
The figures below test the arithmetic rather than describe any business. They divide cleanly by design, and the rates are illustrative rather than current readings.
Name the model first, because the decomposition depends on it. This example values the share as a perpetuity on trailing free cash flow, with growth in the denominator only. Fair value equals trailing free cash flow per share divided by the discount rate less the growth rate.
The record also states a policy for the discount rate. It is built from the observed risk-free rate and the observed equity risk premium, with beta held at 1.0. In February those read 4.0 and 5.0 percent, giving 9.0 percent. By August the risk-free rate had fallen to 3.5 percent, giving 8.5 percent.
The premium holds still for a documented reason. Damodaran updates the implied premium series once a year, in the first two weeks of January, so both rows carry the same published vintage. In the January 2026 update, the row labeled 2025 reads 4.23 percent, and the round 5.0 used here is illustrative. Beta held at 1.0 is an assumption set to its null value rather than the absence of one.
The February row reads 4.50 dollars of trailing free cash flow per share, a 9.0 percent discount rate and 3.0 percent terminal growth, giving 4.50 divided by 0.06, or 75.00. The August row reads 4.95, 8.5 percent and 3.5 percent, giving 4.95 divided by 0.05, or 99.00. Terminal growth now sits exactly at the risk-free rate, the conventional ceiling. Recording both on the same row makes that collision visible.
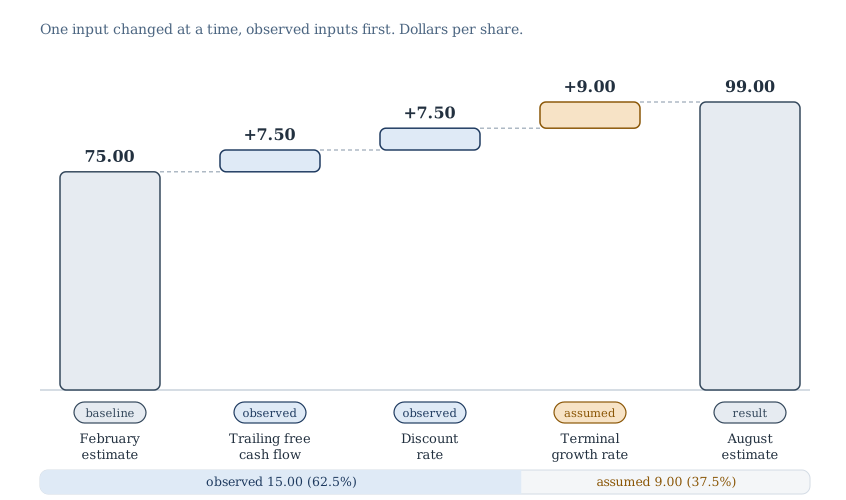
Now change one input at a time, observed inputs first. This is the one-way move that sensitivity analysis makes inside a single estimate, run here across two dates instead. Raising trailing free cash flow from 4.50 to 4.95 gives 82.50, worth 7.50. Lowering the discount rate to 8.5 percent gives 90.00, worth another 7.50. Raising growth to 3.5 percent gives 99.00, worth 9.00. The three steps sum to 24.00.
On that order, observed inputs contributed 15.00 dollars and the assumption contributed 9.00, or 37.5 percent.
That 37.5 percent is convention-dependent, and the reason deserves stating. The discount rate and the growth rate enter this model only through their difference, so a 50 basis point move in either is the same operation. A one-at-a-time decomposition credits each interaction to whichever input moves later, so a contribution grows the further down the order it sits. Move growth first and it is worth 6.82, or 28.4 percent. Averaging across all six orderings, the symmetric treatment, puts it at 32.9 percent. The choice of model matters far less: the textbook growing-perpetuity form, which advances the cash flow one period, moves the share only to 38.7 percent.
So somewhere between a quarter and two-fifths of that improvement was authored by the analyst. A record that reports one figure should name the convention that produced it.
Figure 2. Where the 24.00 dollars came from, on the stated convention
One input changed at a time, observed inputs first. Two steps trace to filings and published data; the third traces to the analyst.
Record the position, not only the valuation
A tracker that holds only valuations describes an analyst's opinions over time. Adding a small set of position columns makes it describe decisions instead.
Record the entry date, the price paid, and the fair value you held at that moment. From those three, the record carries the discount you actually accepted when you committed capital. That number is worth keeping because it is the one most often misremembered. An investor who requires a 30 percent discount may find something else in the record after a year. Some entries sit at 12 or 15 percent, each justified at the time by a reason that was never written down.
Record the market price on every subsequent valuation date too, not only the fair value. The pair lets you separate two different things that both feel like being right: the estimate proving durable, and the price moving your way. They are not the same event and they do not always occur together.
The discount you require is not a single number across a portfolio. It should widen as the reliability of the forecast falls, which is the calibration the margin of safety definition sets out. The tracker records the discount you applied and the business type you applied it to. Over enough rows, that shows whether your calibration is a rule you follow or a preference you restate afterward.
What the record is not
Three neighboring artifacts get confused with a tracker, and keeping them distinct keeps the tracker small.
It is not a valuation report. The report is the full written deliverable for one ticker at one moment, with the thesis, the assumptions, the range and the risks set out in prose. It answers whether this estimate is defensible. The tracker holds one row drawn from each report and answers a different question: what changed since the last one.
It is not a valuation model. The spreadsheet that turns inputs into an intrinsic value range, with its input, calculation and guardrail sections, is developed in the framework template. The tracker sits downstream of the model and stores what the model was fed.
It is not a monitoring layer. A monitoring layer fires when a condition written at thesis time is met, and the valuation-first tool stack places that at Layer 5. The tracker is not a sixth layer. It is the substrate that layer reads from, because a trigger fires against a condition and the tracker is where the condition's original inputs are stored.
None of the three is redundant with the tracker, and none substitutes for it. Each answers a different question, and only the tracker reads across dates.
Reading the record across positions
A single row is a note. The value compounds when the rows are read together, and two reads are worth running.
The first is staleness, and it is borrowed rather than new. Versioning in the report and the refresh cadence in the framework template both make a single stale valuation visible. What the tracker adds is that it runs the check across every position at once instead of one document at a time. The InvestViable stock screener screens a universe of 3,000+ US stocks on fundamentals and the Investment Score. That puts a name's current figures next to the row before the next review. The Investment Score sits beside them as a structured assessment of the same company's fundamentals, not a view on its price.
The second read is the one only a tracker can give you. Across every revaluation in the record, tally the direction of the assumption changes. Suppose growth assumptions, margin trajectories and discount rates have moved on most positions in the direction that raises fair value. That is a finding about the analyst rather than about the market. A one-way drift is the same evidence whether the analyst calls it conviction or a reader calls it anchoring.
Neither read requires new analysis. Both are properties of a record that separated observed inputs from assumed ones, which is why the column split pays for itself. Where the record shows an assumption doing most of the work, that is the input to re-derive first at the next review. The InvestViable Valuator exposes the forward inputs behind a displayed intrinsic value: the cash flow growth path, the discount rate and the terminal growth rate. A suspect assumption can be re-run against alternatives there directly.
Starting one on a position you already hold
Open the most recent valuation you have for a holding and copy its inputs into two blocks. Anything you can point to a filing or a published series for goes in the observed block with its date. Everything else goes in the assumed block. Add the fair value, the price that day, and one sentence of thesis.
If the earlier inputs were never written down, do not reconstruct them. Write today's row and treat the comparison as beginning now, because an assumption recalled after the outcome is known is not evidence about what you believed. The row you write today is what makes the next one readable.
The safety checklist determines whether a business deserves a valuation at all, and its verdict belongs on the row as a dated third item, in neither block. It is judgment applied to observed data, which is what makes it a gate rather than an input.
One row per position is enough to start. Do not try to backfill the whole portfolio in an evening. Rows written in bulk tend to carry the assumptions you hold today rather than the ones each position was underwritten on.
The record becomes useful at the second valuation. That is when the difference between two dated estimates stops being a feeling about a company and becomes arithmetic you can take apart.
InvestViable does not publish buy or sell recommendations on individual securities. All analysis is based on public financial data and a transparent methodology. The Investment Score formula is proprietary; the inputs and what the score evaluates are documented.