
InvestViable does not publish buy or sell recommendations on individual securities. All analysis is based on public financial data and a transparent methodology. The Investment Score formula is proprietary; the inputs and what the score evaluates are documented.
Why a self-authored template beats an ad-hoc per-ticker spreadsheet
When the analyst builds a new spreadsheet from scratch for every candidate, the model varies invisibly across positions. The discount rate logic that was rigorous for the August analysis becomes a shortcut for the November analysis because the deadline was tighter. The terminal value structure that was a two-stage fade for the consumer compounder becomes a single-stage perpetuity for the industrial because the workbook was copied from a different template. The valuations are not comparable across the portfolio because the calculations they rest on are not identical. The output looks like a number, but the methodology behind each number drifts position by position.
A self-authored valuation framework template solves the drift problem by establishing the methodology once and reusing the same structure across tickers. The template is a single workbook with a documented input architecture, a fixed calculation logic, and a guardrail layer that runs before the output is read. The inputs change ticker by ticker. The calculations and the guardrails do not. The output is therefore comparable across positions: an intrinsic value produced from the same model structure on two different issuers is a defensible comparison; an intrinsic value produced from two different model structures on two different issuers is not.
The template is also different from the valuation engine the analyst rents from a retail-facing analytical platform. A rented engine exposes some inputs, hides others, and produces an output the analyst cannot fully audit. A self-authored template exposes every input by construction, computes every intermediate value the analyst chose to expose, and surfaces the gating checks in a layer the analyst can update when the methodology improves. The rented engine optimizes for ease of use across many users. The self-authored template optimizes for analytical control by a single user.
Authoring the template once and reusing it is the cheapest discipline in equity analysis. The fixed cost is the ten to fifteen hours required to lay out the three sections cleanly. The marginal cost per ticker is the time required to populate the inputs section and read the guardrail outputs. The portfolio-level benefit is the comparability that the rented engine cannot deliver.
The three-section anatomy of a valuation framework template
The template has three sections that run sequentially: an inputs section that sources each model parameter, a calculations section that converts the inputs into an intrinsic-value range, and a guardrails section that gates the output against minimum-quality thresholds. The sections are layered in a strict order. Each calculation cell depends on inputs that the inputs section has populated. Each guardrail check runs against outputs that the calculations section has produced. The output of the template is not a single number, but a documented chain from primary source to per-share value with explicit failure points along the way.
Figure 1. The three-section anatomy of a stock analysis valuation framework template
The inputs section sources each parameter from a documented primary record. The calculations section converts the inputs into an intrinsic-value range. The guardrails section gates the output against minimum-quality thresholds before any number is read.
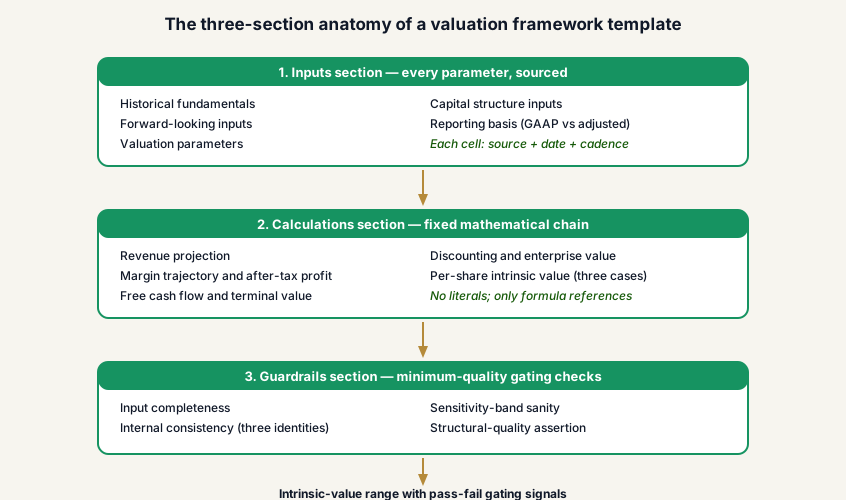
The separation between the three sections is the analytical discipline. A template that mixes input cells with calculation cells produces unauditable outputs because the analyst cannot tell at a glance which cells are sourced and which are derived. A template that mixes calculations with guardrails masks failures because the gating condition is buried inside the math. The three-section layout makes the chain visible: any input cell points to a source; any calculation cell points to upstream input or calculation cells only; any guardrail cell evaluates a calculated output against a documented threshold and produces a pass-fail signal that sits alongside the number it gates.
The template's reusability across tickers depends on this separation. When a new candidate ticker is loaded into the template, only the inputs section is populated. The calculations section auto-recomputes against the new inputs. The guardrails section auto-evaluates against the new calculations. The analyst reads the intrinsic-value range and the guardrail signals together, and the comparison against prior tickers is mechanical because the calculation and guardrail logic was identical for both.
The three-section layout also documents the chain for a colleague who inherits the template. The inputs section reveals the analyst's sources; the calculations section reveals the analyst's math; the guardrails section reveals the analyst's quality thresholds. A colleague who disagrees with the output can point to a specific cell in a specific section and update either the source, the math, or the threshold. The disagreement is structured rather than opinion against opinion.
The inputs section: what to include and where each input comes from
The inputs section is a single contiguous block at the top of the template that contains every parameter the calculations section will reference. Each parameter is a labeled cell with a documented source, a documented as-of date, a documented basis (audited or pre-filing estimate), and a documented refresh cadence. The discipline is that no calculation cell anywhere in the template references a hardcoded literal; every literal lives in the inputs section, and every calculation cell traces back to an inputs-section cell.
The input categories are deliberately stable across tickers so the template is reusable. The minimum input architecture covers historical fundamentals (trailing-twelve-month revenue, operating margin, depreciation and amortization, capital expenditure, working-capital changes), forward-looking inputs (revenue growth path, operating margin trajectory, terminal growth rate), valuation parameters (the discount-rate components: risk-free rate, equity risk premium, beta, after-tax cost of debt, target capital structure), capital structure inputs (total debt, cash and equivalents, diluted weighted-average share count under the treasury-stock method), and reporting basis (GAAP versus management-adjusted). The DCF inputs checklist develops the verification questions the analyst runs on each category before the input cell is treated as populated.
The source discipline is the half of the inputs section that platforms typically hide. Historical fundamentals trace back to the most recent 10-K or 10-Q on SEC EDGAR; the analyst records the filing date, the period-end date, and the line-item label so a colleague can re-derive the figure. The risk-free rate inputs trace to the current 10-year Treasury yield on FRED. The equity risk premium and unlevered beta inputs trace to Aswath Damodaran's published valuation data at NYU Stern. Foreign private issuer inputs trace to the 20-F or the home-country regulator. Every input cell carries a small comment or adjacent column with the source URL or filing reference, so the trace is one click away.
The refresh cadence per input is also stored in the inputs section. Historical fundamentals refresh quarterly when the issuer files. The risk-free rate refreshes when the Treasury yield moves materially since the last review. The equity risk premium refreshes annually when the Damodaran update is published. The share count refreshes whenever a buyback program or new issuance materially changes the diluted count. The cadence column makes input staleness visible at a glance; an input that has not refreshed in twelve months on a ticker that has just reported is a red signal the template surfaces before the output is read.
The calculations section: structuring the stock analysis calculation method
The calculations section converts the populated inputs into an intrinsic-value range. The structure of the section is the stock analysis calculation method the analyst commits to once and reuses across tickers. The discipline is that every calculation cell points to inputs-section cells or to upstream calculation cells, never to a hardcoded literal and never to a manually overridden value. The cell formula is the model; if the analyst wants to override a value, the override lives in the inputs section, not in the calculation cell.
Figure 2. The calculation chain inside a discounted cash flow template
The calculations section converts inputs into an intrinsic-value range through a fixed sequence of intermediate computations. Each block depends only on the blocks upstream of it; the chain is auditable end to end.
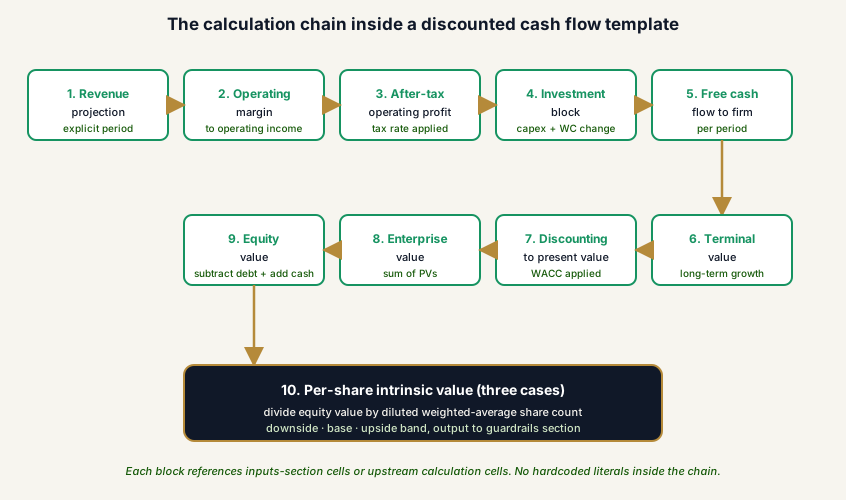
A discounted cash flow chain is the canonical structure for the section: a revenue projection extends the historical top line over the explicit forecast period; an operating margin trajectory converts revenue into operating income; a tax adjustment converts operating income into after-tax operating profit; an investment block (capital expenditure net of depreciation, plus working-capital change) converts after-tax operating profit into free cash flow to the firm; a terminal value computation applies the long-term growth assumption beyond the explicit period; a discount-rate block discounts each period's free cash flow and the terminal value to present value; a capital-structure adjustment subtracts debt and adds cash to convert enterprise value to equity value; a share-count adjustment divides equity value by the diluted weighted-average share count to produce a per-share intrinsic value. Each block is one or two cells. The chain runs in under thirty cells for a single-stage model and under sixty cells for a two-stage model with a fade.
The output of the calculations section is an intrinsic-value range, not a point estimate. The range is produced by running the chain twice or three times with different input sets: a base case using the central inputs, a downside case using conservative inputs, and an upside case using aggressive inputs. The intrinsic-value range is the band the three cases produce; the valuation methodology pillar article develops the principle in more depth. The range, not the base case alone, is what the guardrails section evaluates and what the analyst carries forward into the margin-of-safety decision.
The calculations section also computes sensitivity. The two inputs that dominate the output of any DCF chain are the discount rate and the terminal growth rate; a small change in either reshapes the conclusion. The section includes a sensitivity table that shows the per-share intrinsic value at a grid of discount rates and terminal growth rates. The grid is the analyst's read on which inputs drive the conclusion; an output highly sensitive to the discount rate is a different finding from an output dominated by terminal value structure.
The guardrails section: minimum-quality checks before the output ships
The guardrails section sits below the calculations section and gates the intrinsic-value range against minimum-quality thresholds. The guardrails do not change the calculated numbers. They evaluate the calculated numbers against documented criteria and produce a pass-fail signal alongside each result. An output that passes the calculations but fails a guardrail is not a usable output; the analyst either fixes the inputs that caused the failure or sets the ticker aside as un-modelable in the template's current structure.
The minimum guardrail set covers four categories. The first is input completeness: every cell in the inputs section is populated, dated, and sourced. A missing source on any input cell is a failure; the template should not produce an intrinsic value from inputs the analyst has not documented. The second is internal consistency: the three financial statements implied by the inputs reconcile. Net income ties to operating cash flow through documented non-cash items; net change in cash on the cash flow statement ties to the change in balance-sheet cash; net income ties to the change in retained earnings less dividends declared, with share repurchases reconciling separately against treasury stock and paid-in capital. The fundamental analysis checklist develops the three reconciliation identities; the guardrails section runs them as gating checks. The third is sensitivity-band sanity: the per-share intrinsic value across the downside-base-upside range is no more than four to five times the lowest case. A range that spans a multiple wider than that signals one of the dominant inputs is under-constrained and the model is too sensitive to be useful as a price boundary.
The fourth guardrail category is structural-quality assertion. The template asks whether the issuer being modeled passes the upstream stock-analysis safety checklist the analyst runs before any valuation work begins. A ticker that fails the cash-conversion test, the solvency test, the insider-alignment test, the accounting-anomaly test, or the moat test does not deserve a DCF valuation; the guardrails section flags the structural failure and the analyst does not read the intrinsic-value range. The discipline avoids the common error of producing a precise intrinsic value for an issuer whose business is structurally too fragile to support any forward projection. The PCAOB auditing standards library is the reference work for the audit-risk logic the structural guardrail mirrors at the analyst's desk.
The guardrail outputs are visible side by side with the intrinsic-value range. The analyst reads the range only after every guardrail returns pass. A red guardrail is the template's refusal to produce a usable output; it is the discipline that distinguishes a documented practice from a number-out-of-a-spreadsheet that lacks structural review.
How to apply this stock analysis template to any ticker
The template is a one-time investment in methodology and an ongoing investment in input populating. The application workflow on any new candidate ticker is five steps that run in roughly twenty to thirty minutes once the analyst is familiar with the template's structure.
The first step is to populate the inputs section. The historical fundamentals come from the most recent 10-K or 10-Q on EDGAR; the analyst records the period-end date, the filing date, and the line-item label for each. The valuation parameters come from FRED for the risk-free rate, Damodaran for the equity risk premium and unlevered beta, and the issuer's own filings for the debt and share-count inputs. The forward-looking inputs come from the analyst's own conviction on the revenue growth path, the margin trajectory, and the terminal growth rate; these are the cells where the analyst's judgment is anchored. The CFA Institute Research Foundation's equity asset valuation publications develop the methodology behind the forward-looking input choices.
The second step is to read the calculations section's output: an intrinsic-value range across the downside-base-upside cases and the sensitivity table. The range becomes meaningful only after the third step, which is to read the guardrails section. Every guardrail must return pass before the range is used. A failing input-completeness check sends the analyst back to the inputs section; a failing reconciliation check signals data-source quality issues that need to be resolved before the model can run; a failing sensitivity-band check signals an over-constrained or under-constrained model that needs methodology tightening; a failing structural-quality check disqualifies the ticker from the template entirely.
The fourth step is to convert the validated intrinsic-value range into a maximum-acceptable price by applying a margin-of-safety discount calibrated to business type. The margin of safety operational definition develops the calibration logic; the template carries the calibration band into a final cell that produces the action threshold. The fifth step is to hand the template's filled state off to the position-level workflow, which uses the shares screener filtering workflow to identify whether the current market price is at or below the threshold.
The template sits at the engine layer of the analyst's valuation-first tool stack. The InvestViable Valuator implements a similar inputs-calculations-guardrails pattern at the platform level, surfacing three forward inputs (cash flow growth path, discount rate, terminal growth rate) the user can override directly on the displayed intrinsic value; the Valuator and the self-authored spreadsheet template are two instances of the same methodology, sized for different workflows. The template's value over time is cumulative: the methodology refinements the analyst captures inside it survive every ticker the workbook touches, which is the long-run compounding the rented engine cannot deliver.