
Run the analysis in three passes. First build the ledger. Total ten years of operating cash flow, net debt raised, net equity raised and asset sale proceeds. Then assign every dollar to capital expenditure, acquisitions, debt repayment, dividends, repurchases, or a residual for the cash that simply accumulated. With the residual in place, sources and uses have to tie. Second, run the outcome test on the reinvested portion. Divide the change in operating profit after tax by the capital retained over the same span. That ratio is the incremental return on retained capital, and it is the number a reported average return hides. Third, state what the ledger cannot settle: the counterfactual, the sector's base rate, and whether the people who made the record are still there.
What a capital allocation analysis measures
Management gets to make one recurring decision that shareholders never see directly. Cash arrives from operations, and somebody decides where it goes. Over a single year that decision is mostly noise. Over ten years it compounds into the difference between two companies with identical products.
The decision is unusually well documented. Unlike strategy, culture or execution, allocation leaves a complete numerical record, filed quarterly, in a statement built for the purpose. A capital allocation analysis is the exercise of reading that record in full rather than reacting to the announcements that accompanied it.
Two things separate this from a judgment about management quality. The ledger is arithmetic: it either ties or it does not, and two analysts working from the same filings should produce the same totals. The outcome test is a ratio with a stated numerator and denominator, which means it can be recomputed and disputed on its inputs. Neither step requires an opinion about the people involved, and this article does not offer one.
Scale explains why the exercise repays the effort. In Aswath Damodaran's dividend fundamentals dataset, with data as of January 2026, US companies paid dividends worth 34.83 percent of aggregate net income. Adding buybacks lifts the figure to 83.17 percent. Netting out new share issuance brings it back to 68.55 percent. Read across those three numbers. The dividend line, which most summaries report, is about two fifths of the gross cash returned. New issuance offsets 14.62 points of it, and the dataset does not separate employee grants from capital raised. These are dollar aggregates across 5,994 firms and describe the market rather than the typical company.
The safety checklist for avoiding value traps screens on solvency and earnings quality, which are conditions of the balance sheet today. The allocation record is the history that produced that balance sheet. One is a snapshot and the other is the path.
The five uses of a dollar, and the capital allocation track record they build
A capital allocation track record is a sources-and-uses table covering ten fiscal years. Sources are operating cash flow, net debt raised, net equity raised, and proceeds from asset sales. Uses are the five destinations, plus a residual for cash that simply accumulated.
Reinvestment in the existing business comes first. It is the use most directly aimed at raising the earning power of what the company already owns. It shows up as capital expenditure and, for many businesses, as capitalized software or development spending sitting in the same section.
Acquisitions buy assets and earnings the company chose not to build. They are the highest-variance use, and the one where the price paid is hardest to check against what was received.
Debt repayment retires a claim that ranks ahead of the shareholders. It looks defensive and often is, though it is also the correct answer when leverage is high enough that the equity has become an option rather than a stake.
Dividends return cash to every holder in proportion, on a schedule the company has effectively committed to. Repurchases return cash selectively, only to holders who sell, at whatever price the market sets that quarter.
The five compete against one another at a single hurdle. Each use carries an expected return, and the defensible choice is whichever return is highest measured against what the capital costs. That ordering is rarely how the decision gets made. A dividend once set becomes a commitment management is reluctant to cut, so it tends to be funded first while the other four compete for the remainder. Recognizing the inversion is useful when reading a ledger. A company that raised debt in a weak year to protect a dividend has told you which claim it treats as fixed.
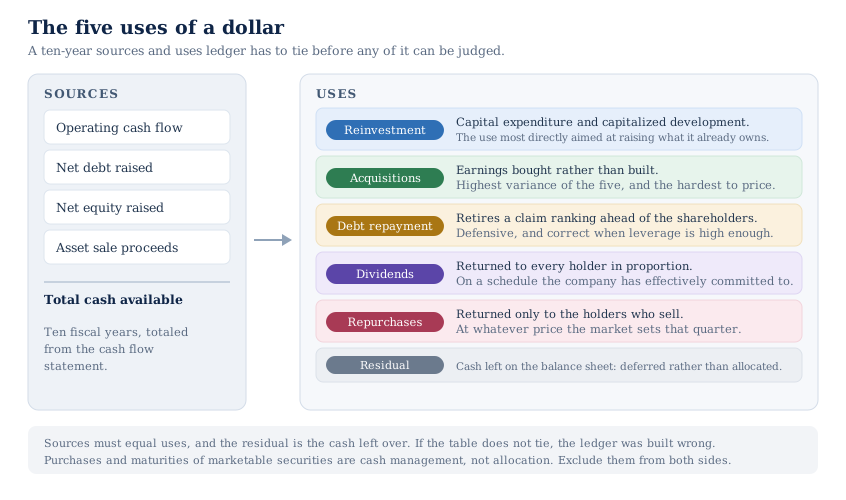
The residual line matters more than it looks. Cash that accumulates has not been allocated, it has been deferred, and a decade of deferral is itself a finding. Keeping it visible is also what forces the table to balance, which is the first check that the ledger was built correctly.
Where each line sits in the filings
Every figure in the ledger comes from one statement, which is what makes the exercise reproducible. The SEC's EDGAR filing search holds the annual reports, and how to read a 10-K like a value investor covers the reading order.
The investing section carries two of the five uses. Purchases of property and equipment is the capital expenditure line. Acquisitions, net of cash acquired, is the acquisition line. Sitting between them are purchases and maturities of marketable securities, which are not an allocation decision at all. They are the treasury moving cash between a bank account and short-dated paper. Netting them into the ledger inflates both sides and destroys the comparison.
The financing section carries the other three. Dividends paid, repurchases of common stock, proceeds from issuance of common stock, and the two debt lines for issuance and repayment. Repurchases and issuance belong together, because the gross repurchase figure says nothing about whether the share count moved. Stock buybacks and insider activity covers that netting and the price test that goes with it.
Capital retained
Capital expenditure plus acquisitions, less depreciation and amortization, summed across the period. It approximates the cash the company kept and committed to productive assets, as distinct from the cash it returned to holders or used to retire debt. It excludes working capital, which is a convention worth stating because some published reinvestment measures include it.
Two adjustments are judgment calls, and both should be stated rather than buried. Capital expenditure mixes maintenance with growth, and no filer discloses the split. Depreciation is the usual proxy for the maintenance portion, and it is a weak one. It reflects the historical cost of an older asset base, so it understates replacement cost once prices have risen. An understated maintenance figure inflates capital retained, which biases the incremental return down. The bias runs one way, so a low reading on a long-lived asset base deserves a second look. The second call is capitalized development spending. It is capitalized once a project clears the recognition thresholds and expensed before that, so the split lands differently across two filers running similar programs. Read the accounting policy note first.
One line reliably goes missing. An acquisition paid for in stock consumes no cash, so the purchase price never reaches the investing section. The line may still appear there, and may even be an inflow, because cash held by the target is netted into it. The price still got paid, by every continuing holder, through dilution. Reading the diluted share count and the statement of stockholders' equity alongside the ledger is what catches it. Basic, diluted and float share counts sets out which count to use.
The outcome test: incremental return on retained capital
The ledger says what happened. It does not say whether it worked. For that, compare what the company kept with what it now earns.
Incremental return on retained capital = (NOPAT_final − NOPAT_base) ÷ capital retained
where NOPAT is operating profit before interest multiplied by one minus the effective tax rate, struck on a consolidated basis and on the same basis in both years. The base year is the fiscal year immediately before the ledger opens, so the starting profit predates the first dollar retained. Capital retained is capital expenditure plus acquisitions less depreciation and amortization across the ledger period. The result is what the marginal dollar earned, not what the average dollar earns.
The distinction from a reported return is the whole point. Return on invested capital divides current profit by the entire capital base, so it blends dollars committed last year with dollars committed thirty years ago. The incremental version isolates the recent ones. Return on invested capital against return on equity and return on assets sets out the level metrics and their denominators; this is the marginal counterpart.
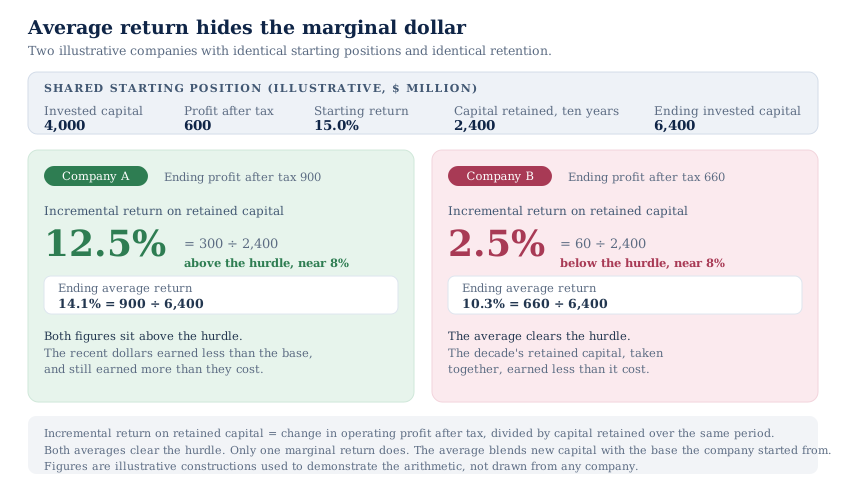
Two illustrative companies show the gap. Invested capital here is book debt plus book equity less cash, goodwill included, read at the closing balance sheet date. Beginning-balance and average-balance conventions are equally common and give different answers, so state yours. Both companies start with invested capital of 4,000 million and operating profit after tax of 600 million, a return of 15.0 percent. Both retain 2,400 million over the following decade, with no change in working capital or cash, ending with 6,400 million of invested capital.
The first ends the decade earning 900 million. Its incremental return is 300 divided by 2,400, or 12.5 percent, and its ending average return is 900 over 6,400, or 14.1 percent. The second ends the decade earning 660 million. Its incremental return is 60 divided by 2,400, or 2.5 percent, while its ending average return is 660 over 6,400, or 10.3 percent. Against a cost of capital near 8 percent, the first company's ending average and its marginal dollar both clear the hurdle. The second company's average still clears it while the capital retained over the decade, taken together, fell well short. That hurdle is a weighted average cost of capital, because the ratio being tested is firm-side rather than equity-side. It is not a constant. It builds up from the risk-free rate, and the 10-year Treasury yield published by the Federal Reserve has moved across a wide range over the past decade. It stood at 5.24 percent on October 9, 2026. State the hurdle you used and the date it came from.
Damodaran's fundamental growth dataset states the forward version of the same relationship. Expected growth in operating profit equals the return on capital multiplied by the reinvestment rate. As of January 2026, US firms excluding financials show 15.07 percent against 48.81 percent, giving expected growth of 7.36 percent. Both are trailing book-value aggregates. His reinvestment rate divides net capital expenditure plus the change in non-cash working capital by operating profit after tax. It therefore includes the working capital the ledger definition leaves out. The identity is a steady-state statement about one year's rates, so it will not reconcile numerically with a ten-year ledger.
Acquisitions, the line that is hardest to score
Acquisitions deserve separate treatment because the evidence on them is unusually direct. Moeller, Schlingemann and Stulz examined acquiring-firm returns in NBER Working Paper 10200, later published in the Journal of Finance. Across 1998 to 2001, acquiring shareholders lost 12 cents at announcement for every dollar spent, a total of 240 billion dollars. Across the whole of the 1980s the equivalent loss was 7 billion dollars, or 1.6 cents per dollar spent.
Read the finding precisely. It measures announcement returns, which are the market's immediate assessment rather than the eventual operating result. Bidders lost in both periods, so the direction is consistent. The size is not. The authors attribute the 1998 to 2001 aggregate to a small number of announcements by firms carrying extremely high valuations. Without those, they note, the aggregate would have been positive. They also find that part of the loss most likely reflects investors reassessing the acquirer's standalone value rather than pricing the deal. The base rate is therefore not that acquisitions destroy value on the scale the headline number suggests.
That points at what to check in a specific ledger. Was the acquisition spending concentrated in one or two large deals, or spread across many small ones? Were the deals struck when the acquirer's own shares were expensive, and was stock the currency? A company issuing richly valued shares to buy a business is making two allocation decisions at once, and the second one is invisible in the investing section.
The outcome test applies to acquisitions with one adjustment. An acquisition is cash spent, so its purchase price enters capital retained. Amortization of acquired intangibles then nets part of it back out, which is why the denominator has to say whether amortization was subtracted alongside depreciation. Goodwill is not amortized and stays in at the price paid. That is the right treatment for scoring allocation, because it asks what the company earned on the money it actually spent. It is also why a serial acquirer's reported return on invested capital runs below an organically grown peer's with identical operations, provided both are computed goodwill-inclusive. On a goodwill-excluded basis the gap largely disappears, so state the basis before comparing two companies.
Impairments need a rule of their own. A write-down says the carrying value no longer holds, and it arrives late. It does not by itself establish that the original price was wrong, because a discount-rate move can trigger one. It is non-cash, so it changes nothing in the ledger. In the outcome test it does depress profit in the final year, while the purchase price already sits in the denominator. Decide which end carries the charge, rather than letting one deal count against the record twice.
What a ten-year record cannot tell you
Four limits deserve stating before the record is used.
The counterfactual is unobservable. The ledger shows what was done and never what the alternative would have earned. A company that repurchased shares through a decade of rising prices might have done better reinvesting, or might not have. The record supports a statement about realized returns and nothing stronger.
Sector base rates dominate the raw figures. Discretion over allocation varies enormously by business model, and comparing across that variation produces nonsense. The same January 2026 dataset makes the range visible. General utilities show a reinvestment rate of 172.30 percent against a return on capital of 5.99 percent. Tobacco shows 2.38 percent against 63.08 percent. A regulated utility funds an approved asset base and has little to decide. A business with almost no reinvestment need decides where nearly all of its cash goes. These are Damodaran's own industry groupings rather than a standard sector classification, and they are capital-weighted aggregates.
A third limit is technical and easy to miss. A ten-year window spans accounting changes that alter the lines being totaled. US filers adopted a new revenue standard in 2018. It changed the timing of revenue recognition for many contract types. That leaves the cash ledger alone, and it can still move operating profit in the base or final year of the outcome test. They adopted a new lease standard in 2019, which brought operating leases onto the balance sheet as a right-of-use asset and a matching liability. That change raised reported invested capital without changing the cash the company spends. It does not touch capital retained, because a right-of-use asset never passes through capital expenditure. It does distort any reported return on invested capital read across the transition. Record which basis each half of the decade sits on before comparing the ledger test against a reported return.
Continuity is the last limit, and the most easily overlooked. A ten-year record was made by whoever held the roles across those ten years. A chief executive appointed last year inherits the balance sheet and none of the record. Check the tenure before attributing the ledger to anyone currently in post.
None of this is a claim about individuals. The Investment Score groups 28 checks into valuation, financial strength and performance and scales the result to a 0 to 100 reading. Its published methodology is explicit on the boundary: the score is backward-looking and quantitative, and it does not capture management quality. An allocation ledger sits in the same territory. It documents outcomes, and it stops short of the verdict a reader may want it to deliver.
How to record an allocation ledger and use it
Store the record in nine lines. One ten-year total for each of the five uses. Then the capital retained. Then the incremental return that capital earned. Then the sector base rate you compared it against. And the tenure of the people who made the record. What to record in a valuation tracker lists the fields that sit around it. Writing the figures down with their filing years is what lets a future reader check the judgment rather than inherit it.
The record then does one job inside a valuation. Growth in a forecast has to be funded, and the funding comes from retained capital earning something. A decade of low incremental returns argues for a flatter projected growth path and a wider margin of safety. Both are choices the analyst makes rather than outputs the data delivers. In the InvestViable Valuator, the finding lands on inputs you set: the cash flow growth path first, then the discount rate and terminal growth rate. An allocation finding that changes none of those inputs has not been used.
Work in this order. Narrow the US universe on fundamentals with the InvestViable stock screener, or start from a slice of the Stock Universe such as quality stocks or dividend stocks. Pull ten years of cash flow statements on the survivors and build the ledger. Run the outcome test on the two or three that still stand. Then place the finding where it belongs in the five-step valuation workflow, which is inside the growth assumption rather than beside it.
The habit that makes the record worth keeping is the one that makes the rest of the process auditable. Ten years of statements take an afternoon to total. The totals frequently contradict the story the company tells about itself, and that gap is the finding.
InvestViable does not publish buy or sell recommendations on individual securities. All analysis is based on public financial data and a transparent methodology. The Investment Score formula is proprietary; the inputs and what the score evaluates are documented. The market and industry aggregates cited above are Aswath Damodaran's published figures for US industry groupings, with data as of January 2026. They describe groups of companies rather than any individual company. The two companies in the worked example are illustrative constructions used to demonstrate the arithmetic.