Introduction
Most market participants evaluate equity markets through an exclusively domestic lens, and they do not systematically compare multiples against the rest of the investable world. This narrow perspective causes market participants to overpay for future returns and overlook international developed markets, emerging markets, and small-cap segments that trade at meaningful discounts.
Context requires market participants to analyze the cyclically adjusted price-to-earnings ratio when they assess stock market valuation today. According to Morningstar, the CAPE ratio for the US market currently stands at approximately 33.9 versus the historical average of 24.8. Elevated multiples imply lower forward returns over the next decade.
Vanguard's recent research on small-cap and value stock valuations expands this analysis globally. A metric-driven framework shows exactly where relative value exists. This framework applies consistent metrics across geographies and reveals disparities large enough to affect portfolio outcomes.
Disclaimer: This article is educational only and not investment advice. It explains a repeatable assessment process, not market forecasts.
US large-cap stock market valuation today demands caution
Domestic large-cap equities trade at multiples that demand precision to assess forward return expectations. The S&P 500's elevated price-to-earnings ratio reflects heavy concentration in a handful of mega-cap technology companies rather than broad-based earnings growth.
Jeremy Grantham described the US market valuation as the second major aberration since 1925 because the first was the dot-com bubble of 2000. That comparison isn't casual. Both episodes share a defining trait where a narrow group of stocks pulls index-level multiples far above what underlying fundamentals support.
The degree of concentration reinforces this concern. Grantham noted that the Magnificent Seven accounted for roughly 80% of US corporate outperformance over the past 12 years. Without those names in the index, the remaining constituents look far more ordinary in their fundamental valuation. This distinction matters because investors who buy a domestic cap-weighted index do not make a diversified bet on American enterprise. These investors make a concentrated bet on a few companies that sustain exceptional earnings growth indefinitely.
Certainty about future earnings at these levels is hard to justify. A framework that focuses on the CAPE index and Shiller valuation helps quantify what elevated starting multiples historically imply about lower annualized returns over the subsequent decade. The market has less room to deliver above-average results when the entry price rises relative to smoothed earnings, and this reality prompts market participants to look for better values in other domestic segments.
Vanguard data proves domestic small-cap value potential
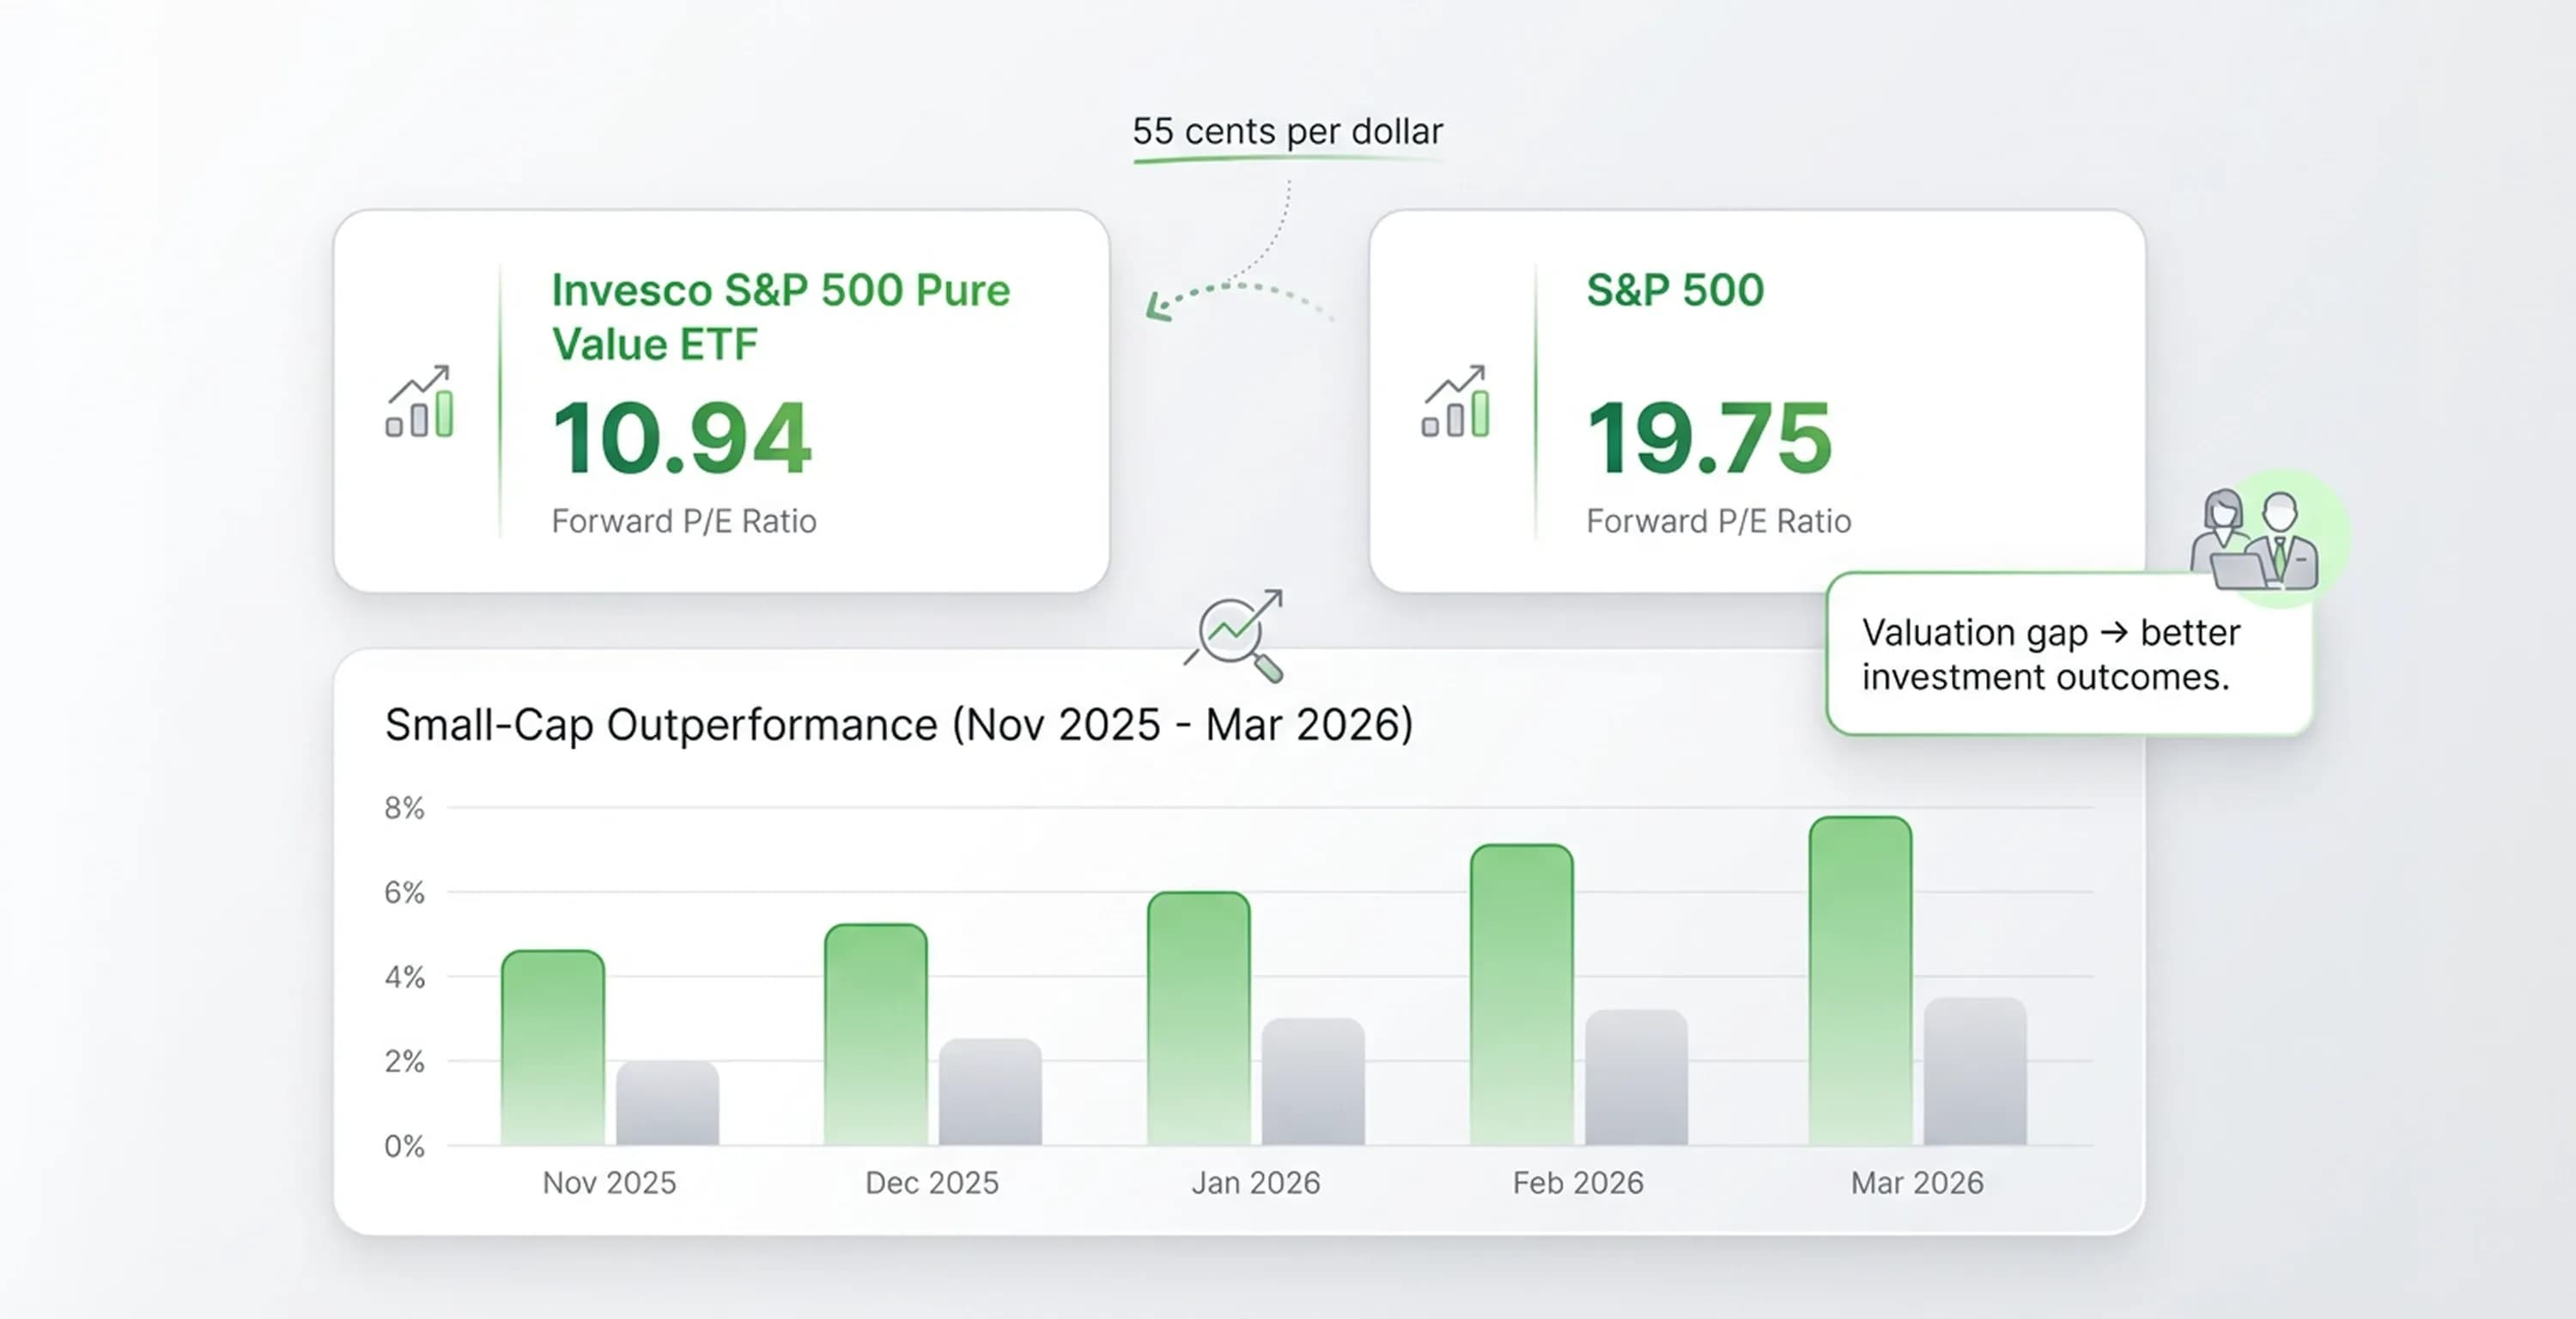
Domestic data alone builds confidence that cheaper segments produce better outcomes. The Invesco S&P 500 Pure Value ETF carries a forward P/E of 10.94, and this number sits well below the S&P 500's 19.75. That gap carries a significant weight. An investor who purchases the pure value basket pays roughly 55 cents for every dollar of forward earnings that the broad index commands. The discount represents a meaningful difference in what each invested dollar actually buys in underlying corporate profits.
Market behavior has started to reflect this disparity. Small-cap stocks outperformed large-cap technology names from November 2025 through early March 2026 because investors rotated away from the most expensive segments toward cheaper alternatives. These market rotations tend to accelerate once participants lose trust in the narrative that supports elevated multiples. These shifts do not require a recession or a crisis. A modest recalibration of growth expectations usually provides enough momentum.
Investors who learn how to calculate equity valuation will find that stock market valuation today looks different depending on where the analysis focuses. The same domestic market contains both overpriced and underpriced segments, and the difference shows up clearly when analysts apply the same stock valuation methods on companies in the same segments. The principle of valuation discipline identifies opportunities within a single market, and analysts find even more value when they apply this principle across global markets.
Consistent metrics reveal global equity discounts
The same framework that distinguishes cheap domestic segments from expensive ones works across borders. Analysts reveal clear global discounts when they compare stock market valuation today with consistent metrics. Research from the CFA Institute shows that international markets trade at roughly 15 times forward earnings versus 22 times for the US. That gap means an investor who purchases international equities acquires approximately 46% more earnings per dollar than the same dollar invested in domestic large-caps.
The soundness of this comparison requires analysts to apply identical metrics to each region rather than to cherry-pick favorable indicators. Analysts turn scattered regional commentary into a unified picture when they understand how to calculate equity valuation consistently with forward P/E, CAPE, dividend yield, and earnings yield. A fundamental analysis workflow for intrinsic stock value offers the structural backbone for this kind of market comparison.
The conviction behind geographic diversification grows stronger when analysts examine regional details. The following subsections examine European developed markets, Asia-Pacific equities, and emerging markets to show where the largest discounts concentrate and what drives them.
European developed markets assessment
European developed equities offer one of the clearest valuation discounts relative to their American counterparts. The MSCI Europe index trades at forward earnings multiples in the low-to-mid teens, and this range places it well below both its US equivalent and its own historical average during the post-2010 era. That spread reflects structural factors, such as slower headline gross domestic product growth and heavier weighting toward financials, industrials, and energy rather than technology.
However, these sectors generate substantial cash flows and pay higher dividends. The quality of those cash flows becomes apparent when analysts calculate the earnings yield. A forward P/E in the 13-14 range translates to an earnings yield above 7%, while the S&P 500 sits at roughly 4.5%. An assessment of equity value in earnings-yield terms clarifies the trade-off, because each dollar that goes into European equities currently purchases meaningfully more in annual profits. Market participants also find similar valuation disparities when they analyze Asia-Pacific equities.
Stock market assessment of Asia-Pacific equities
Asia-Pacific equities present a mixed but attractive landscape when analysts apply the same stock market assessment to them. Japan stands out as a market that undergoes a structural rerating. Corporate governance reforms, such as mandated improvements in capital efficiency and return on equity, have pushed Japanese companies to unwind cross-shareholdings and increase shareholder returns.
These governance changes reduce the Japan discount that persisted for decades. Forward P/E ratios for Japanese equities remain in the mid-teens, but improvements in capital allocation suggest these multiples could expand over time rather than contract. Broader Asia-Pacific markets outside Japan trade at similar or lower multiples, and current prices include a safety margin because earnings expectations already incorporate slower growth assumptions.
The combination of governance improvement in Japan and modest valuations across the region creates a statistically attractive entry point. However, market participants find the deepest discounts when they look beyond developed regions and evaluate emerging markets.
Emerging market opportunities
Emerging markets carry the deepest discount in the global equity landscape. The S&P 500 trades at a forward P/E of approximately 21.6, while the MSCI Emerging Markets index trades at roughly 13 times forward earnings. That 40% discount exists even though emerging economies contribute a growing share of global gross domestic product and corporate earnings growth.
The lower multiple partly reflects legitimate risks, such as currency volatility, political uncertainty, and weaker property rights in certain jurisdictions. These risks deserve acknowledgment. But the discount also embeds protection against those risks directly into the purchase price. The margin to absorb adverse outcomes widens considerably when an investor pays 13 times earnings instead of 21 times.
Emerging market companies do not need to match US growth rates to deliver competitive returns. They just need to avoid catastrophic outcomes and compound earnings from a much cheaper starting point. While these cheaper starting points look appealing, market participants must understand the structural reasons behind these lower valuations across different regions.
Structural valuation differences across regions
Lower multiples in non-US markets do not automatically signal opportunity. Market participants must distinguish genuine discounts from value traps by identifying why those multiples differ in the first place. A thorough stock market assessment accounts for the structural forces that compress or expand earnings multiples across geographies.
Several factors explain why regions carry persistently different valuations.
-
The sectoral composition of European indices weights heavily toward financials, industrials, and energy. These sectors historically trade at lower multiples than the technology companies that dominate US benchmarks.
-
Higher discount rates in emerging economies reduce the present value of future cash flows. This environment compresses headline P/E ratios even when growth prospects remain strong.
-
Emerging markets are projected to deliver 17% earnings growth from 2024 through 2026 versus 12% for the US market. This detail complicates the assumption that cheaper always means slower.
-
Political instability and weaker property rights in certain jurisdictions warrant a valuation discount. The size of that discount fluctuates and sometimes overshoots fair compensation.
Professionals learn how to calculate equity valuation within each region by adjusting for these structural drivers. They do not take headline multiples at face value. Cliff Asness offered a clarifying data point that showed the US victory over international markets is roughly 80% revaluation and only 15-20% earnings outperformance. Investors find no comfort in that distinction when they assume the US premium reflects permanent superiority.
Geographic diversification provides portfolio balance
Portfolio decisions require precision to match capital allocation to earnings yield across regions. Stock market valuation today varies enough across geographies that even modest rebalancing alters forward return expectations meaningfully. Research Affiliates forecasts 10-year US equity returns at just 1.0% annualized returns under valuation reversion scenarios. This forecast underscores how much starting price matters for future outcomes.
A quality stock market assessment produces actionable steps rather than abstract observations. The following process converts relative valuations into allocation decisions.
-
The process begins with calculating the earnings yield for each regional index by inverting the forward P/E ratio. Analysts then compare what a fixed dollar amount purchases in underlying profits across US large-cap, US small-cap, European, and emerging market equities.
-
The next step benchmarks current geographic weights against market capitalization. According to Morningstar, a balanced allocation based on global market caps would place 62.3% in US equities and 37.7% in international holdings. Most domestic-heavy portfolios significantly exceed this split on the US side.
-
Portfolios then tilt toward regions where the earnings yield exceeds domestic equivalents by a meaningful margin. These portfolios maintain enough domestic exposure to avoid concentrated country risk in the opposite direction.
-
Analysts revisit these calculations quarterly because multiples shift with earnings revisions, currency movements, and capital flows.
The arithmetic here is straightforward. An index that trades at 13 times forward earnings buys roughly $7,690 in annual corporate profits for a $100,000 capital allocation. That same $100,000 allocation in an index at 22 times earnings buys approximately $4,545. The gap compounds over a decade.
There is no need to abandon domestic exposure completely when allocating capital to markets where each dollar works harder. However, the strategy requires to acknowledge that concentration in the most expensive segment of the global market carries a measurable cost.
Conclusion
In summary, investors who rely on index-level valuation figures alone risk missing the full picture. Stock market valuation today shows that US large-caps trade at roughly 22 times forward earnings as a group but that aggregate number conceals meaningful dispersion underneath. Not every US-listed company is expensive. Reasonably priced, fundamentally strong businesses exist within the US market even when headline multiples look stretched, and the ability to identify them depends on the quality of your valuation process rather than the direction of the broader index.
That is where the research work actually happens. At the individual company level, not the index level. InvestViable's valuation tools lets you filter US-listed companies by valuation metrics so you can move beyond the headline multiple and identify where value genuinely exists today. If you want to go deeper on a specific company, you can set and test your own assumptions rather than accepting consensus estimates at face value.