
Treat goodwill and intangibles as four separate problems. First, find the purchase price allocation in the business combination note and read what was carved out as identifiable intangibles. Second, pull the amortization of acquired intangible assets and note which margins it sits inside. Third, read any impairment as a revision to the reporting unit's earlier fair value rather than as this year's operating result. Fourth, recompute book value, return on equity and the price-to-book multiple on both a reported and a tangible basis. The gap between the two bases is the size of the accounting, and it belongs in writing next to the valuation.
Where goodwill comes from, and why it is a residual
An acquirer that buys a business does not record the price as one line. Accounting requires the price to be pushed down onto the things acquired. The acquired company's assets and liabilities are restated to fair value, and identifiable intangible assets that the target never carried are recognized for the first time. Customer relationships, developed technology, order backlog, patents and trade names are the common categories. The excess of the price over that total is goodwill.
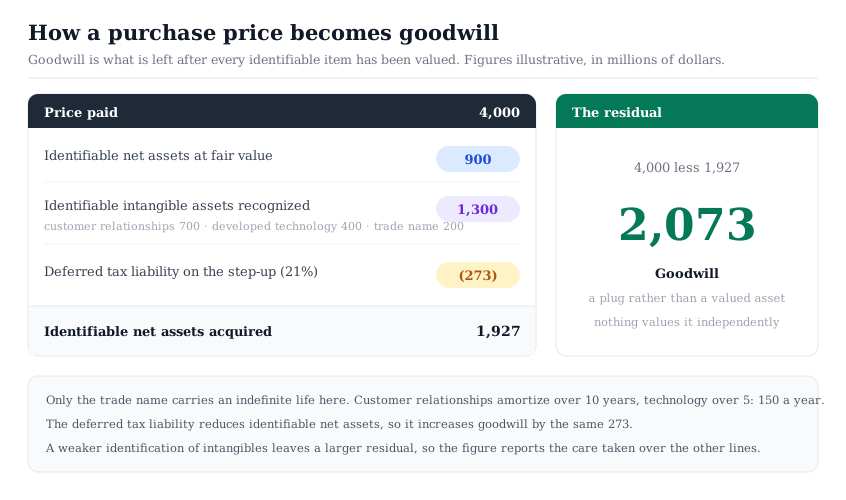
Take an illustrative acquirer that pays $4,000 million for a target. The target's other net assets come to $900 million at fair value, with book and tax bases assumed equal. A valuation specialist identifies $1,300 million of intangibles: $700 million of customer relationships, $400 million of developed technology, and a $200 million trade name. A deferred tax liability of $273 million arises on that step-up at a 21 percent rate, because the book basis rose and the tax basis did not. Identifiable net assets acquired are therefore $900 million plus $1,300 million less $273 million, or $1,927 million. Goodwill is $4,000 million less $1,927 million, which is $2,073 million.
Two features of that number matter. It is arithmetic rather than appraisal, so nobody valued goodwill and no separate analysis supports the figure. It also moves inversely with the care taken over the other lines. A weaker identification of intangibles leaves a larger residual, and so does a larger deferred tax liability. Damodaran's description of goodwill as a plug rather than an asset follows from exactly this construction. His objection is that one number absorbs growth assets, control, synergy and plain overpayment without distinguishing them.
What the filing shows and what the data feed leaves out
Regulation S-X sets the balance sheet captions a commercial or industrial registrant should present. Caption 15 of 17 CFR 210.5-02 covers intangible assets. It requires each class above five percent of total assets to be stated separately, with the basis of determining the amounts. Caption 16 covers accumulated depreciation and amortization of intangible assets, again on the face or in a note. Goodwill is not named as a caption anywhere in that list. Its separate presentation on the balance sheet is required by the accounting standards rather than by the Commission's caption rule. What varies by filer is the detail behind the other intangible classes.
The tagged facts are more consistent than the presentation. The elements to look for are Goodwill, GoodwillImpairmentLoss, FiniteLivedIntangibleAssetsNet, IndefiniteLivedIntangibleAssetsExcludingGoodwill and AmortizationOfIntangibleAssets. The acquisition-date carve-out is tagged again inside the business combination note, under its own set of elements. Locating any of them inside the document itself is part of reading a 10-K properly.
Any of these can also be pulled directly. The SEC's EDGAR application programming interfaces expose a company concept endpoint, whose shape is https://data.sec.gov/api/xbrl/companyconcept/CIK##########/us-gaap/Goodwill.json with the ten-digit central index key padded with leading zeros. The same page states the limit that matters here. The interfaces aggregate facts that use a non-custom taxonomy and apply to the entire filing entity.
That second condition is the trap. Goodwill is tested for impairment at the reporting unit level, but the footnote discloses it by reportable segment, with dimensional tags. Those facts are dimensionally qualified rather than entity-wide, so they fall outside the interface. An analyst who wants the segment split reads the inline XBRL view of the filing or the footnote itself. The general version of this problem, where a filed fact and a vendor field describe different things, is set out in why fundamentals differ by source.
Goodwill impairment analysis: what a write-down records
Goodwill impairment analysis starts with what the test actually compares. Since Accounting Standards Update 2017-04, the quantitative test is a single step. An entity may still run an optional qualitative assessment first, and reach the quantitative test only when that assessment suggests the unit may be impaired. The quantitative test compares the fair value of a reporting unit with that unit's carrying amount, including the goodwill allocated to it. Where the carrying amount is higher, the entity recognizes a charge for the difference. The charge cannot exceed the goodwill allocated to that reporting unit. The update eliminated the former second step, which required a hypothetical purchase price allocation to derive an implied goodwill figure. For a public business entity that is an SEC filer, it applies to fiscal years beginning after December 15, 2019.
That design has consequences beyond the arithmetic. The test runs at the reporting unit level rather than at the consolidated level. A company can therefore take a large charge inside one unit while the group as a whole trades far above its book value. And the charge is capped, so the write-down measures the smaller of two things: the shortfall, or the goodwill that happened to be sitting there.
The fair value in that comparison is an estimate, and it is audited as one. PCAOB AS 2501 states at paragraph .02 that a fair value measurement is a form of accounting estimate. Paragraph .07 gives the auditor three approaches: test the company's process, develop an independent expectation, or evaluate evidence from later events and transactions. The standard also requires the auditor to evaluate potential management bias in the significant assumptions. Discount rates, forecast revenue growth and terminal assumptions are exactly the inputs a reader of the impairment note should extract.
What a write-down does not record is a change in this year's operations. It is non-cash. It reaches the cash flow statement only as an add-back, and the deterioration it acknowledges usually happened earlier. Damodaran's reading of the evidence, in the same post, is that accounting impairment lags economic impairment by years. Treating the announcement as new information about the business is the common error.
Amortization of acquired intangible assets and the margins that carry it
Acquired intangible assets with finite lives are amortized, and the charge runs through the income statement for as long as the life assigned to them. Customer relationships of $700 million over ten years give $70 million a year. Developed technology of $400 million over five years gives $80 million. The total is $150 million a year. The $200 million trade name is assigned an indefinite life here, so it is not amortized and is tested for impairment instead.
That $150 million sits inside operating income, which is the first place comparability breaks. Suppose the acquirer reports $6,000 million of revenue and $700 million of operating income after the charge. Adding the amortization back gives $850 million. Operating margin reads 11.7 percent on the first basis and 14.2 percent on the second. The spread is 250 basis points, which is a relative difference of 21.4 percent on the margin itself.
Which multiple you use decides whether you inherit that spread. EBITDA already excludes amortization, so an EV/EBITDA multiple is untouched by this particular choice. EBIT, net income and earnings per share all carry it. For an acquisitive company, an EV/EBITDA comparison is therefore the one this choice cannot distort.
Both treatments of that charge are defensible, and the failure mode is mixing them. Companies usually publish an adjusted figure that removes the amortization, on the argument that the cash was spent once. The case against is that a company acquiring continuously spends that cash repeatedly. The charge is the only place the income statement records it. What is not defensible is comparing one company's adjusted margin with another's reported margin, which is the error that standardized screens make easy. The broader habit of testing whether a reported margin is backed by cash belongs to earnings quality work. Where two sources show different operating margins for the same acquisitive issuer, the mapping of this charge is one of the first places to look.
The measures a write-down moves, and the ones it does not
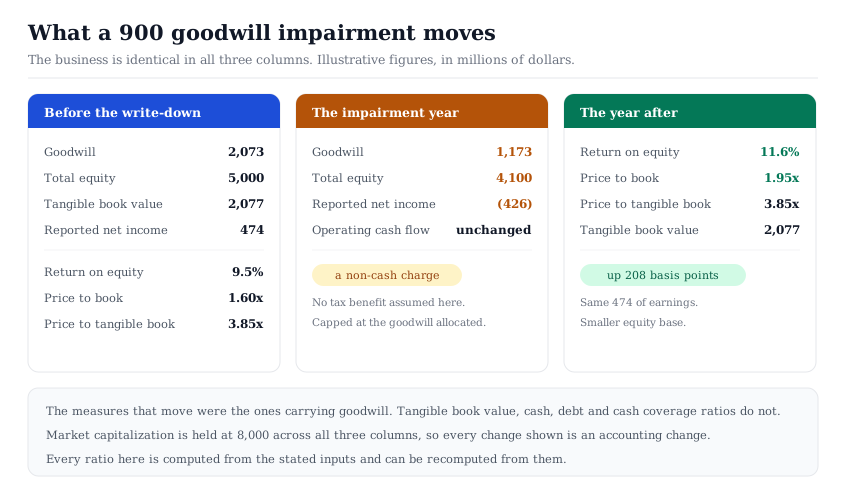
Carry the same issuer forward. Total equity is $5,000 million, goodwill is $2,073 million, and net intangibles are $850 million after three years of amortization. Tangible book value is therefore $2,077 million. At a market capitalization of $8,000 million, price to book reads 1.60 times and price to tangible book reads 3.85 times. Reported earnings are $474 million, which is $600 million of pre-tax income less tax at 21 percent, so return on equity is 9.5 percent.
Now impair $900 million of the goodwill, and assume the year's $474 million of pre-impairment earnings is paid out in full, so the charge is the only movement in equity. Goodwill falls to $1,173 million and total equity falls to $4,100 million. The impairment year reports a net loss of $426 million, on the convention that no tax benefit arises because the goodwill is not tax-deductible. Operating cash flow is unchanged, because nothing was paid.
The year after is where the distortion shows. Hold earnings, intangibles and market capitalization constant, so that the write-off is the only change. On the same $474 million of earnings, return on equity now reads 11.6 percent rather than 9.5 percent. The improvement of 208 basis points, computed on unrounded figures, comes entirely from a smaller denominator. Price to book rises from 1.60 times to 1.95 times at an unchanged market capitalization. Price to tangible book does not move at all, because tangible book value excluded the goodwill in both periods.
That is the practical test. A measure that moves when goodwill is written off was carrying goodwill, and a measure that does not move was already clean. Return on equity, return on assets, price to book and the equity-to-assets ratio all move. Tangible book value, cash, debt and every cash-based coverage ratio do not. When price to book is informative at all is a separate question, and the answer turns partly on how much of the book is goodwill.
Return on invested capital sits on its own, because there the choice is deliberate rather than accidental. Including goodwill measures the return on the full price paid, and excluding it measures the return on the operating assets, and both answer real questions. That boundary is worked properly in ROIC versus ROE versus ROA.
How to reconstruct the line yourself
The work below needs doing once per company, and then updating each year.
- Find the business combination note in the annual report. It carries the purchase price allocation: consideration transferred, the fair value assigned to each class of identifiable intangible, and the residual goodwill. Record the split.
- Split the intangibles by life. The intangible assets note gives gross carrying amount, accumulated amortization and the weighted-average amortization period for each finite-lived class, and lists the indefinite-lived ones separately.
- Pull the annual amortization of acquired intangibles and find where it sits. A company reporting it inside cost of revenue produces a different gross margin from one reporting it in operating expenses, on identical economics.
- Read the impairment history over five years or longer. Note the reporting unit, the charge, and the assumptions disclosed in the goodwill note. A discount rate or growth rate that changes between years is the disclosure carrying the most information.
- Recompute book value, return on equity and price to book on both a reported and a tangible basis. Record which basis you are adopting, and why.
Step five is the one that gets skipped. An analyst who writes down the basis can defend the ratio six months later, and one who does not is quoting a number whose construction has been forgotten. The same discipline applied across a full set of fundamentals is the fundamental analysis checklist. The archive-level questions behind it, including point-in-time integrity and restatement handling, sit in stock market database design.
Where this sits in the workflow
Goodwill and intangibles belong to the verification stage rather than the modeling stage. The corrections happen before a number reaches a multiple, not after.
Three things carry forward. The amortization of acquired intangibles decides whether the earnings base is reported or adjusted, and that choice has to hold on both sides of any comparison. The goodwill balance decides whether book-value multiples mean anything for the company. The impairment history tells you how a management team has valued its own acquisitions, which is a capital allocation question rather than an accounting one. The cash side of the same record, covering repurchases and insider transactions, is read in buybacks and insider activity.
None of it changes a discounted cash flow directly. A model built in the InvestViable Valuator takes a cash flow growth path, a discount rate and a terminal growth rate. Amortization of acquired intangibles enters none of the three. What goodwill and intangibles change is the sanity check around the model, and specifically the multiples used to bracket its output. The InvestViable stock screener works across US equities on reported fundamentals. The Stock Universe pages, such as quality stocks, cover slices of that same universe. A threshold set on return on equity inherits whatever the goodwill balance is doing to the denominator. A screen therefore belongs upstream of a decision rather than at the end of one.
The reported and tangible bases will disagree for a company carrying goodwill from past acquisitions, and the size of that disagreement is the finding. Averaging the two produces a figure that describes neither. Record both, name the one you are using, and the next reader of the file can check it.
InvestViable does not publish buy or sell recommendations on individual securities. All analysis is based on public financial data and a transparent methodology. The Investment Score formula is proprietary; the inputs and what the score evaluates are documented.