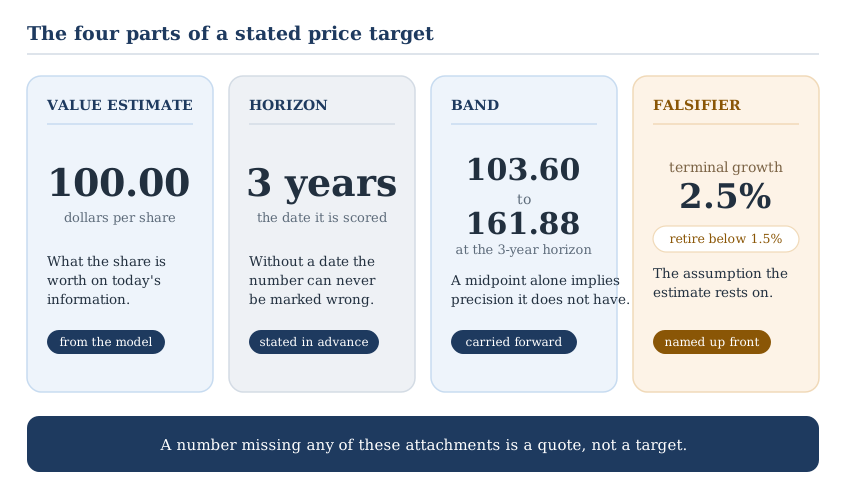
To set a price target for a stock, start from a fair value estimate and attach four things to it. Compound the estimate forward at the discount rate that produced it, to a horizon you state before the fact. Carry the bear and bull cases forward on the same arithmetic, so the target arrives as a band. Then name the single assumption the estimate is most sensitive to, and write the level at which that assumption would retire the target. The estimate is the valuation work. The horizon, the band and the falsifier are what turn it into a target.
How to set a price target for a stock in four parts
The word target does most of the damage here. It suggests a destination the price is traveling toward, which is not what the arithmetic produces. What the arithmetic produces is a conditional statement: if these assumptions hold, the share is worth this much, and by this date.
Writing it as four separate parts keeps the conditional visible.
Price target
A fair value estimate carried to a stated horizon, expressed as a band, with the assumption that would retire it named in advance.
The value estimate comes first and carries the real work. Building it is the subject of the stock valuation methods and DCF guide, and nothing in this article improves an estimate that was weak to begin with. The three parts that follow are cheap to add and easy to leave out.
A target missing the horizon cannot be scored. A target missing the band implies a precision the model does not have. A target missing the falsifier cannot be retired, so it tends to survive on inertia long after the case for it has gone.
Why today's fair value is not the target
The most common shortcut is to publish today's fair value estimate as the target. It is close enough to feel harmless, and it quietly discards the horizon.
If a share is worth 100.00 today, it is not worth 100.00 in three years. A business that retains its cash is worth more later, by construction. With nothing distributed, this year's estimate rolls forward at the rate used to discount it. Retention does not create that increase. No cash has left the business, so the same forecast is simply three years nearer.
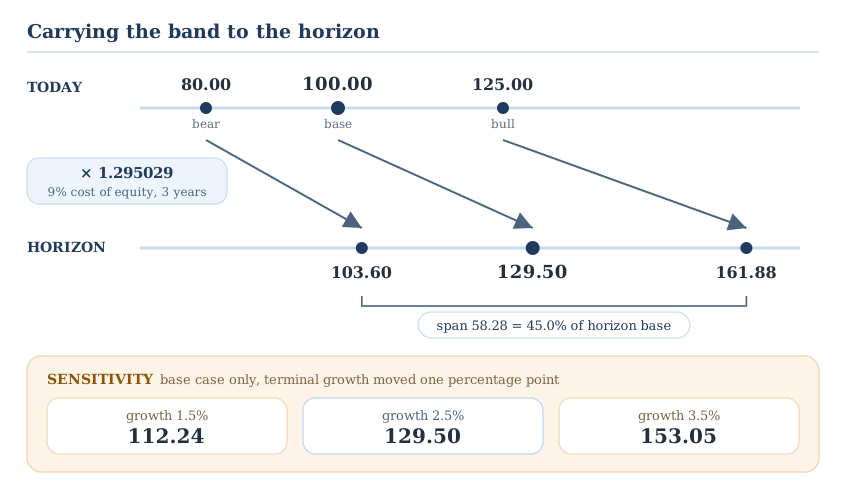
Carrying it forward is one line of arithmetic. This is an equity-side estimate, so the rate is the cost of equity and the cash flows are the ones available to shareholders. If your model is enterprise-side instead, free cash flow to the firm discounted at a weighted average cost of capital, do not compound the per-share equity figure at that rate. Roll the enterprise value forward and re-subtract forecast net debt at the horizon, or convert to an equity-side estimate first. At a 9 percent cost of equity over three years, 1.09 cubed is 1.295029, so a base case of 100.00 becomes 129.50 per share. That figure, paired with its date, is the target. Compounding at the cost of equity is the time and risk adjustment run in reverse. Discounting brought future value back to today; compounding carries today's value out to the horizon. It moves the number up, not down.
Choose the horizon, and name the convergence it assumes
One assumption is doing quiet work here. Compounding produces the path of intrinsic value, not the path of price. The figure becomes a price target only if the market closes the gap between the two by the horizon date. That is a claim about the market rather than about the business, and it has no filing behind it. It is also the assumption most likely to fail, which is why it belongs beside the number and named.
Choosing the horizon is not a matter of habit. Use the one your model already assumes. A discounted cash flow has no natural horizon of its own. It values cash flows in perpetuity, and the explicit forecast window is a modeling convenience. Choose the horizon as a judgment about how long you are willing to wait for price and value to meet, then state it. Shortening it to twelve months out of habit reports a fraction of that wait as though it were the whole. The twelve-month convention common in published targets is a reporting cycle, not a valuation result. The three years used here is that judgment made explicit, nothing more.
The convention matters more than the arithmetic, so state it. The compounding form above assumes cash is retained inside the business. Where cash is paid out as dividends, the per-share value compounds at the discount rate less the payout measured against value per share. That is not the quoted dividend yield, which is measured against price. On a stock trading below your estimate the quoted figure is the larger of the two, so substituting it understates the target. Buybacks are different again. A repurchase made at intrinsic value distributes cash without reducing per-share value, so it does not belong in this adjustment. The dividends then arrive separately rather than being folded into the target. Report a retained-cash target on a company that pays most of its earnings out and the per-share figure is overstated, while the return that actually reached the holder is hidden.
The discount rate doing the compounding is the one that produced the estimate. Building it from a risk-free rate and an equity risk premium is covered in the DCF discount rate guide. Its two largest components have primary sources: the ten-year constant-maturity Treasury series DGS10 on FRED, and Aswath Damodaran's implied equity risk premium series.
Carry the whole band forward, not the midpoint
A single number carried forward is still a single number. If the estimate was honest, it was a range before the compounding and it stays a range after it.
Take an illustrative bear case of 80.00, a base of 100.00 and a bull of 125.00 per share. At the same 9 percent rate over the same three years, each case is multiplied by 1.295029. The bear becomes 103.60, the base becomes 129.50, and the bull becomes 161.88.
The band at the horizon runs from 103.60 to 161.88. That span is 58.28 wide, which is 45.0 percent of the base case at the horizon. The width is not a defect in the work. It states how widely the cases were drawn, and it is not a confidence interval. Carrying all three forward on one factor leaves the relative width unchanged. It also holds the discount rate fixed across the three cases. Where that rate is genuinely uncertain, the band at the horizon is narrower than an honest one.
Constructing that bear-to-bull span is its own discipline, treated in valuation ranges for fundamental analysis. What matters at this step is that the span widens by the same factor as the cases themselves. Its width relative to the base case is unchanged at 45.0 percent, today and at the horizon alike. Reporting the midpoint alone converts an honest range into false precision, and it does so at the exact moment the number gets written down and remembered.
Name the assumption that would retire the target
The falsifier separates a target from an opinion. Most estimates rest disproportionately on one or two inputs. In a single-stage model with the capitalized cash flow held fixed, a point of discount rate and a point of terminal growth move value by the same magnitude. They move it in opposite directions. That equivalence breaks in a multi-stage model, where the discount rate touches every forecast year and growth touches only the terminal value. Run the one-way sensitivity test on both before deciding which one the target rests on. The ranking depends on how wide a band each input plausibly spans.
Take terminal growth on the illustrative base case. The capitalization factor turns next year's normalized cash flow into a value: 1 divided by the discount rate less the growth rate. At a 9 percent discount rate and 2.5 percent terminal growth, that is 1 divided by 0.065, or 15.38 times. Starting from the current year's figure instead calls for 1 plus g over the same denominator. That is 15.77 times here, and every percentage below shifts with it. Move growth down a point and the factor falls to 13.33 times, which is 13.3 percent lower. Move it up a point and it rises to 18.18 times, or 18.2 percent higher.
Applied to a base case of 100.00, the estimate becomes 86.67 or 118.18. Carried three years forward at the same rate, those become 112.24 and 153.05. This is a different exercise from the band above. The bear and bull cases flex the whole cash-flow path, while this test holds everything else at the base case and moves one input.
One caveat carries these figures outside the example. Scaling the whole estimate this way assumes it is a capitalized perpetuity. Where a model has an explicit forecast period, terminal growth moves only the terminal value, so scale the effect by that value's share of the total. At a 70 percent terminal share, a one-point cut takes roughly 9 percent off the estimate rather than 13.3 percent.
On these illustrative bands the target is not a claim about price. It is a claim about terminal growth holding near 2.5 percent. Writing that sentence down is the exercise. It converts the target into something with a stated failure condition. In this example that level is 1.5 percent terminal growth. Set yours where the decision changes rather than at a round number. Use the growth rate at which the base case falls to the current price, or to your required-discount ceiling. Two constraints travel with it: growth must stay below the discount rate, and it must be nominal if the rate is nominal. The test is also not symmetric, because the capitalization factor is convex in growth, which is why the upside point is worth more than the downside point costs.
Which input deserves that treatment varies by business. The DCF inputs checklist gets each input trustworthy enough to test.
A target and a purchase price are different numbers
Two numbers fall out of the same estimate, and they are routinely conflated.
The maximum purchase price is an entry number. It applies a required discount to the bear case and returns the most you can pay today. Using the bear case and a required discount together stacks two layers of conservatism, which is a choice worth stating rather than assuming. On the illustrative figures, a 30 percent required discount against the 80.00 bear case gives 80.00 times 0.70, or 56.00 per share. The arithmetic and its failure modes are covered in full in how to calculate margin of safety.
The price target is a review number. It says what a share is worth at the horizon if the model holds, which is 129.50 on the same figures. It is what the position is worth only if price has met value by then.
They are not competing estimates and neither one is the "real" answer. The purchase price governs whether a position starts. The target governs whether the thesis is still working when you check it. A margin of safety says nothing about when to exit, and a target says nothing about what price is safe to pay, which is precisely why both get written down.
Reading someone else's published target is a different exercise again, with its own biases and incentives, handled in deconstructing analyst stock targets.
When a target should move, and when it should not
A target built the way described above has three legitimate reasons to change that belong to the model.
- A new filing changes an observed input. Fresh figures from the latest annual or quarterly report on SEC EDGAR feed the model and the estimate moves with them. This is the ordinary case, and it should happen on a schedule rather than on impulse.
- A rate input moves materially. The discount rate is built from market data, so it drifts. A changed discount rate changes both the estimate and the compounding, which is why the two should be recomputed together rather than patched separately.
- The named assumption breaks. This is the falsifier firing. The target is retired and the work is redone from the input that broke, not adjusted at the edges to preserve the old conclusion.
Two housekeeping reasons sit alongside those three: the horizon arriving, which calls for a new target rather than a carried one, and an error you find in your own work.
Price movement is not on that list. A share falling 20 percent tells you about the market's view, not about the cash the business will produce. Revising a target downward after a decline, with no input change to point at, is anchoring dressed as analysis. The CFA Institute's treatment of individual behavioral biases groups anchoring with the information-processing biases. Those sit under the cognitive errors. The reading says that category is more easily corrected for, because it stems from faulty reasoning rather than an emotional predisposition.
The discipline is easier to hold when the previous inputs are written down where you can see them. A documented stock valuation report carries the estimate and its assumptions at one date. A valuation tracker keeps the observed inputs separate from the assumed ones across dates. That separation is what lets you say later whether the filings moved or you did.
Where this fits in your workflow
The sequence is short and it runs in one direction. Estimate value as a bear-to-bull range from primary filings. Apply a required discount to the bear case to get the highest price worth paying. Compound the same three cases forward at the discount rate to the horizon you have chosen, and record the band. Name the assumption carrying the most weight and the level at which it retires the target. Then leave the number alone until an input changes.
Keeping the estimate itself auditable is where tooling helps. The InvestViable Valuator keeps the discounted cash flow's inputs on the surface and under your control: the cash flow growth path, the discount rate, and the terminal growth rate. Two of those are the inputs the compounding and the sensitivity test above operate on. An estimate you can interrogate is worth more than a tidier one you cannot. For a starting anchor across the market, the stock screener narrows the US universe on fundamentals and carries the Investment Score.
What the four attachments buy is a number that can be marked right or wrong later, which is the only kind of target worth setting.
InvestViable does not publish buy or sell recommendations on individual securities. All analysis is based on public financial data and a transparent methodology. The Investment Score formula is proprietary; the inputs and what the score evaluates are documented. All figures in this article are illustrative and are used to demonstrate the arithmetic, not as a view on any specific stock.