
Compute the degree of operating leverage for each pair of fiscal years, on operating income cleaned of one-off charges. Skip years when revenue barely moved. Cross-check the result against the expense lines that do not scale with volume: depreciation, research and development, and most overhead. Keep it separate from financial leverage, which works below operating income. Then use the reading to set the width of forecast scenarios, not to predict a single figure.
What does operating leverage measure?
Operating leverage measures the sensitivity of operating profit to sales. It does not measure how high a margin is. Two companies can earn the same margin today and still respond very differently to the same change in demand.
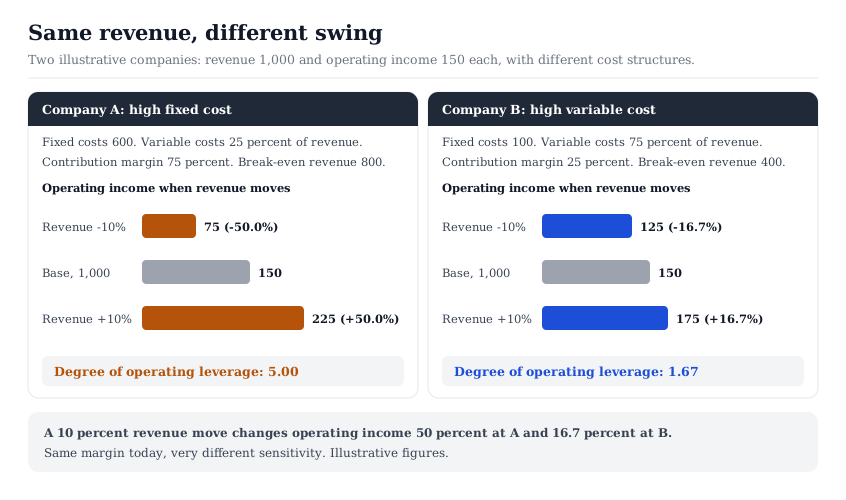
Take two illustrative companies, each with revenue of 1,000 and operating income of 150. Company A carries fixed costs of 600, and its variable costs run at 25 percent of revenue. Company B carries fixed costs of 100, with variable costs at 75 percent. Both report a 15 percent operating margin.
Now raise revenue by 10 percent, to 1,100. Company A's costs become 600 plus 275, so operating income rises to 225, up 50 percent. Company B's costs become 100 plus 825, so operating income rises to 175, up 16.7 percent. Cut revenue by 10 percent instead and the moves reverse: A falls to 75 and B to 125.
The difference is the contribution margin, the share of each sales dollar left after variable costs. It is 75 percent at A and 25 percent at B. Dividing total contribution by operating income gives the degree of operating leverage at that revenue level. For A it is 750 divided by 150, or 5.0. For B it is 250 divided by 150, or 1.67.
The same number has a second reading. It equals one divided by the distance to break-even, measured as a share of revenue. Company A breaks even at revenue of 800, which is 20 percent below today's level, and one divided by 0.2 is 5.0. Company B breaks even at 400, 60 percent below, which gives 1.67. A company close to its break-even point carries high operating leverage almost by definition.
The five-step safety checklist screens for margin erosion. Operating leverage answers a separate question: how far the margin moves when revenue does.
How do you calculate the degree of operating leverage?
Outside the company, the contribution margin is not observable. The practical measure therefore works from reported results across pairs of years.
Degree of operating leverage = % change in operating income ÷ % change in revenue
where both changes are measured between the same two fiscal years, and operating income is taken on a consistent basis in both years.
Aswath Damodaran's paper on estimating risk parameters gives the same approximation. It notes that operating leverage is hard to measure from outside a company, because income statements aggregate fixed and variable costs. Measuring the response of operating income to sales is the workaround.
A named example shows the arithmetic on filed data. The figures below are Texas Instruments', taken from its annual reports on Form 10-K for fiscal 2025 and fiscal 2023. They are dated, filed figures used to demonstrate the arithmetic. Nothing below is a valuation of that company or a view on its shares. Outputs are estimates based on user-controlled assumptions, and nothing on the platform is a buy or sell recommendation.
Revenue and operating profit, in millions, for fiscal years ended December 31:
- 2021 to 2022. Revenue rose from $18,344 to $20,028, up 9.18 percent. Operating profit rose from $8,960 to $10,140, up 13.17 percent. The ratio is 1.43.
- 2022 to 2023. Revenue fell to $17,519, down 12.53 percent. Operating profit fell to $7,331, down 27.70 percent. The ratio is 2.21.
- 2023 to 2024. Revenue fell to $15,641, down 10.72 percent. Operating profit fell to $5,465, down 25.45 percent. The ratio is 2.37.
- 2024 to 2025. Revenue rose to $17,682, up 13.05 percent. Operating profit rose to $6,023, up 10.21 percent. The ratio is 0.78.
The two down years read close together, at 2.21 and 2.37. The up years read lower, and the most recent one is below 1.0. In its fiscal 2025 risk factors, the company states that "a significant portion of our operating costs is fixed." Both readings come from the same company. The sections below show why one ratio cannot settle the question, and which filing lines explain the spread.
How do you estimate fixed and variable costs when no line says "fixed"?
Treat the ratio as a hypothesis and test it against the cost lines. Three reads do most of the work.
Classify the expense lines. Depreciation and amortization do not fall when volume falls. Most research and development is a committed team, and most general and administrative cost is headcount and premises. Materials, freight, sales commissions and outsourced manufacturing tend to scale with units. Cost of revenue usually mixes both kinds, which is why it cannot be classified whole. The section map for reading a 10-K shows where the cash flow statement and expense notes sit.
Compute the incremental margin. Divide the change in operating income by the change in revenue between two years. If the cost base held still, this estimates the contribution margin. In the illustrative pair it returns 75 percent for Company A and 25 percent for Company B. When it exceeds 100 percent, total costs moved against revenue, rising while revenue fell or falling while revenue rose, so the base itself moved.
Read the MD&A. SEC Regulation S-K Item 303 requires management to describe unusual events that materially affected income. It also requires known trends likely to affect revenue or income. Where revenue changed materially, the discussion has to say how much came from price and how much from volume. That split matters, because a price increase carries almost no extra cost, while extra volume brings variable cost with it.
The filed data shows why the cross-check matters. Texas Instruments' depreciation, from its cash flow statements, rose from $925 million in 2022 to $1,918 million in 2025. That is 4.6 percent of revenue in 2022 and 10.8 percent in 2025. Total costs, revenue minus operating profit, were $9,888 million in 2022 and $10,176 million in 2024. They rose while revenue fell 21.9 percent. The incremental margin across those two years is 106.6 percent. The cost base did not just stay put; it grew.
Operating leverage vs financial leverage: two amplifiers, one income statement
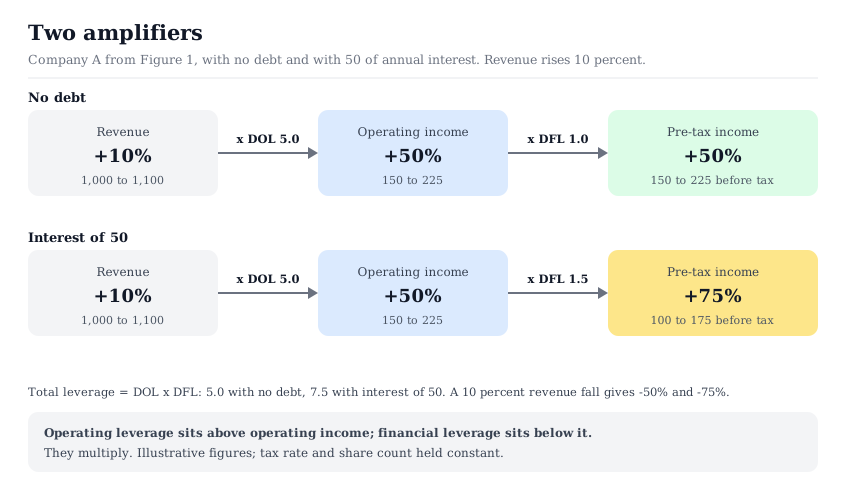
Operating leverage works between revenue and operating income. Financial leverage works between operating income and pre-tax income, through fixed interest charges. The two multiply.
Degree of financial leverage = operating income ÷ (operating income − interest expense)
and total leverage = degree of operating leverage × degree of financial leverage. Tax rate and share count are held constant, so pre-tax income and earnings per share move by the same percentage.
Give Company A annual interest of 50. Pre-tax income at the base is 100, and the degree of financial leverage is 150 divided by 100, or 1.5. Total leverage is 5.0 times 1.5, or 7.5. A 10 percent revenue increase lifts operating income from 150 to 225 and pre-tax income from 100 to 175, up 75 percent. A 10 percent decrease cuts pre-tax income from 100 to 25, down 75 percent. Without the debt, both moves stop at 50 percent.
The two amplifiers are covered in separate articles. ROIC vs ROE vs ROA treats financial leverage through the DuPont identity, as an equity multiplier on return levels. How to analyze company debt covers the balance-sheet side: coverage, covenants and the maturity ladder. This article owns the cost structure above operating income. Read together, the three describe total leverage.
Filed figures make the split visible. Between 2023 and 2024, Texas Instruments' operating profit fell 25.45 percent. Diluted earnings per share fell from $7.07 to $5.20, or 26.45 percent. On those figures the amplifier below operating income was about 1.04. Other income, interest and taxes all moved in that year. Nearly all of the swing still came from the cost structure.
Why does operating leverage make a forecast fragile?
A forecast error in revenue does not stay the same size on its way down the income statement. It gets multiplied.
Suppose the revenue forecast for next year is 5 percent too high. At Company A, with a reading of 5.0, operating income comes in about 25 percent below the forecast. At Company B, with 1.67, the miss is about 8.3 percent. Same revenue error, three times the profit error. With interest of 50 on top, Company A's pre-tax miss reaches 37.5 percent.
Margins move with it. At a 10 percent revenue increase, Company A's operating margin rises from 15 percent to 20.5 percent, or 225 over 1,100. At a 10 percent decrease it falls to 8.3 percent, or 75 over 900. Company B moves only from 13.9 to 15.9 percent across the same range. A forecast that assumes a stable margin for Company A assumes revenue will not move.
The linear model is also a simplification. Fixed costs are fixed only inside a range. Past a capacity limit, more volume needs a new plant or a new team, and the cost base steps up. Below a certain level, management cuts the base through closures and layoffs, often with restructuring charges attached. The degree of operating leverage describes the response near today's revenue, not across every possible outcome.
That is why sensitivity work matters more for high-leverage businesses. Valuation sensitivity analysis shows how to flex one input at a time and read the result. For a high fixed-cost business, revenue is the input to flex first.
Where does operating leverage enter a valuation?
It enters in three places: the margin path, the scenarios and the discount rate. Each needs a different treatment.
The margin path. A forecast that applies a constant margin to every revenue scenario implies a degree of operating leverage of exactly 1.0. Check what a forecast implies by dividing its projected operating income growth by its projected revenue growth. If the business has historically read 2.0 and the forecast implies 1.0, the forecast has quietly assumed a cost structure change.
The scenarios. Build the downside case by cutting revenue and holding the estimated fixed costs where they are. Do not simply trim the margin by a round number. The cost structure, not the analyst's mood, should set how far the margin falls. Upside cases need a capacity check, since fixed costs step up once volume outgrows the existing base.
The discount rate. Damodaran's paper names operating leverage as one of three determinants of beta, alongside the type of business and financial leverage. Mandelker and Rhee's 1984 study in the Journal of Financial and Quantitative Analysis examined both degrees of leverage as drivers of systematic risk. In a bottom-up beta, the industry unlevered beta already carries the industry's typical cost structure. Relevering then adds the financial layer. Building a cost of equity from a bottom-up beta walks through that construction. An extra premium for high fixed costs on top of it charges part of the same risk twice.
The InvestViable Valuator runs a DCF on inputs the analyst sets: the cash flow growth path, the discount rate and the terminal growth rate. Operating leverage is not a separate setting. It reaches the model through the growth path, so build each scenario's profit path first and translate it into cash flow growth.
When does the degree of operating leverage mislead?
The ratio is only as stable as its inputs. Five situations break it.
Flat revenue years. Revenue growth is the denominator. Take a year in which revenue rises 0.5 percent and operating income rises 4 percent: the ratio is 8.0. Nothing about the cost base changed; the denominator was simply close to zero. Treat years with revenue moves under a few percent as missing data.
One-off charges. Restructuring costs, impairments and gains distort operating income in a single year. Texas Instruments reported a $124 million credit in its restructuring and other line in 2024, and a $117 million charge in 2025. Before that line, operating profit was $5,341 million in 2024 and $6,140 million in 2025. On that basis the 2025 ratio is 1.15, not 0.78, and the 2024 ratio is 2.53, not 2.37. The same line carried a $257 million charge in 2022, for preproduction costs at the Lehi, Utah, factory, and 2021 carried $196 million of acquisition and restructuring charges. Cleaned, the 2022 and 2023 ratios are 1.48 and 2.35. Earnings quality red flags covers how recurring "one-off" items should be treated.
A moving cost base. A company adding capacity raises its fixed costs while revenue grows. The ratio measured on the way up then understates the leverage that will apply on the way down. The depreciation step-up in the Texas Instruments filings is that pattern in reported figures: $410 million more in 2025 than in 2024.
Mix shifts. When a high-margin segment grows faster than a low-margin one, operating income outpaces revenue with no cost-structure change at all. Segment disclosures separate the two effects.
Price versus volume. A price increase drops almost entirely to operating income; a volume increase brings variable cost with it. Two years with the same revenue growth can therefore show very different ratios.
Cyclical companies add a further layer, since the position in the cycle sets which part of the range applies. Normalizing earnings for cyclical stocks treats operating leverage as the reason cyclical earnings swing, and then normalizes the result. This article measures the amplifier itself, for any company.
How to apply operating leverage analysis
Run the work in a fixed order, so each estimate can be checked against the filings later.
- Pull five or more years of revenue and operating income from the annual reports, and note any restructuring, impairment or acquisition lines.
- Compute the ratio for each pair of years, on reported and on cleaned operating income. Drop pairs where revenue moved less than a few percent.
- Cross-check the cost base. Track depreciation, research and development, and overhead as a share of revenue, and compute incremental margins between years.
- Read the MD&A for the price and volume split and for capacity changes that move the fixed base.
- Carry the result into scenarios. Flex revenue, hold the estimated fixed costs, and record the margin each scenario produces.
- Write down the reading and its basis, including the years used and the charges removed.
Operating leverage is also a useful line in a head-to-head comparison of two stocks. Two companies with the same margin can carry very different exposure to the same revenue miss.
Semiconductor makers and industrial manufacturers tend to carry heavy plant and depreciation. The semiconductor slice of the Stock Universe and the industrials sector in the Stock Universe give a wide set of filings to test the ratio on. To narrow a list on fundamentals and the Investment Score first, the InvestViable stock screener covers 3,000+ US stocks. The inputs to the ratio itself come from the annual reports, which SEC EDGAR makes searchable.
InvestViable does not publish buy or sell recommendations on individual securities. All analysis is based on public financial data and a transparent methodology. The Investment Score formula is proprietary; the inputs and what the score evaluates are documented. The company named above appears only as the source of filed figures used to demonstrate the arithmetic. No valuation of that company is performed or implied, and Companies A and B are illustrative.