
A head-to-head stock comparison has three moves. First, make the two comparable: pull both from one data source, price both on one date, and align the periods and definitions. Second, compare like with like across five dimensions: business quality, financial strength, earnings quality, growth durability, and valuation, without tallying the dimension wins into a score. Third, run the same price test on each name: the discount to its own valuation range, measured against its own required margin of safety. Choose between the candidates only after each has passed or failed on its own terms.
What a fair comparison of two stocks requires
A head-to-head answers a narrower question than most research does: with two candidates and one slot of capital, which name earns it? The relative frame is also the hazard. A single-name analysis must defend its conclusion against the evidence. A comparison can hide from the evidence by leaning on the other stock, and a mediocre case starts to look strong next to a weaker one.
Head-to-head comparison
The structured evaluation of two individually vetted stocks competing for the same capital. It runs on a fixed set of dimensions, a shared data basis, and a symmetric price test. Its output is a recorded outcome: the first name, the second, neither, or a documented tiebreak between two passes.
Three preconditions keep the exercise honest. Both names must already deserve the work on their own. Each should have survived the negative screen in the value-trap safety checklist and accumulated the evidence a completed due diligence process produces. Comparing a vetted name against an unvetted one launders the weaker case. The dimensions of comparison are fixed before either stock's numbers are on the table, because metrics chosen after seeing the data reliably flatter a favorite. And both names get the same data basis and the same methods, which the next two sections cover.
The boundary with neighboring work also matters. Rendering a proceed, shelve, or reject verdict on one dossier is single-name analysis. Sorting out research sources that disagree about the same stock is a question of sources and methods. The SEC's investor-education material on researching investments covers the evidence-gathering that precedes all of it. A head-to-head sits after those steps: two names, each defensible alone, competing for one decision. Most advice on how to compare stocks jumps straight to a metric table. The table turns out to be the least important part, and without the preconditions it is the most misleading one.
Put both stocks on the same data basis
Comparison amplifies data problems. An error in either input lands directly in the gap between the two names, and the gap is the whole output. Four alignments remove the most common distortions before any judgment starts.
One source. Two platforms can disagree about the same company's earnings because they make different choices about dilution, amortization, and one-time items; why valuations differ across platforms documents the mechanics. Pulling stock A from one provider and stock B from another imports those choices into the comparison as phantom differences. One as-of date. Prices, market capitalizations, and multiples move daily, so both names get priced on the same day, and the date goes in the note.
Aligned periods. Fiscal years end in different months, so the latest annual report of one company can be half a year staler than the other's. Trailing-twelve-month figures for both names remove most of the offset; what remains is the difference in quarter-end dates. Same definitions. Diluted share counts for both, lease-adjusted leverage for both or neither, and the same treatment of one-time items. Where a single number carries the comparison, verify it against the primary filing in the company filings on SEC EDGAR.
A screener is the practical shortcut to most of this. Because the stock screener computes its fundamentals from one provider with one set of definitions across its US coverage, two names pulled from it already share a data basis. The remaining manual work is the as-of date and the one-off adjustments, which no automated surface can decide for you.
Compare like with like, dimension by dimension
With the data aligned, the comparison runs on five dimensions, each answering one question. Business quality asks whether reinvested profit compounds value. Read it through return on invested capital against each firm's own cost of capital, not through headline return on equity, which leverage and buybacks inflate. Financial strength asks whether the balance sheet survives a bad stretch: leverage, interest coverage, and the refinancing calendar. Earnings quality asks whether the reported numbers deserve the comparison at all. The accrual gap between net income and operating cash flow is the master check, with receivables growth and the adjusted-earnings gap behind it. Growth durability asks how long growth can persist: the reinvestment rate, the returns earned on new capital, and whether past growth came from the business or from accounting. Valuation asks what the price buys, and it comes last so the price does not color the other four reads.
Figure 1. Five like-for-like dimensions for a two-stock comparison
Each dimension answers one question and carries one recurring trap. The reads stay separate until the verdict step.
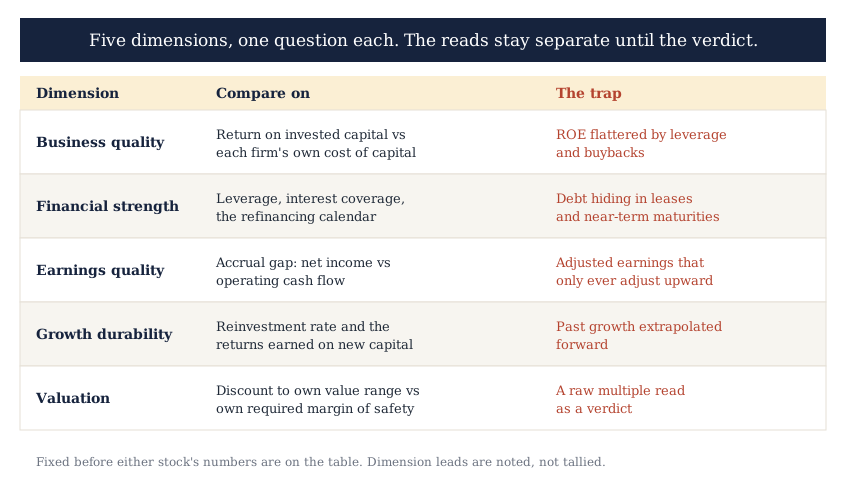
Keep the five reads separate. The natural instinct is a comparison table that names the stronger stock per row and tallies the rows at the bottom. The tally is the trap. It assigns equal weight to unequal dimensions, and it lets three narrow leads on minor dimensions outvote one deep problem on a major one. Note each dimension's read, note the size of the gap, and hold the judgment until the verdict step.
A standardized checklist does part of this work mechanically. The Investment Score runs the same 28 documented checks on both names across valuation, financial strength, and performance, which puts the two dossiers on identical criteria. Read a score gap as a prompt rather than a verdict. Open the three category subtotals and see where the gap sits; the category the two names split on is usually where the comparison should slow down.
Industry context calibrates each read. A 12 percent operating margin is strong for a grocer and thin for enterprise software. Each company's reads therefore get judged against its own industry base rates before the two are held side by side. Damodaran's industry datasets publish margins, returns on capital, and multiples by sector for exactly this calibration.
Why raw multiples mislead in a head-to-head
The most common comparison in practice is also the least reliable. Stock A trades at 12.5 times earnings and stock B at 22.5, so A is the cheaper stock and, by sleight of hand, the better purchase. The arithmetic is right and the inference is wrong. A multiple is a price divided by one year of one metric. Everything else that determines value (growth, margins, reinvestment needs, leverage, risk) is compressed into it invisibly. Two companies deserve different multiples whenever those drivers differ, and they almost always differ.
Part of the distortion is mechanical. Price-based multiples price the equity slice alone: a leveraged company at 12 times earnings can be more expensively priced, enterprise-wide, than an unlevered one at 16. Enterprise-value multiples such as EV/EBITDA repair the capital-structure half of the problem, which makes them the better cross-company lens when leverage differs. They still cannot repair the growth and risk half.
Multiples earn their place in a head-to-head as context, never as a conclusion. Compare each stock's multiple to its own industry range and its own history, using sector benchmark data to anchor what normal looks like. An anomaly is a question to investigate: cheap against the sector for a reason the dossier already explains, or cheap for a reason it missed? The verdict-grade comparison converts each price into a discount against that company's own valuation range.
Compare margins of safety, not upsides
Value each name with the same method discipline before comparing anything. If a discounted cash flow fits both businesses, run it with the same structure for both. Use the same cash flow growth logic, a discount rate built the same way, and the same terminal growth reasoning. Anchor both to the same risk-free rate from the current 10-year Treasury yield. The InvestViable Valuator holds that structure fixed by exposing the same core inputs for every covered ticker: the cash flow growth path, the discount rate, and the terminal growth rate. Two valuations built on one structure differ only in their inputs, never in their machinery, which is the property a comparison needs.
Then run the price test symmetrically. The margin of safety formula is the discount of price to value: intrinsic value minus price, divided by intrinsic value. The bar it must clear is not fixed. A riskier, less predictable business requires a wider margin than a stable one. So the comparison is never margin against margin. It is each stock's margin against its own requirement, and the working number is the surplus or shortfall.
Illustrative arithmetic makes the point. Stock A trades at $40 on $3.20 of trailing earnings, 12.5 times. Its base-case value is $48, so its margin of safety is (48 - 40) / 48, about 17 percent. As a cyclical whose due diligence produced two findings that each widen the required margin, it requires 25 percent, so it falls short by roughly 8 points. Stock B trades at $90 on $4.00 of earnings, 22.5 times. Its base-case value is $120: a 25 percent margin against a 20 percent requirement for a steadier business. The optically expensive stock is the only one that passes its own price test.
Figure 2. The cheaper multiple is not the better price
Each stock's price is tested against its own value range and its own required margin of safety, not against the other stock's multiple.
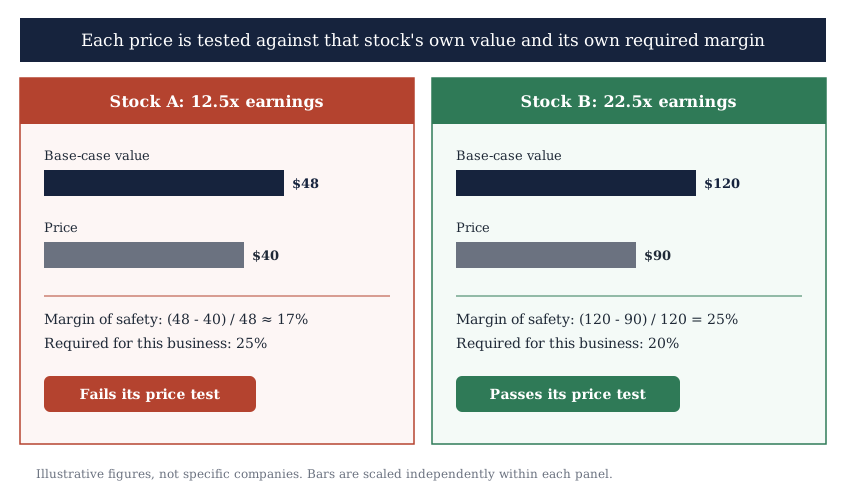
Upside comparisons invert this discipline. Ranking two names by percent-to-fair-value rewards the one with the more aggressive valuation inputs, since upside is largest exactly where the model is most optimistic. Ranking by margin-of-safety surplus, computed against per-name requirements, rewards the name whose price most over-protects against its own specific risks. The second ranking is the one that survives being wrong.
The verdict has four outcomes, not two
A head-to-head runs as two absolute verdicts plus a tiebreak. Each name passes or fails its own price test first, and the relative question arises only if both pass. That ordering exists because the forced choice is the deepest bias in comparative work. Put two names side by side and one of them starts to feel like the answer. The stronger of two overpriced stocks is still overpriced.
So there are four outcomes. Choosing neither is a full outcome: both names fail their own price tests, the comparison gets recorded, and the capital waits. A single pass decides itself; the passing name proceeds, and the near-miss does not earn partial credit for being close. When both pass, the tiebreak begins, and it stays qualitative on purpose. Ask which margin surplus is larger relative to its requirement, which thesis carries the milder failure mode, and which business you understand well enough to hold through a bad year.
Tiebreaks do not average dimensions. If stock A leads on quality while stock B leads on price, the two do not cancel. Identify each candidate's binding constraint, the single finding most likely to break its case, and ask which constraint you would rather live with. Then write the decision down. The note needs five lines: the data basis and date, the dimension reads, the two margins against their requirements, the outcome, and the trigger that would reopen it. For a name that proceeds to purchase-grade work, the stock valuation report is where that record matures. The comparison note slots in as its decision section.
Where a head-to-head comparison fits in your workflow
The comparison is the last mile of a funnel, and it only works when the funnel ran first. Screening narrows the US universe on mechanical criteria, and a slice of the Stock Universe such as value stocks is one place to start. Scoring ranks the survivors, valuation prices the shortlist, and documentation makes each case auditable. The five-step valuation workflow names those stages in order. A head-to-head arrives at the very end, when the funnel has done its job so well that two defensible names remain and only one fits.
It is worth running even when the choice looks obvious, because every purchase is already a comparison. Buying one stock implicitly prefers it to everything else the same capital could hold. The framework only makes that preference explicit and auditable: same data basis, same dimensions, same price test, recorded outcome. The name that loses does not disappear. It returns to the watch pool with its note attached, and a price move or a new filing reopens the comparison in minutes rather than hours. Run this a few dozen times and the notes start showing you your own biases: the dimension you overweight, the tiebreak you keep dodging. Each entry carries its reasoning, ready to be checked against what actually happened.
InvestViable does not publish buy or sell recommendations on individual securities. All analysis is based on public financial data and a transparent methodology. The Investment Score formula is proprietary; the inputs and what the score evaluates are documented.