
Start with interest coverage: EBIT divided by gross interest expense, both drawn from the same period. Add back capitalized interest, because a construction-heavy company charges part of what it owes to the balance sheet. Next read the covenant definitions in the credit agreement, since the leverage ratio a lender tests is a defined term and rarely matches the one you computed. Then pull the maturity schedule from the long-term debt footnote and find the year whose principal exceeds what operations produce. Coverage says whether the company services its debt today. Covenants say who controls the company if it stops. The maturity schedule says when the question gets asked.
Why a leverage ratio answers the wrong question
The safety checklist that anchors this pillar screens solvency with the debt-to-equity ratio and flags readings above 2.0 for small companies. That is the right first filter, and the five-step safety checklist is where it belongs. It is also a stock measured against a stock, and three things fall straight out of it.
The denominator is an accounting residue. Book equity is paid-in capital plus retained earnings, less treasury stock, adjusted for accumulated other comprehensive income. Preferred stock and noncontrolling interests sit inside that balance unless you remove them deliberately. A company that has repurchased shares for a decade carries a small or negative equity balance while its business is unchanged. When equity turns negative the ratio stops being interpretable; a reading of minus 400 percent is not four times worse than minus 100 percent. Price to book and when book value carries information works through those components.
The ratio also has no time dimension. Three turns of leverage with nothing due for seven years is a different situation from three turns with a bond maturing in March. Nothing in the ratio separates them.
And it carries no price. The same debt at 4 percent and at 11 percent produces different businesses, because the cash cost of carrying it nearly triples.
There is a fourth problem, and it is the one that makes the ratio hard to compare across companies. Book equity is an accounting figure, and the market prices equity at market value. The same company can read three turns of leverage on the balance sheet and one turn against its market capitalization. Lenders and rating agencies mostly sidestep the question by using net debt to EBITDA instead. Both terms in that ratio are claims or flows, so it travels between companies in a way debt-to-equity does not.
Credit analysis replaces that stock-against-stock reading with three measures that contain flow, timing and price: coverage, covenant headroom, and the maturity ladder. Every one of them is disclosed. None of them appears on a standard screen.
One scope note before the mechanics. Everything here applies to non-financial corporates. A bank funds its own lending with borrowed money, leverage there means the regulatory capital ratio, and the framework differs; valuing a bank stock starts there instead.
Which earnings figure belongs in an interest coverage ratio
Interest coverage asks how many times over the operating profit covers the interest bill. The standard form, times interest earned, is earnings before interest and taxes divided by interest expense. Both figures come from the same income statement and the same consolidated entity, on a trailing twelve-month basis unless the business is cyclical.
Three component choices decide the answer.
Gross or net interest. Use gross interest expense. Netting interest income against it credits the company for returns on uncommitted cash.
Capitalized interest. A company building long-lived assets capitalizes part of the interest it incurs into the carrying amount of those assets. Interest expense on the income statement then understates interest incurred by exactly the capitalized amount. ASC 835-20-50-1 requires the filer to disclose both the total interest cost incurred and the amount capitalized. It usually sits in the debt or interest note. Add the capitalized amount back into the denominator. One caution: EBIT already carries depreciation on interest capitalized in earlier periods, which matters most for a company ramping construction.
Which earnings line. EBIT is the conservative choice. EBITDA coverage adds back depreciation and amortization, which is defensible over one or two years and misleading over ten, because those assets do eventually need replacing. EBITDA less capital expenditure is the stricter version, and cash interest paid from the supplemental cash flow disclosure survives noisy accruals best. Owner earnings and free cash flow sets out why the capex deduction matters.
Take one company, with figures in millions: EBIT of 420, interest expense of 96, capitalized interest of 14, depreciation and amortization of 260, and capital expenditure of 300. Coverage on EBIT and expensed interest is 420 divided by 96, or 4.38. Adding capitalized interest gives 420 divided by 110, or 3.82. The EBITDA and EBITDA-less-capex versions read 6.18 and 3.45 on that same denominator.
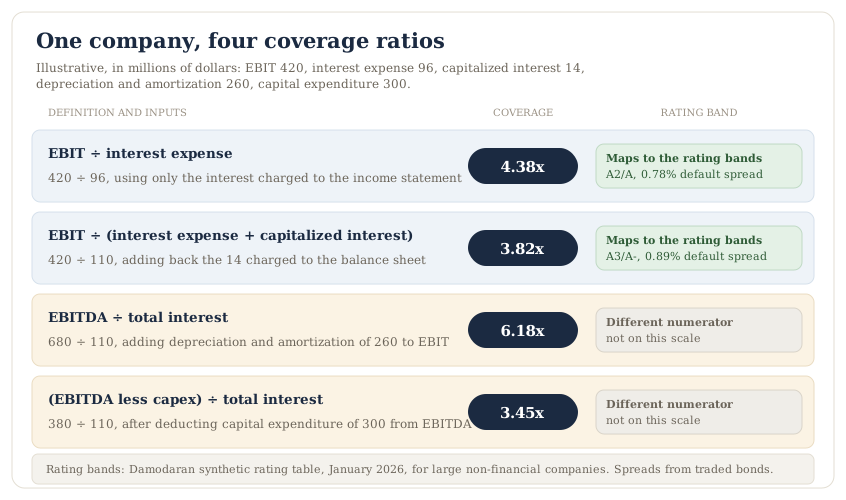
That is one company and a spread of 3.45 to 6.18 depending on the numerator. Damodaran publishes a table linking interest coverage to a synthetic rating and default spread, built from all rated U.S. companies and dated January 2026. The page does not state which numerator it assumes; the synthetic-rating method uses EBIT over interest expense, so read only the EBIT rows against it. On that basis 4.38 falls in the A2/A band at a 0.78 percent spread, and 3.82 falls one notch into A3/A- at 0.89 percent. The capitalized-interest disclosure alone moved the implied rating. Feeding an EBITDA ratio into the same bands changes the numerator without changing the scale, which reads the company better than the source supports.
For a cyclical business, run the ratio on a trough year instead of the trailing one, and normalizing earnings for cyclical stocks covers how to choose that year.
What a covenant is and where the filing keeps it
A covenant is a promise written into the credit agreement, and the type decides what breaking it costs.
Maintenance covenants are tested on a schedule, usually quarterly, whether or not the company does anything. Bank revolvers and term loan A facilities typically carry them: a maximum net leverage ratio, a minimum interest coverage ratio, sometimes a fixed-charge coverage test. A company can breach one in a quiet quarter simply because earnings fell.
Incurrence covenants are tested only when the company acts. High-yield bond indentures and covenant-lite term loan B facilities use them. The company may not raise more debt, pay a dividend or make an acquisition unless the stated ratio holds after the action. The financial tests in an incurrence package do not fail on their own. They block. Other covenants in the same indenture still can. A reporting covenant can become a default if the issuer misses a filing deadline and the cure period runs out, with no company action required.
The practical difference is control. A maintenance breach hands the lenders a default, and with it the leverage to reprice, demand security, or restrict what management does next. An incurrence package leaves management free while the business deteriorates, right up to the maturity. Neither structure is safer; they move the same risk to different points in time.
The full terms rarely appear in the 10-K body. The debt note and MD&A usually summarize the financial covenants and state compliance, but the defined terms sit in the agreement itself. The credit agreement is filed as an exhibit, usually under Exhibit 10, attached to a 10-K, a 10-Q, or an 8-K announcing the financing. EDGAR filing search finds it, and reading a 10-K like a value investor covers the reading order for the rest of the filing. The exhibit index in Part IV lists the material contracts.
Then read the definitions, because this is where most of the analysis goes wrong. Consolidated EBITDA in a credit agreement is a defined term, not the figure you computed. It carries add-backs the parties negotiated: restructuring charges, transaction costs, and run-rate cost savings that have not happened yet, sometimes capped and sometimes not. A company can sit comfortably inside a 4.00 times covenant while leverage computed from reported figures reads 4.8 times. The gap comes from the add-backs, and from the covenant netting cash where your reported figure may not. Both numbers are correct against their own definitions, and the add-back discipline in earnings quality red flags applies directly.
Headroom is the figure worth carrying forward. Say the covenant caps net leverage at 4.00 times, and the covenant-defined ratio currently reads 3.20 times. The ratio divided by the cap is 0.80, so EBITDA has 20 percent to fall before the test fails. That holds net debt constant. Where falling earnings also burn cash, the numerator rises and the real headroom is smaller than the arithmetic shows. Run it every quarter; headroom that shrinks for three consecutive quarters is the signal, and the level it shrank from matters less.
How to read a maturity schedule for a refinancing wall
Regulation S-X requires the filer to state each issue or type of long-term obligation, either on the balance sheet or in a note. The disclosure covers its general character, its rate of interest, its maturity date or serial maturities, and a brief indication of priority. In practice that is the long-term debt footnote, and it usually carries a five-year maturity table.
If you were taught to look for the contractual obligations table in MD&A, stop looking. The current text of Item 303 prescribes no such table. It requires a narrative analysis of material cash requirements from known contractual and other obligations, specifying the type of obligation and the relevant time period. The data moved into the footnote and the prose.
Regulation S-X carries one further disclosure that is easy to miss. It requires the amount and terms of unused long-term financing commitments to be disclosed when significant. That includes the commitment fees, and the conditions under which the commitments may be withdrawn. An undrawn revolver is only capacity while its drawdown conditions hold, and those conditions usually include the maintenance covenants above. Covenant headroom and available liquidity are therefore the same question.
Three readings turn the table into an assessment.
Concentration. Compare each year's scheduled principal against what the business generates after capital expenditure, plus committed capacity. Take a company with 1,200 million of term debt maturing 0, 150, 900 and 150 across the next four years, producing about 220 million a year after capex. Years one, two and four are routine. Year three is not: 900 against 220 has to be refinanced, funded from the revolver if it is still in place, or covered by asset sales.
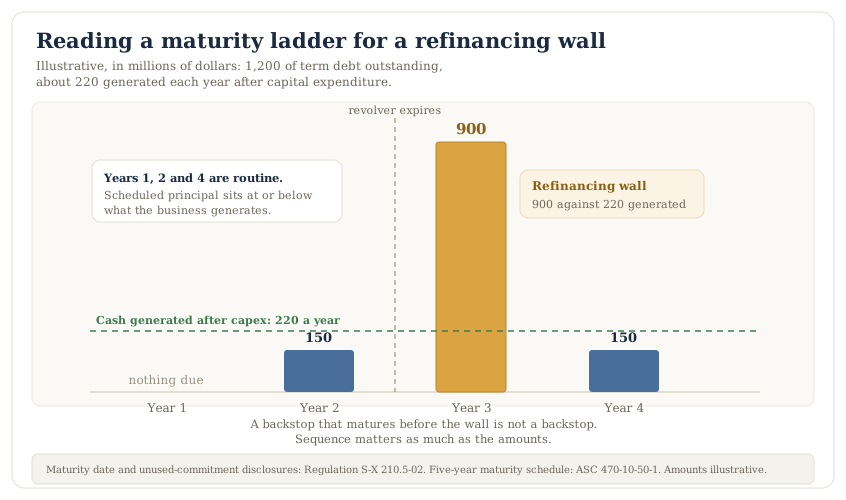
Sequence. Check whether the revolver expires before or after the nearest large maturity. A backstop that matures first is not a backstop.
Repricing. Debt issued at 3 percent maturing into a market that prices the same credit at 7 percent is not a rollover. It is a permanent increase in the cash cost of the business. Multiply the maturing principal by the rate difference before assuming a refinancing is neutral.
Capital-intensive sectors live inside this schedule permanently. Coverage for a regulated utility, like those in the utilities slice of our Stock Universe, reads against a different baseline than a software company's. The same holds for REIT stocks in our Stock Universe, where the ladder and the cost of debt are the business model rather than a feature of it.
Net debt, component by component
Net debt is total debt less cash. Both terms need their components named.
Total debt is short-term borrowings, the current portion of long-term debt, long-term debt, and finance lease liabilities. It is not total liabilities. Accounts payable and accrued expenses are operating items, so sweeping them in produces a figure nobody else is quoting.
Cash is where the judgment starts. Subtracting the full cash and equivalents balance assumes every dollar could retire debt tomorrow. Some of it cannot. Working cash the business needs day to day is committed, and restricted cash pledged under an agreement is not available at all. Cash held at subsidiaries may carry a tax or regulatory cost to move. Short-term marketable securities are usually included, and if you include them, say so.
Four items sit on the boundary, and each one moves the answer.
Operating lease liabilities. Since ASC 842 they appear on the balance sheet, and for a retailer, a restaurant group or an airline they are the largest fixed obligation the company has. Rating agencies treat them as debt-like. Whether you do is a choice; making it silently is not.
Pension and post-employment deficits. An underfunded plan is a claim on future cash that ranks ahead of shareholders in substance, whatever its accounting caption says. Rating agencies add the deficit to debt and differ on whether to tax-effect it, so name the basis you used.
Preferred stock and noncontrolling interests. Neither belongs inside net debt, and both still reduce the common claim. In the enterprise value bridge they are subtracted alongside net debt; in a fixed-charge coverage test the preferred dividend is a charge ranking ahead of the common. Net-net and the liquidation value floor works through where those claims land once the company stops being a going concern.
Securitized receivables. Whether they are debt turns on whether the transfer qualified as a sale. If the receivables stayed on the balance sheet, the funding raised against them is a secured borrowing.
Then state the basis every time you quote a multiple. Three and a half times leverage is several different numbers. It depends on whether the debt is gross or net, whether the EBITDA is reported or covenant-defined, and which period that EBITDA covers. Two analysts can quote the same company more than a turn apart and both be right. InvestViable's Investment Score runs 28 checks worth 31 points on a 0 to 100 scale, grouped into Valuation, Financial Strength and Performance. Its fixed 31-point denominator keeps scores comparable across companies, and a leverage multiple needs the same fixed definition before two figures can be compared.
What the credit market has already priced
An agency rating is an opinion produced on a lag, so it starts the assessment without settling it. It is also unavailable for most of the companies a screen returns, since only issuers with public debt get rated. The synthetic table fills that gap. Place the company by its coverage ratio, then read the band and the default spread the table attaches to it. Those spreads come from traded bonds as of the table's data date.
A rating also answers a different question than the one an equity analyst is asking. Agencies assess the probability of default and the loss a lender would take if it happened. Neither is the same as the risk carried by the residual claim. A company can be an excellent credit and a poor equity, because the conservative balance sheet that protects the lender may reflect a business with nothing worth financing. Read the credit work as a constraint on the equity case rather than as evidence for it.
The spread itself is the live version of the same question. Credit spreads reprice every day, so they move well before an agency acts. A spread that widens while the reported figures are unchanged is the market disagreeing with the filing.
For a baseline, the ICE BofA US High Yield Index option-adjusted spread stood at 3.16 percent on October 13, 2026. That FRED table carries exactly three years. Across the full span its widest reading was 4.61 percent on April 7, 2025, and its narrowest was 2.59 percent on January 22, 2025. Compensation for holding below-investment-grade corporate credit therefore sits in the lower third of its own three-year range.
That describes the current market, and the market can reprice. When spreads are tight, weak credits refinance cheaply, and a maturity schedule that looks manageable may be financed at a price the market will not offer twice. The maturity table tells you whether the company has to find out. A business with nothing due for five years can wait. A business with a wall in eighteen months cannot.
One boundary matters here. The current borrowing rate is also the pretax cost of debt inside a weighted average cost of capital, and choosing a discount rate for a DCF shows how it enters. That is pricing capital. This article assesses whether the capital gets repaid. The same disclosure serves both uses. Raising the discount rate for leverage and then also haircutting the cash flows for that leverage charges the company twice for one risk.
Turning a credit finding into a decision
The due diligence process sorts adverse findings into three lanes: disqualifier, discount, and monitor. Credit findings land in all three, and the measures above are what tell you which lane you are in.
A thin coverage ratio that is improving, on a business with nothing due for several years, is a discount plus a monitor item with a quarterly revisit trigger. Margin of safety as an operational rule sets out how to size that discount instead of guessing at it.
A maturity inside eighteen months that operations cannot fund, sitting behind covenant headroom that has narrowed three quarters running, is a disqualifier. It ends the analysis regardless of price.
Where a credit finding does not belong is inside the discount rate as a penalty. Forecast risk lives in the cash flow scenarios. Capital-market risk lives in the rate, anchored to current data, and the remaining estimation error lives in the margin of safety applied afterward.
The credit work also re-enters the arithmetic, not only the judgment. Net debt, preferred and noncontrolling interests together bridge enterprise value to common equity value, so every component decision above lands on the per-share answer. Take a company with 100 million shares and hold enterprise value constant. Reclassify 300 million of boundary items, such as lease or pension obligations, out of the bridge entirely, and equity value rises three dollars a share. That is a definitional choice with a per-share consequence.
Run coverage first, because it fails fastest, then the covenants that decide control when it does, then the maturity ladder that sets the clock on both. Carry the result into the valuation itself. The InvestViable Valuator exposes the cash flow growth path, the discount rate and the terminal growth rate as inputs you set yourself. Run it at more than one discount rate and growth path, and the credit view you just built becomes a range rather than a footnote. The stock screener is where the candidates that survive it come from.
InvestViable does not publish buy or sell recommendations on individual securities. All analysis is based on public financial data and a transparent methodology. The Investment Score formula is proprietary; the inputs and what the score evaluates are documented. The company figures used in this article are illustrative and exist to demonstrate the arithmetic. They are not measurements of any company.