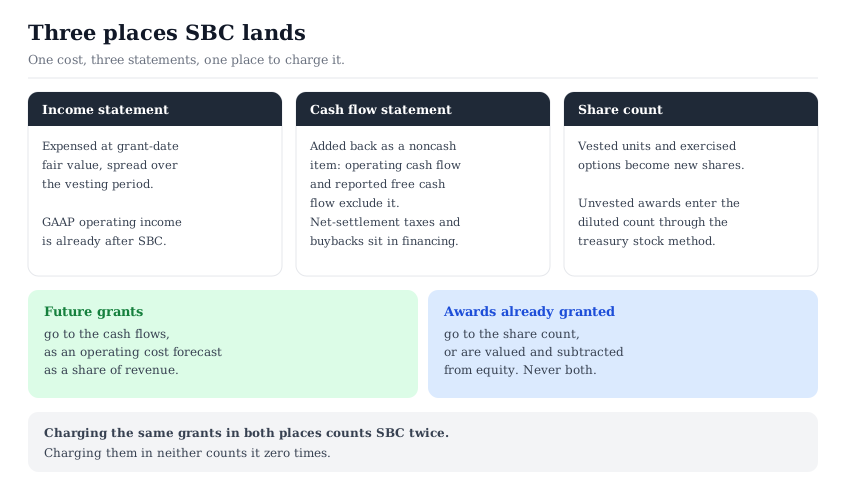
Treat future equity grants as an operating expense: deduct SBC from free cash flow, or forecast it as a percentage of revenue. Put awards that already exist into a treasury-stock diluted share count, or value them and subtract that value from equity. Then stop. Do not also grow the share count for the same future grants, and do not add SBC back while dividing by today's count.
Where does stock-based compensation enter a valuation?
A company that pays employees in restricted stock units or options records the cost in three statements. Each statement is correct by its own rules. The trouble starts when an analyst combines them.
The income statement. Each award is measured at its fair value on the grant date. That cost is recognized over the vesting period, spread across cost of revenue, research and development, sales and marketing, and general and administrative lines. GAAP operating income is therefore already after SBC.
The cash flow statement. No cash leaves when the expense is recognized, so the operating section adds SBC back to net income. Operating cash flow, and any free cash flow figure built from it, excludes the cost. Two financing lines carry the cash consequences instead: taxes paid when awards settle net of withheld shares, and the repurchases many issuers use to absorb new shares.
The share count. Vested units become new common shares, and exercised options do the same. Awards that have not vested yet sit in the diluted count, at the amount the treasury stock method allows. The count grows every year the program runs, unless buybacks retire shares as fast as employees receive them.
A per-share valuation reads all three at once. The cash flows come from the second statement, the share count from the third, and margins often from the first. Unless the analyst decides where the cost is charged, it can fall through the gaps.
The mechanics of the count itself, from authorized shares to float, are covered in basic vs diluted shares vs float. That article stops at the point where the reported diluted count becomes a floor. This one picks up the next decision: where the SBC cost belongs so it is charged exactly once.
Is stock-based compensation a real cost?
Paying an employee in shares is economically the same as selling those shares to investors and paying the proceeds out as salary. In both cases existing owners end up holding a smaller share of the same business. The only difference is that the share route skips the cash round trip, so the operating section of the cash flow statement never sees it.
Accounting standards already treat it as a cost. Awards are measured at grant-date fair value and expensed over the service period. Staff Accounting Bulletin No. 107 added Topic 14 on share-based payment to the SEC staff's guidance. It sets out the staff's views on valuing these awards, including assumptions such as expected volatility and expected term. The noncash label describes the settlement method. It says nothing about whether owners bear the cost.
A named example shows the scale. The figures below are Workday's, taken from its annual report on Form 10-K for the fiscal year ended January 31, 2026. They are dated, filed figures used to demonstrate the arithmetic. Nothing below is a valuation of that company or a view on its shares. Outputs are estimates based on user-controlled assumptions, and nothing on the platform is a buy or sell recommendation.
In that fiscal year, Workday reported revenue of $9,552 million and share-based compensation expense of $1,626 million. SBC was 17.0 percent of revenue. GAAP operating income, which is already after SBC, was $721 million, so the expense was 2.26 times operating income. Operating cash flow was $2,939 million and capital expenditures were $162 million. Free cash flow of $2,777 million, the same figure the company itself reports, therefore included an SBC add-back equal to 58.6 percent of the total.
Cash also moved. The company paid $616 million in taxes related to net share settlement of equity awards. Those shares were withheld from employees, and the company sent cash to the tax authorities instead. For an issuer with SBC at about a sixth of revenue, the add-back is the largest single line between net income and free cash flow.
The count-once rule: cash flows for future grants, share count for past ones
The rule separates awards by when they were granted. That timing decides which half of the per-share fraction should carry them.
Future grants belong in the cash flows. A company that pays in equity today will keep doing so. Aswath Damodaran's paper on employee stock options and restricted stock suggests estimating the value of future grants as a percentage of revenue. The estimate draws on the firm's own history and on more mature peers. That amount is then treated as an operating expense in each forecast year. The paper also warns that analysts must not double count future option issues.
Existing awards belong in the share count. Options already outstanding are claims on today's equity. One treatment in the paper values them at fair value and subtracts that value from equity before dividing by shares outstanding. Restricted stock granted in the past already shows up in the share count. Unvested units can sit in a treasury-stock diluted count.
Value per share = (equity value from cash flows after future SBC − value of existing options) ÷ (shares outstanding + dilution from existing units)
where future SBC is forecast as an operating cost and appears only in the numerator's cash flows. Existing awards appear only once, either as a deduction or as added shares.
One overlap hides inside the rule. Awards granted but not yet vested still carry expense that has not been recognized. At January 31, 2026, Workday reported 14.128 million unvested units outstanding and $2.5 billion of unrecognized compensation cost. That cost is expected to be recognized over a weighted-average period of about three years. Those units equal 5.5 percent of the 259.131 million shares outstanding on that date.
Count all 14.128 million units as shares, and the next three years of forecast SBC still include amortization of the same grants. The $2.5 billion is then charged twice. The treasury stock method avoids this by treating unrecognized cost as assumed proceeds, so it adds fewer shares than the full unit count. Workday's weighted diluted count of 268.117 million included 3.020 million shares of award dilution, against 14.128 million units outstanding at year end. Pair the treasury-stock count with a full SBC forecast. Alternatively, count every unvested unit and strip its remaining amortization out of the forecast expense.
What are the two common SBC errors?
Both errors are easy to make with figures that are each correct on their own. The Workday filing makes the gap concrete.
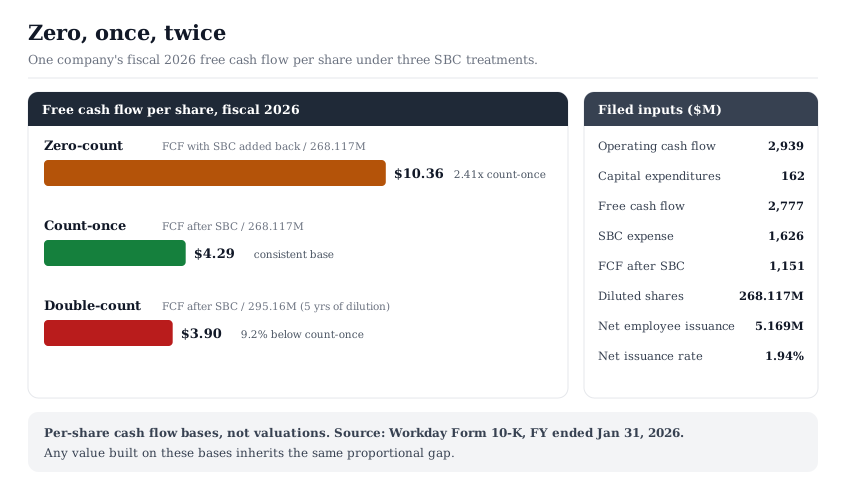
The inputs, all from the fiscal 2026 10-K, in millions:
- Reported free cash flow: $2,939 operating cash flow minus $162 capital expenditures, or $2,777
- Share-based compensation expense: $1,626
- Weighted-average diluted shares: 268.117 million
- Shares issued under employee equity plans: 7.869 million, less 2.700 million withheld for taxes, or 5.169 million net
- Shares outstanding at the start of the year: 266.352 million, so net employee issuance equaled 1.94 percent of the opening count
Zero-count. Start from reported free cash flow, which already adds SBC back, and divide by today's diluted count. $2,777 million divided by 268.117 million shares gives $10.36 per share. Future grants are charged nowhere: not in the cash flows, and not in any future share count.
Count-once. Deduct SBC from free cash flow and keep today's diluted count. $1,151 million divided by 268.117 million shares gives $4.29 per share. The zero-count figure is 2.41 times this one, so it overstates the base by 141 percent.
Double-count. Keep the SBC deduction, and also grow the share count for the shares future grants will create. At the year's 1.94 percent net issuance rate, five years of dilution multiplies the count by 1.1009, to 295.16 million. $1,151 million divided by that count gives $3.90 per share, 9.2 percent below the count-once figure. Over ten years the factor reaches 1.2119 and the gap widens to 17.5 percent.
These are per-share cash flow figures for one fiscal year, not values. Any valuation that capitalizes the base inherits the same proportional gap, whatever growth or discount rate is applied afterward.
Which metrics does SBC distort?
The same add-back that inflates free cash flow runs into every metric built on adjusted figures. Three are worth checking on any SBC-heavy issuer.
Free cash flow. Reported free cash flow treats SBC as free because operating cash flow adds it back. On the Workday figures, that is $2,777 million against $1,151 million once SBC is deducted. The difference is the whole subject of owner earnings vs free cash flow, where stock compensation is one of three gaps between the measures. Data sources also disagree on whether their free cash flow field deducts it, as why fundamentals differ across sources shows.
EBITDA and EV/EBITDA. GAAP operating income of $721 million plus $347 million of depreciation and amortization gives $1,068 million. A figure that also adds back SBC reaches $2,694 million, 2.52 times larger. The same enterprise value divided by the larger figure produces a multiple 60.4 percent lower. Comparing a company's EV/EBITDA to peers is only meaningful when every figure in the comparison treats SBC the same way. The EBITDA multiple guide covers the normalization step this belongs to.
Earnings per share and P/E. Workday's GAAP diluted EPS was $2.59 on net income of $693 million. Add back SBC net of the $295 million tax benefit the filing reports, and the numerator becomes $2,024 million. Divided by 268.117 million diluted shares, that is $7.55 per share. The same share price over $7.55 instead of $2.59 gives a P/E about 66 percent lower. This is a constructed figure to show the arithmetic, not any measure the company reports.
Companies that publish adjusted measures must follow the SEC's rules on them. The SEC's compliance interpretations on non-GAAP financial measures address the reconciliation to the most directly comparable GAAP measure. They also restate that the GAAP measure must appear with equal or greater prominence. Read the reconciliation first. If SBC is the largest reconciling item, the adjusted multiple and the GAAP multiple describe different cost structures. The broader pattern of adjustments that recur every period is covered in earnings quality red flags.
Do buybacks offset SBC dilution?
Buybacks can hold a share count flat while SBC runs at about a sixth of revenue. A flat count is easy to read as proof that dilution does not matter. The financing section shows where the cost went.
Workday's fiscal 2026 statement of stockholders' equity reconciles the count exactly. Shares outstanding started at 266.352 million. Employee equity plans issued 7.869 million, 2.700 million were withheld for taxes, and other share issuances, mainly acquisition consideration, added 0.382 million. Repurchases retired 12.772 million shares for $2,894 million, at an average price the filing reports as $226.62. The count ended at 259.131 million, down 2.7 percent.
Of the 12.772 million shares repurchased, 5.169 million, or 40.5 percent, replaced net shares issued to employees. At that average price, that portion cost about $1,171 million. Add the $616 million paid on net share settlement, and about $1,787 million of the year's cash went to absorbing the compensation program. The income statement charged $1,626 million of SBC over the same period.
The two figures will not match in any given year. Repurchase prices differ from grant-date values, and vesting schedules lag grants. The direction still holds: a flat or falling share count at an SBC-heavy issuer usually means the cost was paid in cash through financing.
The valuation consequence is a choice, not a cancellation. Deduct SBC from free cash flow and treat buybacks as a return of capital. Or keep SBC added back and treat the offsetting repurchase spend as an operating outflow. Adding SBC back and also ignoring the buybacks that absorb it charges the cost nowhere. The signal side of repurchases, whether they shrink the count or merely hold it, is covered in how to analyze stock buybacks and insider activity.
The weighted-average diluted count moved less than the year-end count, from 269.205 million to 268.117 million, or 0.4 percent. A weighted average spreads every share change across the days it was in effect. That makes the year-end count, plus the dilution from unvested awards, the better guide to claims outstanding today. The worked example above keeps the weighted diluted count so each step traces to one filed line.
Where this fits in your workflow
The SBC decision is a data-layer decision, made before any discounting starts. It sits in the same input audit as the share count and the free cash flow definition, which the DCF inputs checklist works through one category at a time. Run four checks on any company where SBC exceeds a few percent of revenue.
- Size it. Divide SBC by revenue and by reported free cash flow, using the same fiscal year.
- Read the equity note. Record unvested units, unrecognized compensation cost and its recognition period.
- Trace the cash. Pull repurchases and taxes paid on net share settlement from the financing section.
- Choose one treatment and write it down. Note where the cost is charged, which share count is used, and the filing date behind each figure.
Writing the treatment down matters because data sources make the choice silently. Why valuations differ across platforms lists SBC-adjusted share counts as one of the definitions that move per-share outputs between providers. Every filing cited here can be pulled from SEC EDGAR full-text and company search. The SEC investor bulletin on reading a 10-K maps where the cash flow statement, equity statement and notes sit in the report.
SBC-heavy business models cluster in software, so the technology slice of the Stock Universe is a practical place to practice the check. The InvestViable stock screener filters 3,000+ US stocks on fundamentals and the Investment Score. The InvestViable Valuator then runs a DCF on the core inputs the analyst controls: the cash flow growth path, the discount rate and the terminal growth rate. None of them is an SBC setting, so confirm how the starting cash flow treats SBC before reading the result. For how data quality decisions like this one propagate through a stock database, see the data-quality pillar on stock market database design.
InvestViable does not publish buy or sell recommendations on individual securities. All analysis is based on public financial data and a transparent methodology. The Investment Score formula is proprietary; the inputs and what the score evaluates are documented. The company named above appears only as the source of filed figures used to demonstrate the arithmetic. No valuation of that company is performed or implied, and the five-year dilution path in the worked example is illustrative.