
Pick a life for research spending and hold it constant. Sum the unamortized share of each past year's R&D into a research asset. Restated operating income equals reported operating income plus this year's R&D minus this year's amortization. Restated capital equals reported capital plus the research asset at the start of the year. Report the life you used, and show how the result moves under a shorter and a longer one.
Why does expensing R&D distort operating income and invested capital?
US accounting has charged research and development to expense since FASB Statement No. 2, issued in October 1974. The statement requires R&D costs to be expensed when incurred and the amount to be disclosed. That requirement now sits in ASC 730 of the Codification. The rule is simple to apply and easy to audit, which is its strength.
The weakness shows up in two places. On the income statement, the whole year's spending is charged in the year it happens, even when the products it funds will sell for years. On the balance sheet, the asset that spending builds never appears at all. Operating income is understated whenever research spending is growing, and invested capital is understated whenever research spending exists.
Return on capital inherits both errors at once. When spending grows, the numerator is too low, and the denominator is always too low. The reported ratio can therefore sit above or below the economic one. Aswath Damodaran's 2009 paper on valuing companies with intangible assets makes the related point. Conventional measures can produce negative reinvestment rates and overstated returns for such firms, because the largest investment is missing from both.
Neighboring articles stop short of the restatement. The price-to-book guide cites the expensing rule as a reason book equity runs low, and leaves it there. The comparison of ROIC vs ROE vs ROA defines the return metrics on reported figures. This article changes the inputs those metrics are computed from. Acquired technology is a separate case: it reaches the balance sheet at the price paid, which the guide to goodwill and acquired intangibles covers. Internally generated research never does.
How do you choose an amortization life for R&D?
The amortizable life is the analyst's estimate of how long research spending keeps paying off. It covers the time research takes to become a product and the years that product earns. No filing states it, so it is a judgment, and the judgment drives every restated figure.
Damodaran's paper offers one documented convention, and it is worth stating exactly. The life varies by firm and reflects the commercial life of the resulting products. A drug company gets a long life, because approval takes years; his worked example uses 10 years for Amgen. A software company gets a shorter one, because its products emerge from research faster. Amortization is straight-line. The current year's spending is treated as fully unamortized, on the assumption that it happens at year end. Each of the prior years then loses an equal slice every year.
That convention is one option among several. An analyst can tie the life to the company's own evidence. Release cadence, the product lifecycle in the business section and the years a platform version stays on sale all qualify. Another approach sets the life by industry and applies it unchanged to every peer. A third skips the single point and reports a range of lives from the start. Whichever route you take, the rule that matters is consistency. Use one life per company over time, and one life across the peers you compare.
Shorter lives shrink the research asset and pull the restated figures toward the reported ones. Longer lives build a larger asset, spread each year's spending more thinly, and widen the gap. The worked example below uses five years for a software company. It then reruns the numbers at three and four years, so the size of the judgment is visible.
The arithmetic is mechanical. Damodaran's site publishes an R&D converter spreadsheet that capitalizes the expense, values the research asset and restates operating income. Building the table yourself takes a few minutes and shows where every figure comes from.
How do you build the research asset from past R&D?
A five-year life needs six years of R&D: the current year plus the five before it. Each 10-K income statement covers three years, so two filings are enough.
The figures below are ServiceNow's, taken from its annual report on Form 10-K for the fiscal year ended December 31, 2025, filed January 29, 2026. Earlier years come from its Form 10-K for fiscal 2022. They are dated, filed figures used to demonstrate the arithmetic. Nothing below is a valuation of that company or a view on its shares. Outputs are estimates based on user-controlled assumptions, and nothing on the platform is a buy or sell recommendation.
The company reports a single research and development line, in millions of dollars:
- 2020: $1,024
- 2021: $1,397
- 2022: $1,768
- 2023: $2,124
- 2024: $2,543
- 2025: $2,960
The filing also states that all development costs for software it sells were charged to R&D expense. Costs incurred between technological feasibility and general release were not material. None of the spending in the table has already been capitalized as a product-software asset.
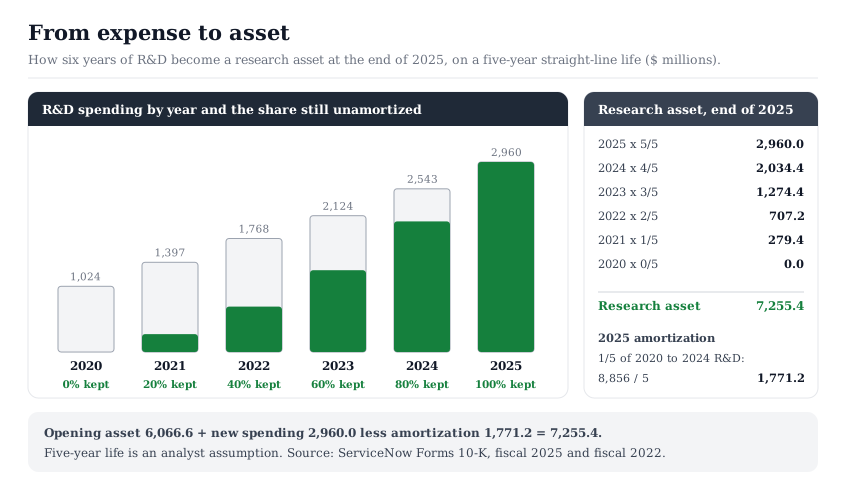
On a five-year life, the 2025 spending counts in full. Four fifths of 2024 remains, or $2,034.4 million. Three fifths of 2023 adds $1,274.4 million, two fifths of 2022 adds $707.2 million, and one fifth of 2021 adds $279.4 million. The research asset at the end of 2025 is $7,255.4 million.
The year's amortization is one fifth of each of the five prior years, 2020 through 2024. Their sum is $8,856 million, so amortization is $1,771.2 million.
The same method gives a research asset of $6,066.6 million at the end of 2024. The two balances reconcile exactly: $6,066.6 million plus $2,960 million of new spending, less $1,771.2 million of amortization, equals $7,255.4 million.
How does capitalizing R&D change operating income and ROIC?
With the asset built, the restatement takes three lines. ServiceNow reported 2025 revenue of $13,278 million and income from operations of $1,824 million. R&D was 22.3 percent of revenue.
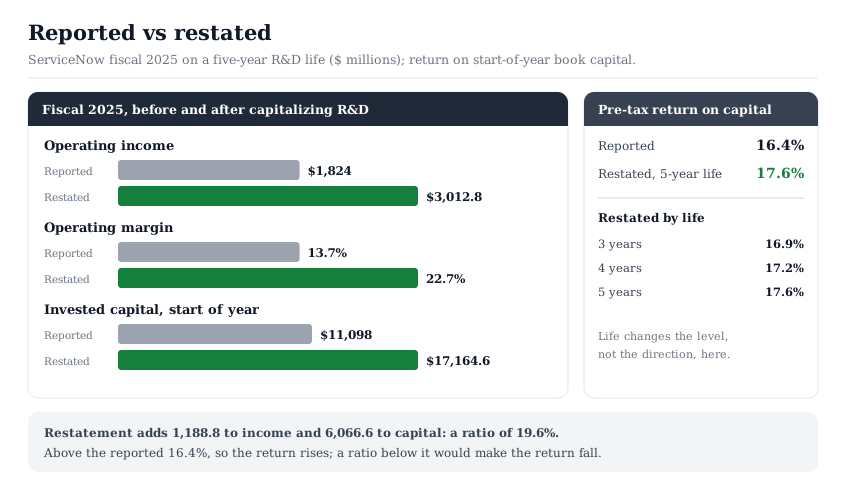
Operating income. Add back the year's $2,960 million of R&D and subtract $1,771.2 million of amortization. Restated operating income is $3,012.8 million. The operating margin moves from 13.7 percent to 22.7 percent.
Invested capital. Damodaran's illustration divides a year's operating income by capital at the end of the prior year. At December 31, 2024, stockholders' equity was $9,609 million and long-term debt was $1,489 million, so book capital was $11,098 million. Adding the opening research asset of $6,066.6 million gives restated capital of $17,164.6 million.
Return on capital. Pre-tax return on capital rises from 16.4 percent to 17.6 percent. Pre-tax figures keep the comparison free of any tax-rate assumption, as in Damodaran's own example.
The direction is not fixed. In the paper, Amgen's 2008 pre-tax return on capital fell from 25.4 percent to 20.4 percent after the same adjustment. The reason is the ratio between the two additions. The restatement adds R&D minus amortization to the numerator, here $1,188.8 million, and the research asset to the denominator, here $6,066.6 million. Their ratio is 19.6 percent. Because that sits above the reported 16.4 percent, the blended return rises. For Amgen the same ratio was 11.2 percent, below its reported return, so the return fell.
The life changes the level, not the direction, for this company. At four years, restated return on capital is 17.2 percent, and at three years it is 16.9 percent.
One more definition matters more than R&D does here. ServiceNow held $9,873 million of cash and marketable securities at the end of 2024. Netting them out would cut reported capital to $1,225 million, lifting reported return on capital to about 149 percent and the restated return to about 41 percent. On that definition the restatement lowers the return instead of raising it. Neither version is wrong, but each answers a different question, so state which one you use.
What does capitalizing R&D change in a DCF?
Less than the restated income suggests, and more than the cash flows show. Damodaran's paper sets out both halves.
Free cash flow does not move. Restated operating income rises by R&D minus amortization, and reinvestment rises by exactly the same amount. For ServiceNow in 2025 that amount is $1,188.8 million: the year's net investment in the research asset. It is also the increase in the asset between the two year-end balances. The cash the company generated is identical either way, and the cost of capital is unaffected.
What moves is the reinvestment rate and the return on capital. Expected growth is a function of both, so the restatement gives a forecast a consistency check it otherwise lacks. On reported figures, a research-heavy company can appear to grow fast while reinvesting little beyond its capital expenditures. Once research counts as investment, the reinvestment behind that growth becomes visible and can be compared with the growth rate assumed.
The DCF guide sets out the model this feeds. The restatement does not replace any of its inputs. It audits one of them: the growth path. A forecast that assumes high growth while the restated reinvestment rate falls should be questioned before it is used, a step the DCF inputs checklist places among the operating inputs. The same logic runs backward in a reverse DCF. There, the growth a price implies can be compared with the reinvestment the restated figures show.
Some research only sustains the products a company already sells. That share behaves like maintenance capital spending. The split between maintenance and growth spending, covered in owner earnings vs free cash flow, applies to the research asset as well.
In the InvestViable Valuator, the analyst sets the cash flow growth path, the discount rate and the terminal growth rate. The tool has no R&D setting, so this adjustment stays the analyst's work on the filings, and its result informs the growth path.
Where does capitalizing R&D mislead?
The method replaces one accounting convention with an analyst's convention. Four weak points deserve a written note in any restatement.
Short-cycle spending. Part of every R&D budget maintains existing products: bug fixes, compliance updates, keeping a platform current. That work pays off within the year. A long life applied to the whole budget inflates the research asset with spending that was really an operating cost.
Failed programs. Straight-line amortization never writes anything off. A drug program abandoned in phase two stays in the research asset until its slices run out. The asset therefore measures cumulative spending, not surviving value. A company with a run of failures shows a larger asset than its pipeline justifies.
Acquired research. Research bought through an acquisition follows business combination accounting instead. ServiceNow's goodwill rose from $1,273 million to $3,578 million during 2025, and its net intangible assets from $209 million to $1,121 million. Those balances already sit in capital, and the research staff an acquisition adds start appearing in the R&D line from that date. Using start-of-year capital, as above, keeps the two separate for one year. Over a longer series, check the business combination note before reading research growth as organic.
Peer inconsistency. Two analysts with different lives produce different returns from identical filings. Some companies also capitalize part of their software costs under ASC 985-20 or ASC 350-40, so part of their spending is already on the balance sheet. Read the accounting policy note first, as in the ServiceNow example, and apply one life across the peer set.
Companies can move costs onto the balance sheet themselves, which is a different matter. The section on capitalizing costs in earnings quality red flags covers that company-side choice, made to lift reported profit. The analyst-side restatement is disclosed, consistent and applied to every peer, which is what separates it. At sector level, sector valuation fundamentals shows how expensing builds the same distortion into every sector average.
R&D also carries stock-based compensation. ServiceNow's policy note lists it among research expenses, so capitalizing R&D capitalizes that compensation along with salaries. Decide how share-based pay is treated before the restatement, then treat it identically for every peer.
Where this fits in your workflow
The restatement belongs in the data layer, before any multiple or model is built. Apply it wherever R&D is a material share of revenue, as ServiceNow's 22.3 percent is. The filings sit on SEC EDGAR, and the guide to reading a 10-K shows where the income statement and the accounting policy note are.
- Collect the series. Pull R&D for the current year and as many prior years as the longest life you will test, plus one.
- Read the policy note. Confirm how much software or development cost is already capitalized, and whether R&D includes acquired research.
- Write the life down. State the life, its source and the reason, before you see the result.
- Build and reconcile. Compute the opening and closing research asset, the amortization, and the rollforward between them.
- Restate and bracket. Recompute operating income, capital and return on capital at your life and at one shorter and one longer.
- Carry it forward. Compare the restated reinvestment rate with the growth path in your forecast.
Software and drug developers sit at opposite ends of the life range. Peer sets in the SaaS slice of the Stock Universe and the pharma slice of the Stock Universe show that judgment at its widest. Candidates for the restatement can be shortlisted with the InvestViable stock screener, which applies rule-based filters to 3,000+ US stocks on fundamentals and the Investment Score. The restatement itself stays outside the tool: it runs on the filings, with the life written down beside the result.
InvestViable does not publish buy or sell recommendations on individual securities. All analysis is based on public financial data and a transparent methodology. The Investment Score formula is proprietary; the inputs and what the score evaluates are documented. The company named above appears only as the source of filed figures used to demonstrate the arithmetic. No valuation of that company is performed or implied, and the amortization lives in the worked example are analyst assumptions.