
Use a credit spread in three steps. First, build the pretax cost of debt as a Treasury yield plus a default spread, both read on the same date. Take the spread from the company's traded bonds, or from a synthetic rating based on interest coverage when no bonds trade. Second, apply the tax rate and confirm that the after-tax cost of debt sits below the cost of equity. Third, compare the equity risk premium with the market spread on Baa-rated bonds, and write down the reason when the two diverge from their historical relationship.
What does a credit spread measure?
A corporate bond promises a fixed set of payments. Its yield is the discount rate that equates those promised payments with the bond's price. The credit spread is that yield minus the yield on a Treasury security with matching cash flow timing. It is what investors demand for lending to one company instead of the federal government.
The spread bundles three components. The first is expected loss: the probability of default multiplied by the share of principal that lenders do not recover. The second is a premium for carrying that loss risk, which rises when investors are less willing to bear it. The third is liquidity, because a corporate bond is harder to sell quickly than a Treasury note.
A hypothetical bond shows the split. Suppose lenders expect a 2 percent annual default rate and a 40 percent recovery. The expected loss is 2 percent times 60 percent, or 1.2 percent a year. If that bond trades at a 3 percent spread, 1.8 points of it pay for the risk premium and for liquidity.
Federal Reserve researchers isolate the second component. A FEDS Note on the excess bond premium defines it as the part of corporate bond credit spreads that expected default risk does not explain. The measure was introduced by Gilchrist and Zakrajšek in 2012, and the note reads it as a gauge of risk appetite in the corporate bond market. A spread can therefore widen with no change in any company's chance of default.
Two terms need fixing before going further. Here, credit spread means an observed market quantity, read from bond prices or an index. Default spread means the figure attached to a rating or a company for the purpose of building a cost of debt.
The Treasury yield underneath every spread is a separate input with its own transmission. How interest rates flow into stock valuation follows that base rate into a valuation. This article starts where that one stops, with the premium for default risk layered above it.
How index spreads are built: option-adjusted spreads by rating bucket
Most published spread series are indexes of many bonds. The ICE BofA series on FRED are the common reference. Their notes describe each figure as the spread between an option-adjusted spread index of all bonds in a rating category and a spot Treasury curve. Each constituent bond's spread is weighted by its market capitalization. The ICE BofA US Corporate Index option-adjusted spread covers bonds rated BBB or better. Its high yield counterpart covers bonds rated BB or below.
The option adjustment matters because many corporate bonds are callable. The issuer can repay early when rates fall, which leaves the bondholder short an option. A callable bond's yield therefore includes payment for that option on top of credit risk. The option-adjusted spread removes the option's value. It is also measured against the whole spot Treasury curve rather than one maturity point.
The rating buckets show the structure clearly. On October 13, 2026, the FRED series read as follows, as one illustration of construction:
- AAA: 0.40 percent
- AA: 0.59 percent
- A: 0.70 percent
- BBB: 1.03 percent
- BB: 1.91 percent
- B: 3.17 percent
- CCC and lower: 12.67 percent
The steps are not even. Moving from BBB to BB adds 0.88 points. Moving from BB to B adds 1.26 points, and from B to CCC adds 9.50. For an equity analyst that convexity is the main feature. A company near the bottom of a band can be one downgrade away from a very different price for its debt.
A second family uses a different construction. Moody's Baa yield relative to the 10-year Treasury subtracts the 10-year constant maturity yield from Moody's seasoned Baa corporate yield. FRED's notes on that yield series state it uses bonds with maturities of 20 years and above. On October 13, 2026, it read 6.67 minus 5.21, or 1.46 percent. The BBB option-adjusted spread read 1.03 percent that day.
That gap is a construction difference. The Baa series sets long bonds against a 10-year benchmark, with no option adjustment. Compare any spread only with its own history. The Baa series has one practical advantage: it runs from January 2, 1986. Since April 2026 the ICE series on FRED carry only three years of observations.
How does a default spread become the cost of debt?
The pretax cost of debt is a Treasury yield plus a default spread. The discount rate and WACC walkthrough names the yield on a company's bonds as the proxy for that rate. When the company has traded bonds, that yield already contains both legs. Use bonds whose maturity sits close to the forecast horizon. Coupons, maturities and call terms sit in the debt footnote and in the prospectus supplements filed on SEC EDGAR.
Work one illustrative company through the stack. The base is the 10-year Treasury yield of 4.18 percent on December 31, 2025, from FRED's DGS10 series. The default spread is 1.84 percent, the BB figure in a rating table dated January 2026. The next section shows where that figure comes from.
The pretax cost of debt is 4.18 plus 1.84, or 6.02 percent. Interest is tax-deductible, so at a 21 percent tax rate the after-tax cost is 6.02 times 0.79. That gives 4.76 percent.
The cost of equity sits on the same base. Take a beta of 1.2 and the implied equity risk premium of 4.23 percent entering 2026. Beta times the premium is 5.08 points, so the cost of equity is 9.26 percent. With market-value weights of 75 percent equity and 25 percent debt, the two legs contribute 6.94 and 1.19 points. The weighted average cost of capital is 8.13 percent.
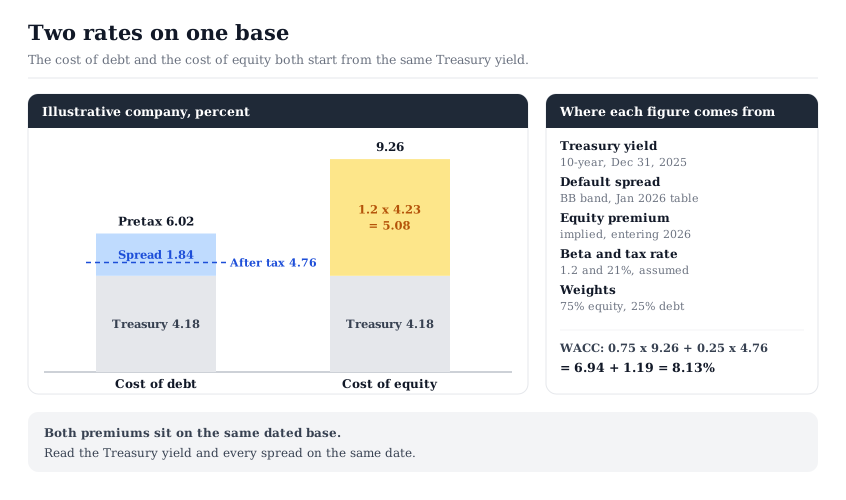
Both legs must come from the same date. Pair the January 2026 table spread with the 5.21 percent Treasury yield of October 13, 2026, and the result is 7.05 percent. That figure mixes two dates and describes neither. A same-date market version on October 13 adds the BB spread of 1.91 percent to 5.21 percent, giving 7.12 percent. Between the two dates the pretax rate rose 1.10 points. The Treasury leg supplied 1.03 of that. The remaining 0.07 sets a table spread beside an index spread, so it mixes spread movement with a difference in construction.
One approximation is worth stating. An option-adjusted spread is measured against the whole spot curve, so adding it to the 10-year yield alone is a shortcut. The size of the error depends on how steep the curve is around the bond's maturity, so note the shortcut when the curve is steep.
When a company has no traded bonds: the synthetic rating route
Most listed companies have no traded bonds and no agency rating. The synthetic route rates them from their own income statement. Aswath Damodaran publishes a table linking interest coverage to a synthetic rating and default spread. The page states that its data is as of January 2026. The coverage-to-rating link comes from all rated US companies, and the spreads come from traded bonds. Separate columns cover large non-financial firms and financial service firms.
The steps are mechanical. Divide operating income by interest expense to get the coverage ratio. Find the band, read the rating and spread, and add the spread to a Treasury yield from the same date. Which earnings and interest figures belong in that ratio is a separate question. How to analyze company debt settles it, along with covenants and maturities. This section takes its output and turns it into a rate.
The illustrative company earns operating income of 300 million against interest expense of 140 million. Coverage is 300 divided by 140, or 2.14. In the large-firm column that falls in the band from 2.00 to 2.25, rated Ba2/BB, with a spread of 1.84 percent.
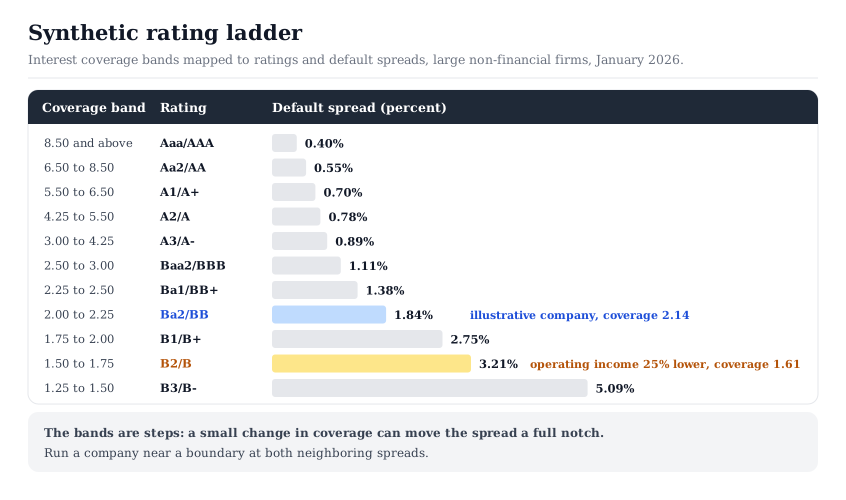
The table has cliffs. Cut operating income by 25 percent to 225 million, and coverage falls to 1.61. That lands in the B2/B band, with a spread of 3.21 percent. The pretax cost of debt rises from 6.02 to 7.39 percent, and the after-tax cost from 4.76 to 5.84 percent. A smaller move matters near a boundary. A company at 2.24 sits at a 1.84 percent spread, while one at 2.26 sits at 1.38 percent.
Treat the bands as steps, and run a company near a boundary at both neighboring spreads. The valuation sensitivity analysis method covers how to present that pair as a range. Capital-intensive issuers, such as the regulated companies in the utilities slice of our Stock Universe, fund a large share of their assets with debt. For them the band carries more weight in the blended rate.
Three cautions apply. A single trough year can place a cyclical company several notches lower than its normal earnings would. Banks use the separate column, and the firm-level framework itself differs for them, as valuing a bank stock explains. And a table spread is an average for a rating, while an actual loan also prices security, covenants and maturity.
Credit spreads and the equity risk premium: two prices for related risks
Lenders and shareholders are paid to bear losses in the same bad years. The difference is rank. Lenders are paid first and their upside stops at interest and principal. Shareholders hold the residual claim. For the same company, the cost of equity should therefore sit above the pretax cost of debt. In the worked example it does, at 9.26 against 6.02 percent.
The market-wide version of that check compares two published series. Damodaran's implied equity risk premium series is solved from index prices at each year-end. The Baa series above gives the corporate spread on the same dates. Four year-end pairs illustrate the relationship:
- End of 1999: premium 2.05 percent, Baa spread 1.73 percent, ratio 1.18
- End of 2008: premium 6.43 percent, Baa spread 5.82 percent, ratio 1.10
- End of 2022: premium 5.94 percent, Baa spread 1.99 percent, ratio 2.98
- End of 2025: premium 4.23 percent, Baa spread 1.72 percent, ratio 2.46
The ratio ranges from 1.10 to 2.98 across these four dates. The relationship moves too much to serve as a conversion factor, so no equity premium can be derived from a spread by multiplying.
The paths through two stress years differ as well. During 2008 the Baa spread widened from 2.52 to 5.82 percent, and the implied premium rose from 4.37 to 6.43 percent. Both prices of risk rose together. During 2022 the spread moved only from 1.85 to 1.99 percent, while the implied premium rose from 4.24 to 5.94 percent. Equity was repriced while credit barely moved.
That divergence is why the spread works best as a cross-check on the premium. Suppose a model holds the equity premium fixed while credit spreads have doubled. That choice needs a written reason. Suppose instead the premium sits below the contemporaneous Baa spread. The model then prices a broad equity position as safer than lending to a Baa company. Each condition is a prompt to look again at the inputs.
Choosing the premium itself is a different task. The equity risk premium explained covers the historical, implied and survey methods. A credit spread does not choose among them. It tests whichever figure was chosen against an independent market price.
What can a credit spread not tell an equity analyst?
It quotes a promise, not an expectation. A bond yield discounts the promised payments. For low-rated debt, some of those payments will not arrive, so the expected return to lenders is below the yield. Adding a 12.67 percent CCC spread to a Treasury yield gives the rate the company pays if it pays in full. It does not give lenders' expected return. For investment-grade borrowers the gap is small. For distressed borrowers it can dominate the cost of debt.
It prices a capped claim. Lenders care about the downside up to the face value of their claim. Growth that doubles a company's value adds almost nothing to a senior bond. Two companies with the same rating can therefore carry the same spread and very different equity outcomes. The spread carries no information about upside.
It mixes sentiment with default risk. The excess bond premium described earlier moves with risk appetite. A wider index spread may mean investors demand more for the same expected losses. It need not mean defaults have become more likely.
Index levels move with composition. An index spread averages bonds of different sectors, maturities and issue sizes. When a large issuer is downgraded from BBB to BB, it leaves one index and joins another. Both averages can shift with no change in any remaining bond's price.
It carries no date for reversion. A spread that sits low or high against its own history says nothing about when that will change. The article on what CAPE measures and where it fails makes the same point about market multiples. Read a spread as a price observed on a date.
This article also never sets an equity yield beside a bond yield. That comparison carries its own units problem, set out in earnings yield versus bond yield.
How to apply this
The procedure fits on one page of a valuation file.
- Date both legs. Read the Treasury yield and the spread on the same day, and record the series names and that date.
- Pick the route. Use the yield on traded bonds near the forecast horizon when they exist. Otherwise compute coverage, read the synthetic band, and record the table's vintage.
- Run the neighbors. Value the company at the spread of the adjacent rating band on each side, and report the result as a range.
- Check the ordering. The after-tax cost of debt should sit below the pretax cost, and the pretax cost below the cost of equity.
- Compare the premiums. Set the chosen equity risk premium beside the same-date Baa spread. Write down why if the ratio falls outside the range history has shown.
The rate built this way is still an assumption, and it belongs in a sensitivity run. The DCF inputs checklist lists the companion checks on the other inputs. Beta and the cost of equity are covered in a CAPM beta you can defend.
The InvestViable Valuator runs a discounted cash flow on inputs the user sets: the cash flow growth path, the discount rate and the terminal growth rate. A blended rate built from the steps above goes into the discount rate field. The tool takes that rate as entered and does not derive it from bond spreads. Candidates reach that step through the InvestViable stock screener, which screens the full US universe on fundamentals and the Investment Score.
Every spread level quoted here carries its date and illustrates construction only. Spread levels change daily and the method does not. Rebuild the rate from fresh, same-date figures each time a valuation is rerun.
InvestViable does not publish buy or sell recommendations on individual securities. All analysis is based on public financial data and a transparent methodology. The Investment Score formula is proprietary; the inputs and what the score evaluates are documented. The company figures used in this article are illustrative and exist to demonstrate the arithmetic.