
Start from reported growth: current net sales divided by prior-year net sales, minus one. Then remove acquired revenue that has no prior-year match and put back the revenue lost to divestitures. Restate foreign sales at prior-year exchange rates, and take out any 53rd week. What remains is organic growth. Label every growth figure with its basis before it enters a forecast or a peer table.
What does a reported revenue growth rate contain?
A reported growth rate is simple arithmetic on two audited numbers. Divide this year's revenue by last year's, subtract one, and the result is exact. The difficulty is that the two totals rarely describe the same business.
Four effects sit inside the figure:
- Organic change. Price and volume movements in businesses the company owned in both years.
- Acquisitions and divestitures. Revenue from businesses bought during the period has no prior-year counterpart. Revenue from businesses sold disappears from the current year.
- Currency translation. Foreign subsidiaries sell in their own currencies. Their sales are translated into dollars at each year's exchange rates, so a weaker dollar lifts reported revenue even when local sales are flat.
- Calendar effects. Companies that close their year on a fixed weekday occasionally report a 53-week year. That extra week adds revenue without any change in demand.
Any growth field computed from two reported totals carries all four effects. Unless a data source states otherwise, assume its growth figure was built that way. Aggregate tables work the same way. Aswath Damodaran's historical growth dataset, with data as of January 2026, tabulates five-year compounded revenue growth by industry. A rate of that kind cannot tell acquired revenue from revenue the original business earned.
The time window is a separate question. TTM vs fiscal year covers which twelve months a figure contains, and flags mid-window acquisitions and the 53rd week as window distortions. This article covers the basis: what the growth rate is made of, and how to take it apart from the filings.
Management makes a choice here too. The basis a company leads with on its quarterly call can change from one quarter to the next. That is why earnings call transcript analysis records the basis alongside the percentage. The steps below rebuild each basis from the annual report itself.
How do you calculate organic revenue growth from the filings?
A named example makes the arithmetic concrete. The figures below come from General Mills' annual report on Form 10-K for the fiscal year ended May 31, 2026. They are dated, filed figures used to demonstrate the method. Nothing below is a valuation of that company or a view on its shares. Outputs are estimates based on user-controlled assumptions, and nothing on the platform is a buy or sell recommendation.
That fiscal year contained all four effects at once. The company sold its North American yogurt businesses and had bought a pet food business in the prior year. It also sells internationally, and fiscal 2026 ran 53 weeks against 52 in fiscal 2025.
Step 1: reported growth. Net sales were $18,424.6 million in fiscal 2026 and $19,486.6 million in fiscal 2025. Reported growth is 18,424.6 divided by 19,486.6, minus one: down 5.45 percent.
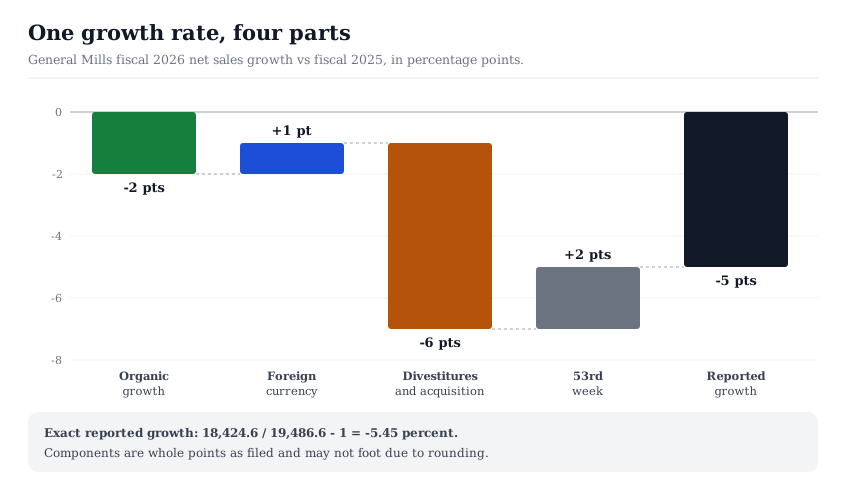
Step 2: the bridge. The MD&A breaks the change into components, in whole percentage points:
- Organic net sales growth: down 2 points
- Foreign currency exchange: up 1 point
- Divestitures and acquisition: down 6 points
- 53rd week: up 2 points
- Net sales growth: down 5 points
Step 3: subtract the non-organic layers. Organic growth equals reported growth minus each non-organic contribution, with its sign.
Organic growth = reported growth − deal effect − currency effect − calendar effect
Each effect is the contribution, in percentage points, that the item made to reported growth. Divestitures enter as negative contributions, so subtracting them adds the lost revenue back.
On the filed components: down 5 points, minus a 6-point deal drag, minus a 1-point currency tailwind, minus a 2-point week, gives down 2 points. That matches the organic rate the company reports.
The components are rounded to whole points, and the filing warns that the table may not foot. The exact reported decline of 5.45 percent cannot be split more finely than that rounding allows. Treat each component as accurate to about half a point.
What do the acquisition and divestiture notes disclose?
Deal effects are often the largest distortion in a growth series, as they were in this filing. The disclosures sit in two places: the acquisitions and divestitures note, and the segment discussion in the MD&A.
The note gives the facts of each transaction. General Mills acquired Whitebridge Pet Brands' North American premium cat feeding and pet treating business in the third quarter of fiscal 2025, for $1.4 billion. The note records goodwill and brand intangibles and adds that the results are reported on a one-month lag. It also states that the pro forma effects of the acquisition were not material. Acquisition notes often carry pro forma revenue, as if the deal had closed at the start of the prior year. When the effect is judged immaterial, that figure is simply absent.
Materiality is judged at the level of the whole company, and that is where the segment discussion matters. In the North America Pet segment, net sales rose from $2,470.8 million to $2,613.3 million, a reported gain of 5.77 percent. The segment bridge attributes 6 points to the acquisition and 2 points to the 53rd week, and shows organic growth down 3 points. The deal turned a shrinking segment into a growing one.
Six points of the segment's prior-year sales is roughly $148 million. That is about 0.8 percent of consolidated fiscal 2025 net sales, in line with the note's statement that the group-level pro forma effect was not material. The same dollars dominate the segment's growth rate.
Divestitures work in the other direction. The company completed the sale of its United States yogurt business in the first quarter of fiscal 2026, at a pre-tax gain of $1,046.5 million. It had sold the Canada yogurt business in fiscal 2025. Fiscal 2025 revenue includes a full year of United States yogurt sales, while fiscal 2026 includes them only up to the closing date. At the consolidated level, divestitures net of the acquisition cost 6 points, roughly $1.2 billion of prior-year sales.
When a sold business is presented as discontinued operations, prior years are recast and the effect leaves both periods. When it is not, the lost revenue stays inside reported growth until the sale date has a full year behind it. The company recorded the yogurt gain inside its operating results, so the lost yogurt revenue is part of the reported decline.
How do you find the constant-currency effect?
A company with foreign subsidiaries translates their sales into dollars at average rates for each period. When the dollar weakens, the same local sales translate into more dollars. Constant-currency growth removes that translation effect by restating current-period sales at prior-period rates.
The filing shows the effect most clearly in the International segment. Net sales rose from $2,797.8 million to $3,043.8 million, a reported gain of 8.79 percent. The segment bridge attributes 4 points to foreign currency exchange, 2 points to the 53rd week and 3 points to organic growth. Removing currency alone gives constant-currency growth of about 5 percent. Removing the extra week as well gives the organic 3 percent.
Three growth rates, all correct, describe the same segment: about 9, 5 and 3 percent. A model that extrapolates the first one is forecasting the exchange rate as well as the business.
SEC rules frame what the MD&A has to explain. Item 303 of Regulation S-K asks companies with material changes in net sales to describe how much came from prices, from volume, or from new products. In this filing, currency sits in the same bridge tables as a separate line, but the method behind it is the company's own.
When a filing gives no currency line, an estimate is possible. Take the geographic revenue split from the segment note. Then find the average change in each major currency against the dollar, for example from the Federal Reserve's H.10 foreign exchange release. Multiply one by the other.
An illustrative case: if 30 percent of sales are in a currency that averaged 5 percent stronger against the dollar, translation adds about 1.5 points. Hedging, local pricing and intercompany sales all blur the result, so record it as an estimate. A different question, which currency a whole valuation should run in, belongs to valuing ADR stocks.
What does a 53rd week add to growth?
Many retailers and food producers end their fiscal year on a fixed weekday instead of a fixed date. The year then runs 52 weeks, and every five or six years it runs 53 to catch up with the calendar.
General Mills' fiscal year ends on the last Sunday in May. Its accounting policy note states that fiscal 2026 consisted of 53 weeks, while fiscal 2025 and fiscal 2024 consisted of 52 weeks.
The arithmetic of an extra week is simple. If the added week is an average week, 53 weeks against 52 lifts revenue by 53 divided by 52, minus one: 1.92 percent. The filing attributes 2 points of consolidated growth to the 53rd week, consistent with that estimate. Weeks are not all alike, though. The extra week's sales depend on the season it falls in, so prefer the company's stated figure over the calculation.
The effect reverses the following year. A 52-week year compared with a 53-week year starts behind by 52 divided by 53, minus one: down 1.89 percent. A growth series that ignores both years shows a bump and then a dip, with no change in demand behind either.
Quarterly data carries the same issue in concentrated form. One quarter in a 53-week year runs 14 weeks instead of 13. That quarter's revenue runs about 7.7 percent above a 13-week equivalent, which adds roughly 7.7 points to its year-over-year growth. That is 14 divided by 13, minus one. The quarterly filings show which quarter carried it.
The fix is to normalize before comparing. Divide a 53-week year's revenue by 53 and multiply by 52 for a rough 52-week equivalent. Fiscal 2026 net sales of $18,424.6 million become about $18,077 million on that basis, under the average-week assumption.
Which growth basis belongs in a forecast or a peer comparison?
The right basis depends on the question. Reported growth answers what happened to the company's revenue line. Organic growth answers how the business the owner still holds is performing. A forecast and a peer comparison both need the second answer.
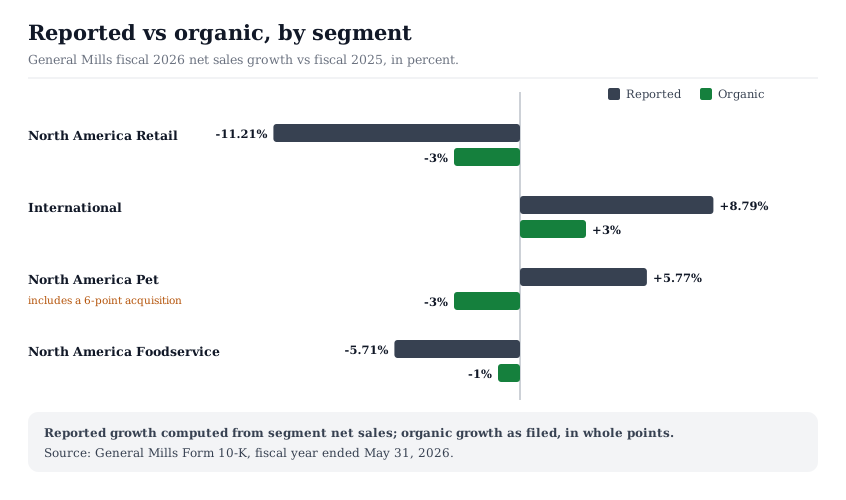
Figure 2 shows how far apart the two bases can sit inside one company. North America Pet grew 5.77 percent on a reported basis and shrank 3 percent organically. International grew 8.79 percent reported and 3 percent organically. North America Retail fell 11.21 percent reported and 3 percent organically. Foodservice fell 5.71 percent reported and 1 percent organically.
For a forecast, three rules keep the bases apart:
- Rebase the starting revenue. Remove divested revenue from the base year, so the forecast starts from the business that still exists.
- Grow the base at an organic rate. Treat acquisitions and currency as separate, named assumptions, not as part of the trend.
- Normalize the calendar. Bring a 53-week base year back to 52 weeks before applying a growth rate.
This is the growth input that the DCF inputs checklist asks the analyst to defend. It also changes how a reverse DCF reads. A market-implied growth rate is easier to judge against the organic history than against a reported series full of deals.
For a peer comparison, use one basis for every company in the set. A table that puts one company's reported growth next to another's organic growth ranks deal activity and exchange rates, not the businesses. The same discipline appears in how to compare two stocks, where every metric in a head-to-head shares one definition and one period.
Where organic growth figures mislead
Organic growth isolates the underlying business, but it is still a constructed figure. Five limits are worth checking before the figure enters a model.
It is company-defined. Organic growth is not a GAAP measure, and each company writes its own definition. General Mills' glossary defines it as net sales growth adjusted for foreign currency translation, acquisitions, divestitures and a 53rd week. Another issuer may treat an acquisition as organic after a different period, or measure currency another way. Read the definition before comparing two companies' organic rates. The earnings-side questions raised by adjusted measures are a separate subject, covered in why valuations differ across platforms.
It is rounded. Whole-point components can hide half a point each way. In the Pet segment the components sum to 5 points while the reported change rounds to 6.
It still contains price. Organic growth mixes volume and price. General Mills' organic decline of 2 points split into 1 point of lower volume and 1 point of unfavorable price and mix. In an inflationary year, a positive organic rate can sit on top of falling volume.
Acquired growth becomes organic. Once an acquired business has a full year of comparable history, its growth counts as organic. A company that buys faster-growing businesses can lift its organic rate over time without any change in the original operations.
The data source may not match the filing. A platform's growth field may be reported, may be computed over a different window, or may mix bases across years. Why fundamentals differ across sources explains how the same line item can arrive in different shapes from different feeds.
How to apply this
The growth basis is a data-quality decision, made before any growth rate is projected. It deserves the same documentation as the revenue figure itself. Five steps cover most companies:
- Compute reported growth from the two income statement totals, to two decimals.
- Read the deal notes. Record acquisition and divestiture dates, and any pro forma revenue.
- Pull the MD&A bridge. Note currency, deal and calendar contributions by segment where they are given.
- Check the fiscal year note for 53-week years in either period.
- Label the result. Store the basis, the fiscal year and the filing date next to every growth figure.
Every filing used here can be found through SEC EDGAR full-text and company search. The notes and MD&A sections sit where how to read a 10-K maps them.
Food producers make a useful practice set: several report on 52- and 53-week calendars and publish organic bridges. The consumer staples slice of the Stock Universe lists that sector on public pages. A chosen basis enters the InvestViable Valuator through the cash flow growth path, which the analyst sets along with the discount rate and the terminal growth rate. The tool does not record which basis a growth figure uses, so that label stays in the analyst's own notes. To narrow the candidate list first, the InvestViable stock screener screens 3,000+ US stocks on fundamentals and the Investment Score. For how decisions like this one shape a research database, see the guide to stock market database design and data quality.
InvestViable does not publish buy or sell recommendations on individual securities. All analysis is based on public financial data and a transparent methodology. The Investment Score formula is proprietary; the inputs and what the score evaluates are documented. The company named above appears only as the source of filed figures used to demonstrate the arithmetic. No valuation of that company is performed or implied, and the currency example is illustrative.