
A sum-of-the-parts valuation prices a multi-segment company one segment at a time. Pull segment revenue and operating profit from the segment footnote, choose a method that fits each segment's economics, and value each segment separately. Add the segment enterprise values. Then subtract capitalized corporate overhead, net debt, the net pension position, recorded litigation accruals net of insurance recoveries, and any noncontrolling interest. Divide by diluted shares. The result is a per-share value you can set against the market price. The difference between the two is what the term conglomerate discount describes.
What does a sum-of-the-parts valuation produce, and what does the segment footnote give you?
A consolidated multiple is a weighted average. When one earnings figure covers three businesses with different growth rates, margins and capital intensity, the market's multiple is a blend. The blend is not wrong, only uninformative about which business is carrying the valuation. A sum-of-the-parts valuation removes the blend: each segment gets the peer group its own economics justify, and the sum is then reduced by everything above the segments.
Multi-method stock valuation reconciles several methods on one entity; this runs one method across several businesses. Sector valuation explains why sector multiples differ but never performs the aggregation. The valuation methods guide covers what each method does, and its warning about double counting applies here.
Segment disclosure exists because the standard setters decided one consolidated number is not enough. ASC 280 governs US filers on a management approach: the segments disclosed are the ones management uses to run the company. IFRS 8 Operating Segments imposes the same logic on international filers.
A segment footnote gives you revenue, a measure of segment profit, depreciation and capital expenditure, and recent filings add significant expense categories per segment. It does not give you a segment balance sheet, a segment tax rate, or any allocation of debt. Those absences are why the bridge exists.
That disclosure is also the entry test: the method earns its keep only where the segments would not trade at similar multiples. On the 3M filing used below, segment EBITDA margins run 29.9, 24.3 and 23.4 percent. Sales growth runs plus 3.9, minus 1.3 and minus 0.2 percent, and capital expenditure 3.0, 3.6 and 1.2 percent of sales. That is moderate dispersion, thin enough that the entry test is a close call. The article proceeds on it because the peer groups the three segments would take are genuinely different industries.
Segment profit is a management-defined measure, and the footnote reconciles the segment total back to consolidated pre-tax income, usually through an operating-income subtotal. The gap is the corporate and unallocated line. It is not a rounding item, and it is the line a fast segment build most often skips.
Two checks are worth running. Whether corporate costs were already pushed into the segments, because if they were, capitalizing the reconciliation line charges them twice. And whether the segment structure changed, since a restated prior year is not the series you saved. The mechanics sit in how to read a 10-K, which covers this note and the contingencies note. Filings are at SEC EDGAR.
Segment valuation: one method per segment
Segment valuation means choosing per segment rather than once. A stable consumer business and a cyclical electronics business do not belong on the same multiple. Which valuation method to use sets out that selection logic by company type; it applies unchanged at segment level.
One constraint governs everything: values you intend to add must sit on the same side of the balance sheet. An enterprise-value multiple such as EV/EBITDA produces a firm-side value, before debt. An equity-side multiple such as price-to-earnings produces a value after debt. You cannot add a firm-side value to an equity-side value and call the total an enterprise value. If a segment needs an equity-side approach, add its net debt back before it joins the total.
Where a segment loses money, an earnings multiple has nothing to work with. Valuing unprofitable companies covers the substitutes: revenue and gross-profit multiples where the losses are a stage, an asset basis where they are a structure. Drop the segment and the build overstates; force a multiple onto negative profit and it invents value.
The worked example below runs on 3M's fiscal 2025 filing. This is a test of the algebra rather than a description of the business, and no number here is a view on the security. Every input is filed or drawn from a published dataset, with dates stated where they matter.
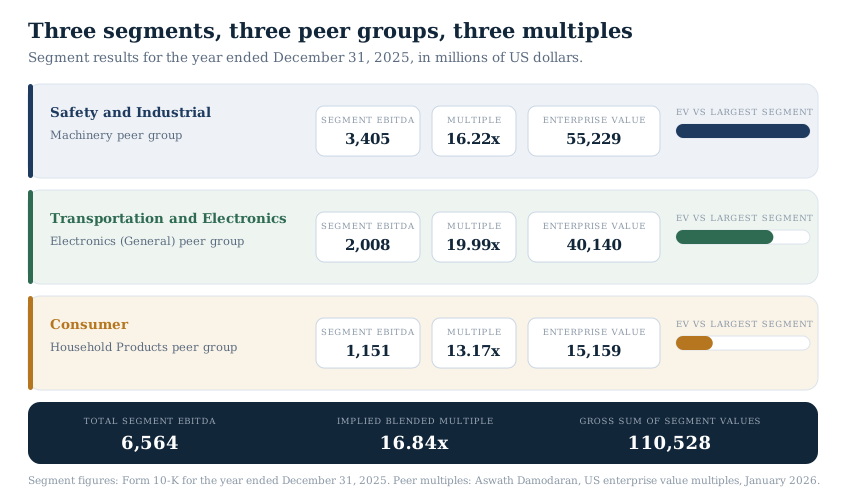
3M reported three operating segments for the year ended December 31, 2025 in its Form 10-K, filed February 3, 2026. Segment operating income and depreciation are both disclosed, so segment EBITDA is a sum of two filed quantities. It is not a standardized EBITDA and inherits the filer's segment-profit definition. Peer multiples come from Aswath Damodaran's enterprise value multiples by sector: US companies, January 2026, positive-EBITDA column.
| Segment | Net sales | Operating income | D&A | EBITDA | Peer group | EV/EBITDA | Segment EV |
|---|---|---|---|---|---|---|---|
| Safety and Industrial | 11,384 | 2,836 | 569 | 3,405 | Machinery | 16.22 | 55,229 |
| Transportation and Electronics | 8,272 | 1,436 | 572 | 2,008 | Electronics (General) | 19.99 | 40,140 |
| Consumer | 4,920 | 996 | 155 | 1,151 | Household Products | 13.17 | 15,159 |
| Total | 24,576 | 5,268 | 1,296 | 6,564 | 16.84 implied | 110,528 |
The implied 16.84 times is the total divided by total EBITDA, and the figures below carry that ratio to four decimals, 16.8385.
Those choices are judgments: Safety and Industrial could as defensibly take Chemical (Specialty) at 13.36 times. The EV/EBITDA method guide covers anchoring within a peer range.
Corporate overhead: capitalize it once, or allocate it once
The table reconciles to the filing, and the residuals point at what is missing. Segment operating income sums to the 5,268 the footnote reports. Segment net sales sum to 24,576, and 372 of corporate sales brings the company total to 24,948. Segment D&A sums to 1,296 against 1,308; the 12 difference sits in corporate. Those residuals are the head office, and nothing has valued it yet.
3M's corporate and other column reconciles the 5,268 of segment operating income down to the consolidated 4,629. The 639 gap already includes the 372 of corporate sales, so do not net the 372 against it again. The footnote decomposes it: corporate-level income of positive 75 million, net costs for significant litigation of 483, a divestiture loss of 162, and transformation costs of 69.
Only one of the four behaves like overhead. Capitalizing all 639 would treat a litigation movement, a one-time divestiture loss and the cost of a finite restructuring program as annual costs of running a head office. The corporate-level line runs positive 75 million in 2025, negative 114 million in 2024 and negative 485 million in 2023. A three-year average gives 174.67 million, and that is the figure used here.
Two caveats, both of which the checks above ask for. The line nets a corporate revenue stream that grew from 127 to 303 to 372 over the same three years. The 2023 observation also predates the April 2024 separation of a fourth segment. The average is still used. A single year of this line is worse, since the 2025 figure alone would make the head office a source of value.
A second reason the deduction is not optional: the peer multiple's denominator is a consolidated EBITDA that already bears its own head-office cost, and segment EBITDA does not. Deducting capitalized overhead is what makes the two comparable.
State the convention precisely, because the invariance it produces is narrower than it looks. The deduction always equals the cost times the allocation-weighted average of the segment multiples. Allocate by segment EBITDA and that average is the implied blended multiple by construction, so capitalizing the lump at 16.84 times and allocating pro rata both remove 2,941 million. Under any other base the two diverge: spreading the cost by segment net sales removes 2,948 million, a difference of about one cent per share. The base is an economic claim about what drives head-office cost. Whichever one you pick, charge the cost once.
How do you get from segment values to equity per share?
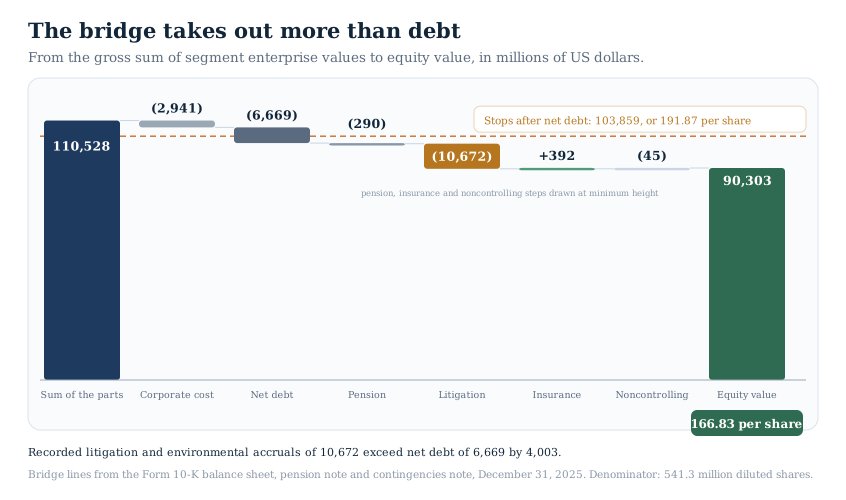
Six deductions and one addition run from the segment total to equity value. All but one are filed balances; the exception is the capitalized corporate cost you construct.
| Bridge line | Amount |
|---|---|
| Sum of segment enterprise values | 110,528 |
| Capitalized corporate cost, 174.67 at 16.8385 times | (2,941) |
| Net debt (12,602 debt less 5,933 cash and current securities) | (6,669) |
| Net pension and postretirement position (funded status) | (290) |
| Litigation and environmental accruals, recorded | (10,672) |
| Recorded insurance recoveries | 392 |
| Noncontrolling interest | (45) |
| Equity value | 90,303 |
| Diluted weighted-average shares, millions | 541.3 |
| Value per diluted share | 166.83 |
Balance-sheet lines are as of December 31, 2025.
The pension line is where this bridge nearly went wrong, and the error is the one this article exists to warn against. The balance sheet shows a single pension and postretirement liability of 1,631, and taking that figure is the obvious move. The note behind it records three plan groups. Alongside the 1,631 of non-current liabilities sit 65 of current liabilities and a 1,406 non-current pension asset. That asset belongs to overfunded international plans and is recorded as a non-current asset, not on the pension line. Funded status across all plans is a deficit of 290. Deducting the 1,631 while leaving the recorded asset out overstates the deduction by 1,341 million, or 2.48 dollars per share. Cash is netted against debt without argument; a recorded pension asset earns the same treatment.
The insurance line is the mirror case. The contingencies note records a 392 million insurance recovery receivable against the Combat Arms Earplugs settlement accrual, up from 349 a year earlier. Deduct the accrual gross and ignore the recovery, and the bridge charges the shareholder for an obligation a third party will partly fund. It is worth 0.72 dollars per share.
The noncontrolling interest looks trivial at 45 million and the step behind it is not. Segment results are consolidated, so they include businesses the parent does not wholly own, while diluted share count is a parent-only measure. Subtracting the minority claim is what makes the numerator and the denominator describe the same owners. Here the noncontrolling share was 12 million of 3,262 million of consolidated net income.
Compare the disciplined bridge with the version that stops after net debt. Sum of the parts less net debt gives 103,859 million, or 191.87 dollars per diluted share. The full bridge gives 166.83. The four balance-sheet lines the short version skips are worth 19.61 dollars per share, or 10.2 percent of the 191.87. Add the capitalized corporate cost and the full gap is 25.04 dollars.
The conventions the bridge has to name
Three choices sit inside that table and none is forced.
Leases look like an omission. The filing records 167 million of current and 363 million of non-current operating lease liabilities, and none of the 530 appears in net debt, deliberately. Operating lease cost runs through operating expenses, so the segment operating income the multiples were applied to is already net of it. Add the liability to net debt as well and the same lease is paid for twice. Capitalize the lease and add back the expense, or leave both alone; doing half costs 0.98 dollars per share.
Tax comes second. The accruals and the pension position are deducted pre-tax, and the enterprise value they come out of was built on pre-tax peer multiples. That consistency is the reason, not caution. Deducting them after tax at the 21 percent US federal statutory rate, on a base of 10,570 million, returns roughly 2,220 million, or 4.10 dollars per share. That claims a tax shield which is yours only if you also carry the matching deferred tax asset. This filing reports it at 2,541 million, down from 3,154.
The denominator comes third. The 541.3 million is the fiscal 2025 diluted weighted average, matched to a fiscal 2025 numerator. Which of the basic, diluted and outstanding counts belongs in a valuation is its own question. The cover page reports 526.7 million shares outstanding at January 31, 2026, and on that count the answer is 171.45. Neither is wrong. The weighted average matches the fiscal-year numerator; the point-in-time count matches a valuation dated today. State which you used, because the choice is worth 4.62 dollars per share.
How do you count the obligations above the segments once?
Segment values say nothing about obligations above the segments, and here those obligations dominate every other bridge line.
Five recorded accruals appear in the contingencies note at December 31, 2025. PFAS-related litigation and settlements carry 7,700 million, split between 700 million in other current liabilities and 7,000 in other liabilities. The Combat Arms Earplugs settlement carries 2,400 million. Respirator mask and asbestos claims carry 473 million excluding Aearo, with a further 59 million recorded for Aearo, and other environmental remediation carries 40 million. The five total 10,672 million, which exceeds net debt by 4,003 million. That claim is disclosed and quantified in an audited statement, though still an estimate, as the caution below sets out.
The mirror-image error is worse, because it looks like diligence. Suppose you capitalize the 483 million litigation charge at the blended 16.84 times, treating it as a permanent annual cost. The bridge then also subtracts the 10,672 million accrual. The capitalized charge alone removes 8,133 million, or 15.02 dollars per share, and it removes it for an obligation the accrual has already accounted for. The same liability is now paid for twice, once as a perpetuity and once as a balance.
The rule that resolves it is a question about the item's nature. A finite obligation with a recorded balance belongs in the bridge as a balance, and its annual charge is then excluded from the capitalized overhead. A recurring cost of running the head office belongs in the overhead and never in the bridge. An item cannot be both, and deciding which takes a reading of the note.
A third category is easy to miss. An accrual captures only the probable and estimable portion of matters that already exist, so a stream of genuinely new claims is neither a settled balance nor overhead. Here the filing's own reconciliation settles it. The 483 million is the year's movement in significant-litigation cost. A new PFAS-related settlement in New Jersey drove it, along with updates to site remediation obligations, partly offset by higher insurance recoveries. Both land in recorded balances on the same balance sheet, so capitalizing the charge as well as deducting the accrual pays twice. A reader who expects a further stream of matters not yet accrued should add a provision and say so.
A recorded accrual is an estimate under the accounting standard, not a settled amount. This filing discloses the public water supplier settlement as an estimated possible amount between 10,500 million and 12,500 million dollars. The recorded balance sits below that range for two disclosed reasons. It carries only amounts still payable, and the PFAS accrual fell from 8,600 to 7,700 during 2025 as payments outran the year's additions. It is also recorded at present value, at 5.0 and 5.2 percent on the PFAS matters and 5.6 percent on the Combat Arms settlement. Each additional 1,000 million of accrual is 1.85 dollars per share.
Reading the gap: the conglomerate discount and the questions that close it
The term conglomerate discount describes a market price below the sum of a company's parts. The same filing supplies a market reference on its cover page. Aggregate market value of stock held by non-affiliates was 81,100 million dollars as of June 30, 2025, six months before the balance-sheet date used above. Against a segment build of 90,303 the two sit about 11 percent apart. That number is not the finding. One decision inside the build moves almost as much as the whole gap.
The first question is the peer mapping, which carries more of this estimate than any other input. Substitute Chemical (Specialty) at 13.36 times for Safety and Industrial and hold everything else fixed. The gross sum falls to 100,789, the blended multiple to 15.35, the corporate cost to 2,682, and equity value to 80,823, or 149.31 dollars per share. One defensible substitution inside one segment moves the answer 17.51 dollars, which is 9,480 million of equity value. The apparent gap to the market reference was 9,203 million. A single mapping choice is worth more than the entire discount being measured, about 103 percent of it.
The second question is the method inside the mapping. Switch from EV/EBITDA to EV/EBIT on the same three segments and the same dataset, at 21.04, 29.76 and 16.25 times. The gross sum becomes 118,590 million, 7.3 percent higher, and the corporate cost recapitalizes at the blended 22.51 times to 3,932. Equity value becomes 97,374, or 179.89 dollars per share, a move of 13.06 dollars. Both now sit in the same unit. The mapping wins, but not by much. Valuation sensitivity analysis covers running these one at a time so the attribution stays clean.
The third question is the double count. Confirm that overhead is charged once. Confirm that no obligation appears both as a capitalized expense and as a balance, and that no lease is counted twice.
The fourth question is what remains, and it matters only once the first three are closed. A remaining difference can reflect a real market discount for opacity or capital misallocation across segments. It can also reflect information the footnote does not carry, such as a shared asset or a tax structure that would not survive a separation. Both are testable claims about a specific line, and neither is settled by taking a midpoint. A disagreement between two defensible builds is information, not an error to be averaged away.
Damodaran also publishes a Diversified group of 20 firms at 11.42 times EBITDA, which puts the same segment EBITDA at 102.87 dollars per share. That is not a second mapping. Diversified is a group the dataset does not define. On a 20-firm count it reads as conglomerates, so its multiple already embeds the discount and using it imports the answer.
Where this leaves the analyst
A sum-of-the-parts valuation earns its place when segment dispersion is real and the bridge lines are large. Neither of the two decisions that dominate this output is a modeling refinement. One is which peer group each segment takes. The other is whether the obligations above the segments are counted once and counted whole. The pension line alone moved 2.48 dollars per share.
A wide residual span means more of the estimate rests on judgment, which argues for a larger buffer before any position is considered. That is the logic behind treating margin of safety as an operational rule rather than a slogan.
Run the segment build alongside a consolidated estimate, not instead of one. The InvestViable Valuator runs a discounted cash flow from inputs the analyst sets: the cash flow growth path, the discount rate, and the terminal growth rate. The normalization itself is judgment applied to the filing, and it reaches the model the way every assumption does: through the inputs you set. The Valuator values the consolidated entity, so a wide gap against a segment build points at either the peer mapping or a bridge line. The InvestViable stock screener filters 3,000+ US stocks on fundamentals and the Investment Score. Slices of the Stock Universe such as industrials narrow it to where multi-segment structures are common.
InvestViable does not publish buy or sell recommendations on individual securities. All analysis is based on public financial data and a transparent methodology. The Investment Score formula is proprietary; the inputs and what the score evaluates are documented. The company in this article is a worked example on its filed data. The inputs are mechanical defaults chosen so every step can be checked, and the outputs are not estimates of what the security is worth.